FEATURE - OVERVIEW
Consumption: what’s wealth got to do with it?
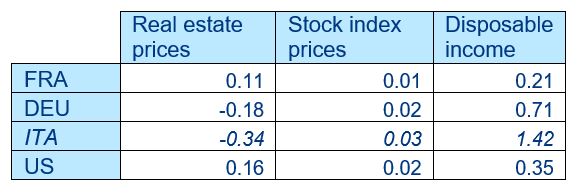
- With the cash cushion that was built during the pandemic losing its fluff, it is a good time to revisit consumption behavior, which is starting to lose steam in Europe andthe US. The wealth effect is a behavioral economic theory that suggests that asset-price fluctuations affect household spending. However, we find that the income effect overshadows the wealth effect in France, Germany, Spain andthe US. The marginal propensity to consume (MPC) per 1% difference in disposable income is 0.21% for France, 0.71% for Germany, 0.78% for Spain and 0.35% for the US. This highlights the importance of supporting household income as a tailwind to attain the much-desired economic soft landing.
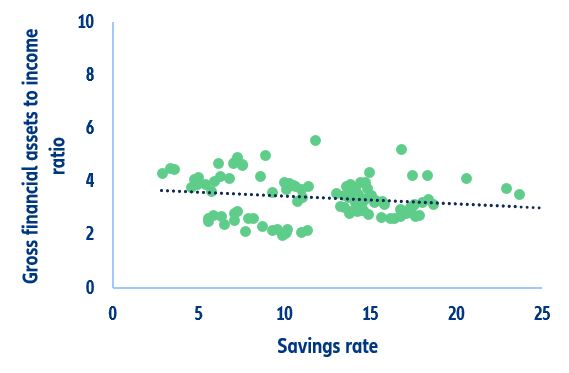
- However, the wealth effect of housing prices clearly dominates that of stock market prices almost by a factor of ten in France, Germany, Italy, Spain and the US. For continental Europe, keeping inflation at bay holds the answer to consumption, while in the US the prospect of diminishing wealth weighs on the Fed’s hopes for a stormy soft landing.