2019 was a year to forget for the German economy, 2020 won’t bring much relief

Katharina Utermöhl, Senior Economist for Europe at Allianz

Executive Summary

  • 2019 was a year to forget for the German economy…: At 0.6%, the German economy recorded its weakest GDP growth rate since the Eurozone sovereign debt crisis. Only thanks to solid growth contributions from private and public consumption as well as investment in construction a recession was avoided.
  • …that ended on a weak note…: The worst is probably behind us, but the German economy has yet to enter into a clear recovery mode. High-frequency hard data for the final quarter of 2019 for now fails to reflect the fresh – albeit timid – optimism observed in leading sentiment indicators at the turn of 2019/20. The meagre expected Q4 GDP growth performance – we expect 0.1% q/q) – suggests that German economic momentum for now has at best stabilized at low levels
  • …and 2020 will not bring much relief: For one, ongoing structural headwinds will hold back German GDP growth including the subdued global trade outlook as well as regulatory and technological challenges for the German car sector. Secondly, even though the negative inventory drag should start to fade and base effect will become more favorable as industry embarks on a gradual recovery, the acceleration in momentum will prove too weak to prop up fixed investment growth. As a result the latter should come to a standstill in 2020. Meanwhile consumption – private and public – will remain the key pillar of the German economy, but a further acceleration in spending is unlikely. Overall we expect 2020 German GDP growth to come in at a seasonally-adjusted 0.6%.

2019 was a year to forget for the German economy…

At 0.6%, the German economy last year recorded its weakest GDP growth rate since 2013. Resilient domestic demand saved the day as buoyant consumption – public (2.5%) and private (1.6%) – as well as investment in contruction (3.8%) kept the German economy from slipping into recession. Meanwhile investment in machinery & equipment also showed meagre growth (0.4%) while the contribution from the external sector (-0.4ppt)  was negative as imports (1.9%) grew more than exports (0.9%).

German manufacturing remained stuck in the dolddrums in the final quarter of 2019.

2019 full-year GDP growth suggests that the German economy ended the year on a weak note, with GDP probably rising by a meagre 0.1% q/q. Therefore despite the recent turnaround in some leading – but also highly unreliable indicators when it comes to gauging economic momentum – sentiment indicators including the Sentix and the ZEW, German industry has not yet entered into a clear recovery mode.

Figure 1 – Germany: Industrial production & manufacturing orders (3MMAV, y/y, in %)

Figure 1 – Germany: Industrial production & manufacturing orders (3MMAV, y/y, in %)

Last week’s data releases point at best to a stabilization in the industrial sector – albeit at low levels (Figure 1):

  • Manufacturing orders posted another decline in the month of November (-1.3% m/m) bringing the annual growth rate down to a three-months low of -6.5%y/y thanks to a notable decline in foreign orders.
  • Meanwhile industrial production rose by 1%m/m in November, but this will do little to end the industrial recession which Germany entered in Q3 2018.
  • German exports posted another sharp decline in November (-2.3% m/m) which fully offset the 1.5% m/m increase in October.

…2020 won’t bring much relief

In the coming quarters German economic momentum should gradually start to pick up. A strong rebound is not in the cards though: In view of the cautious outlook for global trade, structural headwinds in the automotive industry and lingering elevated political uncertainty, we expect at best mini GDP growth rates for the German economy. The risk of another negative quarterly GDP growth reading or a technical recession is not completely off the table but kept in check by the waning drag from inventories and more favorable base effects as the rate of decline in industry starts to ease. Overall for 2020, we expect German GDP growth – adjusted for working-days – to come in at 0.6%.

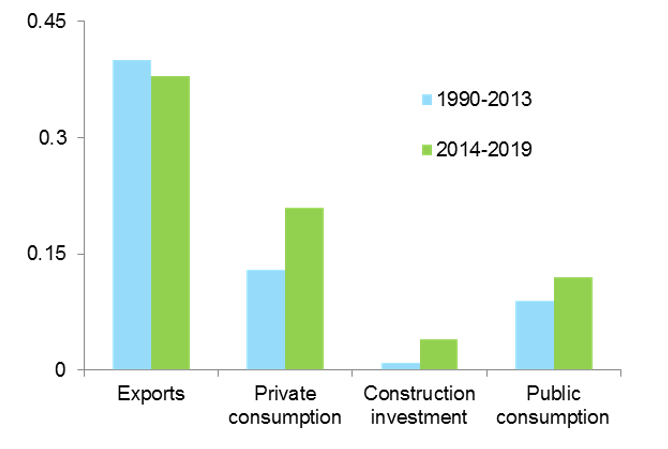
Looking at the GDP components, demand for German exports should only stage a timid recovery in line with the subdued recovery in global trade. Domestic demand will hence clearly continue to run the show in 2020, helped by a gradual rebalancing of economic growth drivers in recent years (Figure 2). Consumption – public and private – but also construction investment will remain key drivers of economic growth in 2020, but gradually loose some steam in line with the slowing labor market.

Figure 2 – Germany: Average contributions to quarterly GDP growth (ppt)

Figure 2 – Germany: Average contributions to quarterly GDP growth (ppt)

On the surface the German labor market looks in great shape but it is a lagging economic indicator and warning signals have been flashing red for severeal months now including declining numbers of unfilled position, the spread of Kurzarbeit schemes in German industry and the rise in unemployed which remains centered for now largely on temporary work arrangements. While short-work schemes and the ongoing shortage of skilled labor should keep employment levels resilient in 2020, we expect the unemployment rate to rise by 0.1ppt to 5.1%  – this is the first annual increase since 2013.

Fiscal policy to the rescue? Government spending will provide more tailwind to key growth drivers in 2020, but a larger stimulus package to prop up domestic demand is only likely if the German economy experiences a more pronounced growth setback that leads to a sharper deterioration in the labor market.

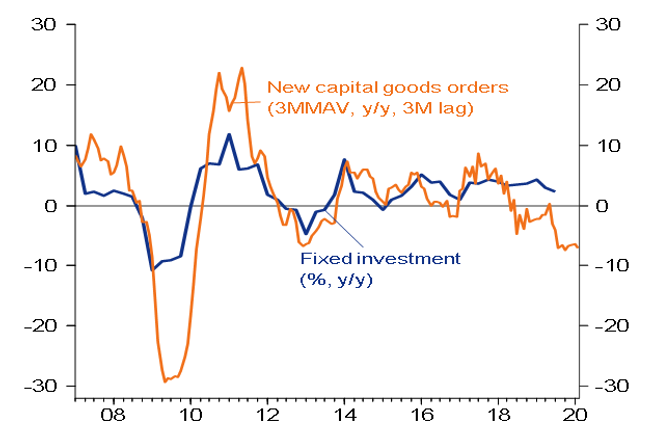
The only weak spot for domestic demand in 2020 is fixed investment (Figure 3). Given the weak growth outlook, subdued capacity utilistion rates and lingering elevated uncertainty fixed investment will largely stagnate in 2020 and stage a gradual recovery only in 2021 as export growth is picking up more markedly again.

Figure 3 – New capital good orders (3MMAV, y/y, 3M lag) vs. fixed investment (%, y/y)

Figure 3 – New capital good orders (3MMAV, y/y, 3M lag) vs. fixed investment (%, y/y)