A back-to-school tech-led sell-off. As if markets wanted to remind everyone the risks of interpreting stock market movements, major U.S. equity indices had a hard day on 03 September: the S&P 500 fell by 3.51%, the NASDAQ by 4.96% and the NASDAQ 100 by 5.23% over the day. This happened just a day after President Trump had tweeted: “The Dow Jones Industrial just closed above 29,000! You are so lucky to have me as your President. With Joe Biden it would crash.” Through this correction, markets have rekindled a long-standing question about the nature of the rally that resumed in March: Is it a bubble or not?
The stocks that had recently led the market’s march upward are the ones that have fallen the most since 03 September. Zoom has fallen by 9.23%, Tesla by 16.99%, Apple by 13.63%, Microsoft by 11.34%, Alphabet-Google by 11.14%, Netflix by 13.05%, Twitter by 10.81%, Amazon by 10.09%, Facebook by 11.38%. Interestingly, two other recent good performers have diverged: Bitcoin has fallen by 9.26%, while gold has gone up 0.92%. With a loss of only 4.90%, the equally weighted S&P 500 has fallen less than the S&P 500 (6.75%).
All this points to a tech-led sell-off. Actually, some of the stocks just mentioned peaked earlier than the market as a whole: Tesla peaked on 31 August and has lost 25.48% since then. Apple, Netflix and Zoom peaked on 02 September.
These companies are as good and promising today as they were yesterday or the day before yesterday. No specific bad news, announced or anticipated on 03 September, can justify the correction. As a matter of fact, the literature on financial bubbles concurs on this point: leaving aside the far-fetched explanations made up by rational expectations theorists, financial bubbles burst without any apparent reason or trigger. What changes when the bubble bursts is not the listed companies’ prospects, but just the price market participants are willing to pay for them. The experimental work of Nobel Laureate Vernon Smith has shown that participants in asset markets are prone to inflate bubbles even when they have perfect information about the intrinsic value of the assets they are trading . Why does this happen? Because investing is a competition in which market participants are trying to second-guess each other. Like it or not, there is nothing Mark Zuckerberg, Jeff Bezos, Jack Dorsey, Reed Hastings, Sundar Pichai, Bill Gates, Tim Cook or even Elon Musk can do about this source of uncertainty. That means that what a market participant thinks about a given stock matters less, at least in the short run, than what Mr. and Mrs. Consensus think about it. Unless and until a market participant knows what Mr. and Mrs. Consensus have already priced in, she doesn’t know what she should know before investing.
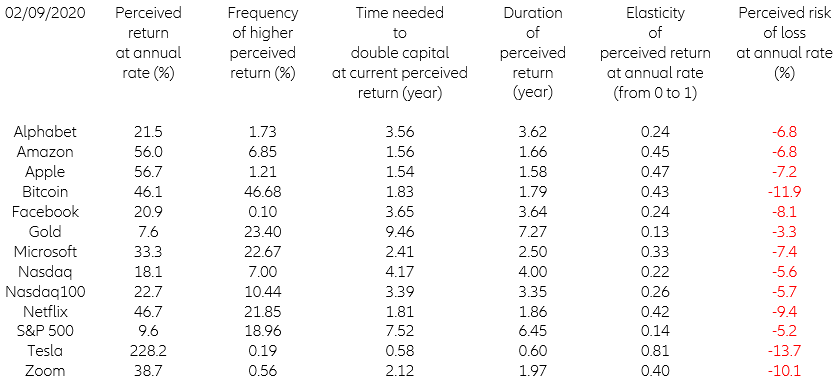
A positive feedback loop. Designed by another Nobel Laureate, Maurice Allais, a dynamic, non-linear learning algorithm provides a plausible model of how people process information and learn under uncertainty. It assumes, first, that people’s stock-return expectations are what they remember from their experience with past returns and, second, that the faster prices go up, the shorter the duration of their memory, or – put differently – the shorter the relevant past. As a consequence, the more exuberant expectations become, the more versatile or unstable they also become, because they become increasingly sensitive to the most recent returns. Table 1 presents what this model was telling us about the market’s psychology on 02 September, on the eve of the recent correction. Market participants were definitely rather exuberant, which also means easy to disappoint.
Table 1 – Equity market’s psychology as of 02 September 2020
The stocks that had recently led the market’s march upward are the ones that have fallen the most since 03 September. Zoom has fallen by 9.23%, Tesla by 16.99%, Apple by 13.63%, Microsoft by 11.34%, Alphabet-Google by 11.14%, Netflix by 13.05%, Twitter by 10.81%, Amazon by 10.09%, Facebook by 11.38%. Interestingly, two other recent good performers have diverged: Bitcoin has fallen by 9.26%, while gold has gone up 0.92%. With a loss of only 4.90%, the equally weighted S&P 500 has fallen less than the S&P 500 (6.75%).
All this points to a tech-led sell-off. Actually, some of the stocks just mentioned peaked earlier than the market as a whole: Tesla peaked on 31 August and has lost 25.48% since then. Apple, Netflix and Zoom peaked on 02 September.
These companies are as good and promising today as they were yesterday or the day before yesterday. No specific bad news, announced or anticipated on 03 September, can justify the correction. As a matter of fact, the literature on financial bubbles concurs on this point: leaving aside the far-fetched explanations made up by rational expectations theorists, financial bubbles burst without any apparent reason or trigger. What changes when the bubble bursts is not the listed companies’ prospects, but just the price market participants are willing to pay for them. The experimental work of Nobel Laureate Vernon Smith has shown that participants in asset markets are prone to inflate bubbles even when they have perfect information about the intrinsic value of the assets they are trading . Why does this happen? Because investing is a competition in which market participants are trying to second-guess each other. Like it or not, there is nothing Mark Zuckerberg, Jeff Bezos, Jack Dorsey, Reed Hastings, Sundar Pichai, Bill Gates, Tim Cook or even Elon Musk can do about this source of uncertainty. That means that what a market participant thinks about a given stock matters less, at least in the short run, than what Mr. and Mrs. Consensus think about it. Unless and until a market participant knows what Mr. and Mrs. Consensus have already priced in, she doesn’t know what she should know before investing.
A positive feedback loop. Designed by another Nobel Laureate, Maurice Allais, a dynamic, non-linear learning algorithm provides a plausible model of how people process information and learn under uncertainty. It assumes, first, that people’s stock-return expectations are what they remember from their experience with past returns and, second, that the faster prices go up, the shorter the duration of their memory, or – put differently – the shorter the relevant past. As a consequence, the more exuberant expectations become, the more versatile or unstable they also become, because they become increasingly sensitive to the most recent returns. Table 1 presents what this model was telling us about the market’s psychology on 02 September, on the eve of the recent correction. Market participants were definitely rather exuberant, which also means easy to disappoint.
Table 1 – Equity market’s psychology as of 02 September 2020