China monetary policy

China's policy mix: "proactive" and "prudent" in name, tightening in practice

22 March 2021

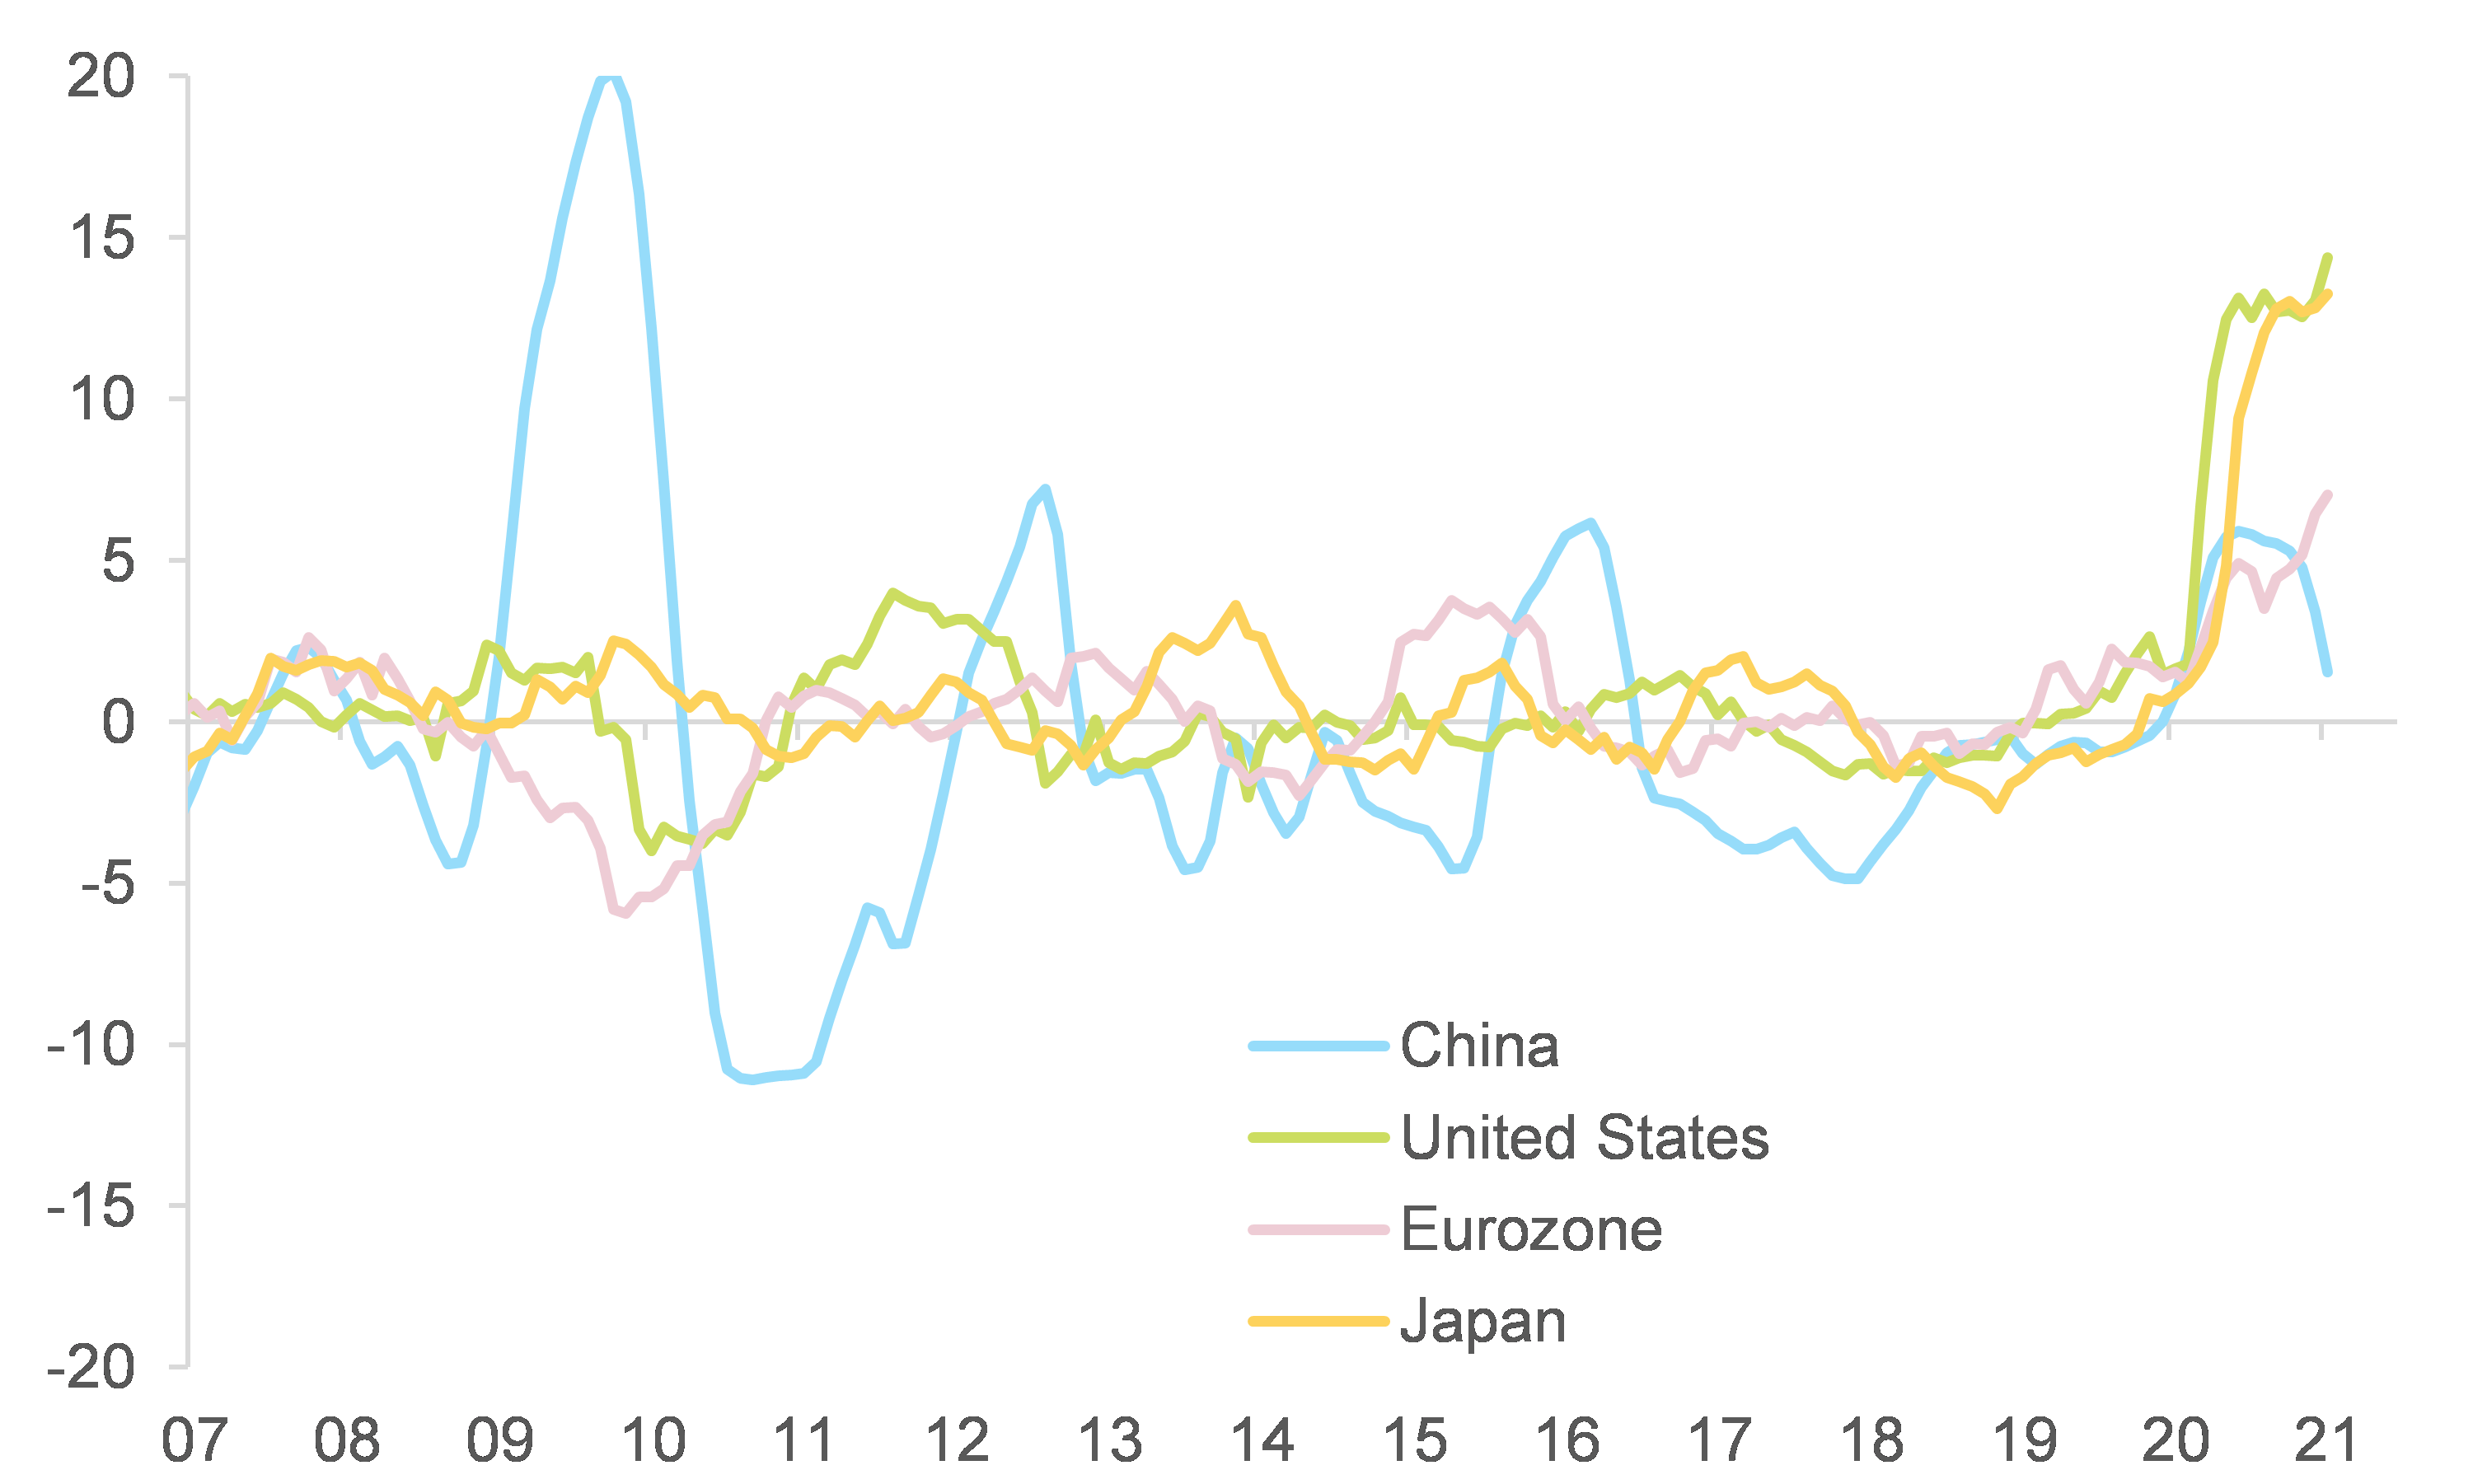
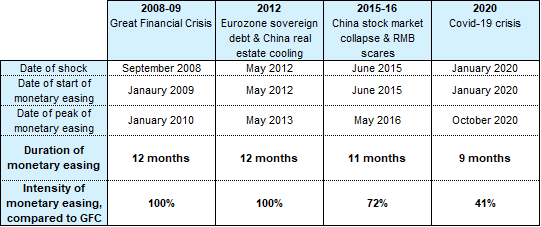
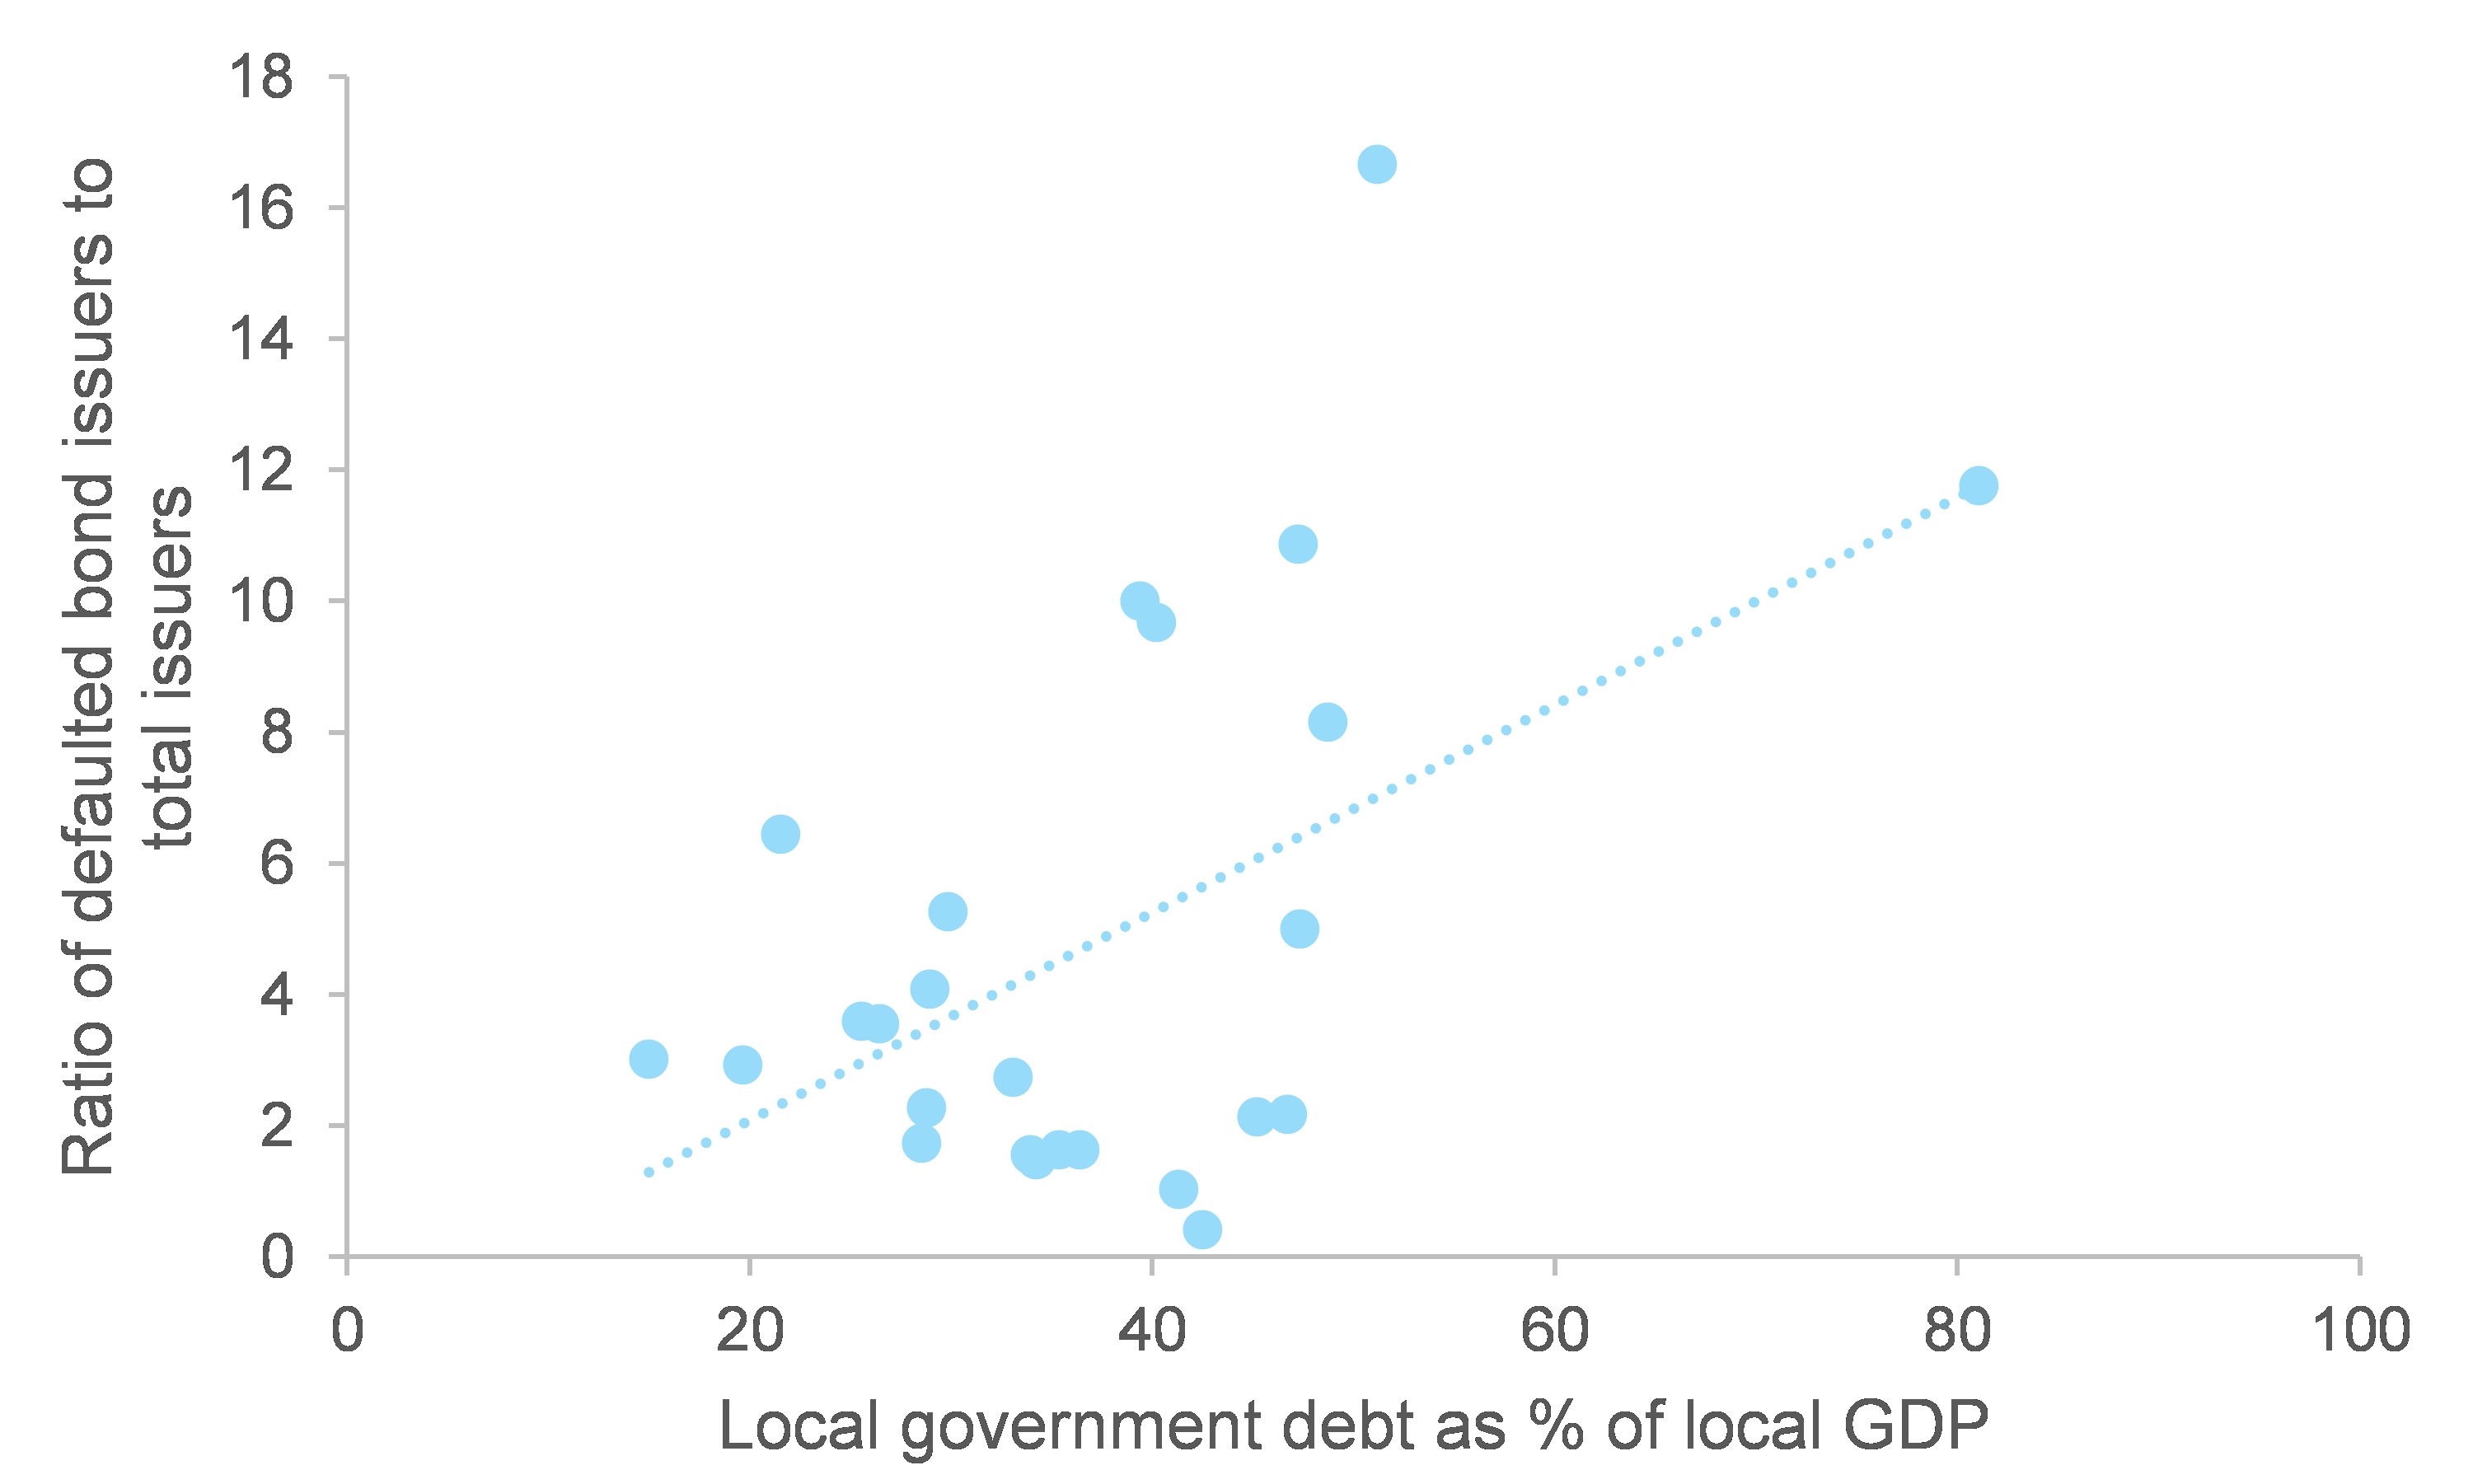
With policymakers’ focus coming back to financial stability, Chinese stimulus will not be saving the global economy this time round. But expect monetary tightening through liquidity and regulation, rather than policy rate hikes, in 2021. Authorities in China are describing the policy mix in 2021 as “proactive” on the fiscal side, and “prudent” on the monetary side. However, China’s monetary policy already started to tighten in Q4 2020, going starkly in the opposite direction compared to the world’s other major economies (see Figure 1). In fact, our proprietary credit impulse index shows that in 2020 China’s monetary easing lasted for less time than in 2008-09 (by three months) and represented only c.40% of the monetary stimulus implemented then (see Figure 2): this is slightly more than the one third we had anticipated in mid-2020 (see here for more details), but still relatively low.

Figure 1 – Proprietary monetary impulse indices

Figure 1 – Proprietary monetary impulse indices
Sources: National sources, Euler Hermes, Allianz Research

Both domestic and external conditions are ripe for Chinese authorities to tighten the policy mix: we estimate that the US super stimulus could boost China’s exports over 2021-22 by USD60bn (0.2% of GDP, see here for more details). At the same time, China’s own economic recovery is sufficiently strong (GDP growth at +2.3% in 2020, +8.2% expected in 2021), despite disparities. While retail sales contracted in 2020, labor market and household income indices suggest that the recovery of private consumption is likely to extend well into 2021.

The normalization of monetary policy is likely to happen at a faster pace than the fiscal policy. Indeed, we estimate that after 7.1% of GDP in 2020, fiscal support will decline to 4.6% of GDP in 2021, with less infrastructure investment. But this remains relatively generous compared to the past (2.9% on average in 2018-2019).

Figure 2 – Comparison of monetary easing episodes in China, based on our proprietary credit impulse index

 Figure 2 – Comparison of monetary easing episodes in China, based on our proprietary credit impulse index
Sources: National Bureau of Statistics of China, PBOC, Euler Hermes, Allianz Research

China’s policy tightening will aim at tackling financial vulnerabilities and asset price bubbles rather than consumer inflation. Indeed, China’s CPI grew by +2.5% y/y in 2020, compared to an official (non-binding) target of “around 3.5%”. Consumer inflation even turned slightly negative in the first months of 2021 – although this situation is unlikely to last for long (we expect +1.9% over 2021) and China’s producer prices are probably more relevant for policymakers and the rest of the world. The aim of China’s policy tightening is more about financial vulnerabilities and addressing the risk of overheating in the real estate and financial markets. China’s debt-to-GDP ratio rose to 285% at the end of Q3 2020, compared to 251% on average over 2016-2019. The real estate sector has been one of the main drivers of China’s post-Covid-19 economic recovery. Housing prices are still growing at a moderate pace compared to the past, but could accelerate as measures of inventories are declining quickly (see Figure 3). Regarding the equity market, the CSI 300 total return grew by +18% in 2020 compared to +3.4% on average over 2016-2019, and the balance of margin long positions rose by +RMB262bn compared to an average yearly change of –RMB67bn over 2016-2019. This reveals some increase in short-term risk appetite and speculative behaviors.

Figure 3 – Real estate sector: prices and inventories (right-hand scale inverted)

Figure 3 – Real estate sector: prices and inventories
Sources: China Index Academy, National Bureau of Statistics of China, Euler Hermes, Allianz Research

In practice, we do not expect policy rate hikes in 2021 anymore as tightening is likely to be carried out in a flexible manner. The sharp rise in corporate bond spreads in late 2020 (see Figure 4), the renewed Covid-19 outbreaks in early 2021 and most recently the sell-off in the equity market mean that China’s policymakers will likely avoid high-profile actions that could signal a policy cliff and jeopardize the economic recovery. Instead, we think the PBOC will adopt a data-dependent and flexible approach, using its liquidity facilities to guide a gradual tightening of financial conditions.

As the focus comes back to financial stability, macroprudential rules and regulations will also be part of policymakers’ toolbox. New rules that came into effect at the beginning of 2021 put in place a system that caps banks’ exposure to mortgages and property loans. As they have done in the past, and depending on the local real estate market, authorities could consider making rules and requirements for housing purchases more stringent.

A regulatory storm has also hit online lending since last autumn. In particular, companies also favored micro-lending over the past few years after a government crackdown against peer-to-peer lending in 2016. Regulators are now paying attention to this space, with new rules capping online microloan companies’ exposure to single borrowers, putting a minimum threshold for their share of funding in loans jointly sourced with banks, sharing with regulators data on borrowers’ creditworthiness etc.

Figure 4 – Interbank rate and industrial bond credit spread

 Figure 4 – Interbank rate and industrial bond credit spread
Sources: Wind, Euler Hermes, Allianz Research  

What does this mean for companies and financial markets? The divergence of China’s policy stance from the rest of the world means that there could be room for further appreciation for the renminbi, although most of it may already be past. We expect the USDCNY onshore rate towards 6.3 at the end of 2021 (vs. latest 6.5, 6.5 at end-2020 and 7.0 at end-2019). Our baseline scenario of a gradual and successful policy normalization means that credit growth (through banks and capital markets) will continue slowing in 2021. Particular attention should be given to the impact on the comparatively more fragile sectors and provinces as we find a positive correlation between a province’s public debt-to-GDP ratio and its corporate bond default ratio (see Figure 5).

Figure 5 – Provincial public debt-to-GDP ratio (%, 2019) vs. corporate bond default ratio in province (%, latest)

Figure 5 – Provincial public debt-to-GDP ratio (%, 2019) vs. corporate bond default ratio in province (%, latest)
Sources: Wind, Euler Hermes, Allianz Research