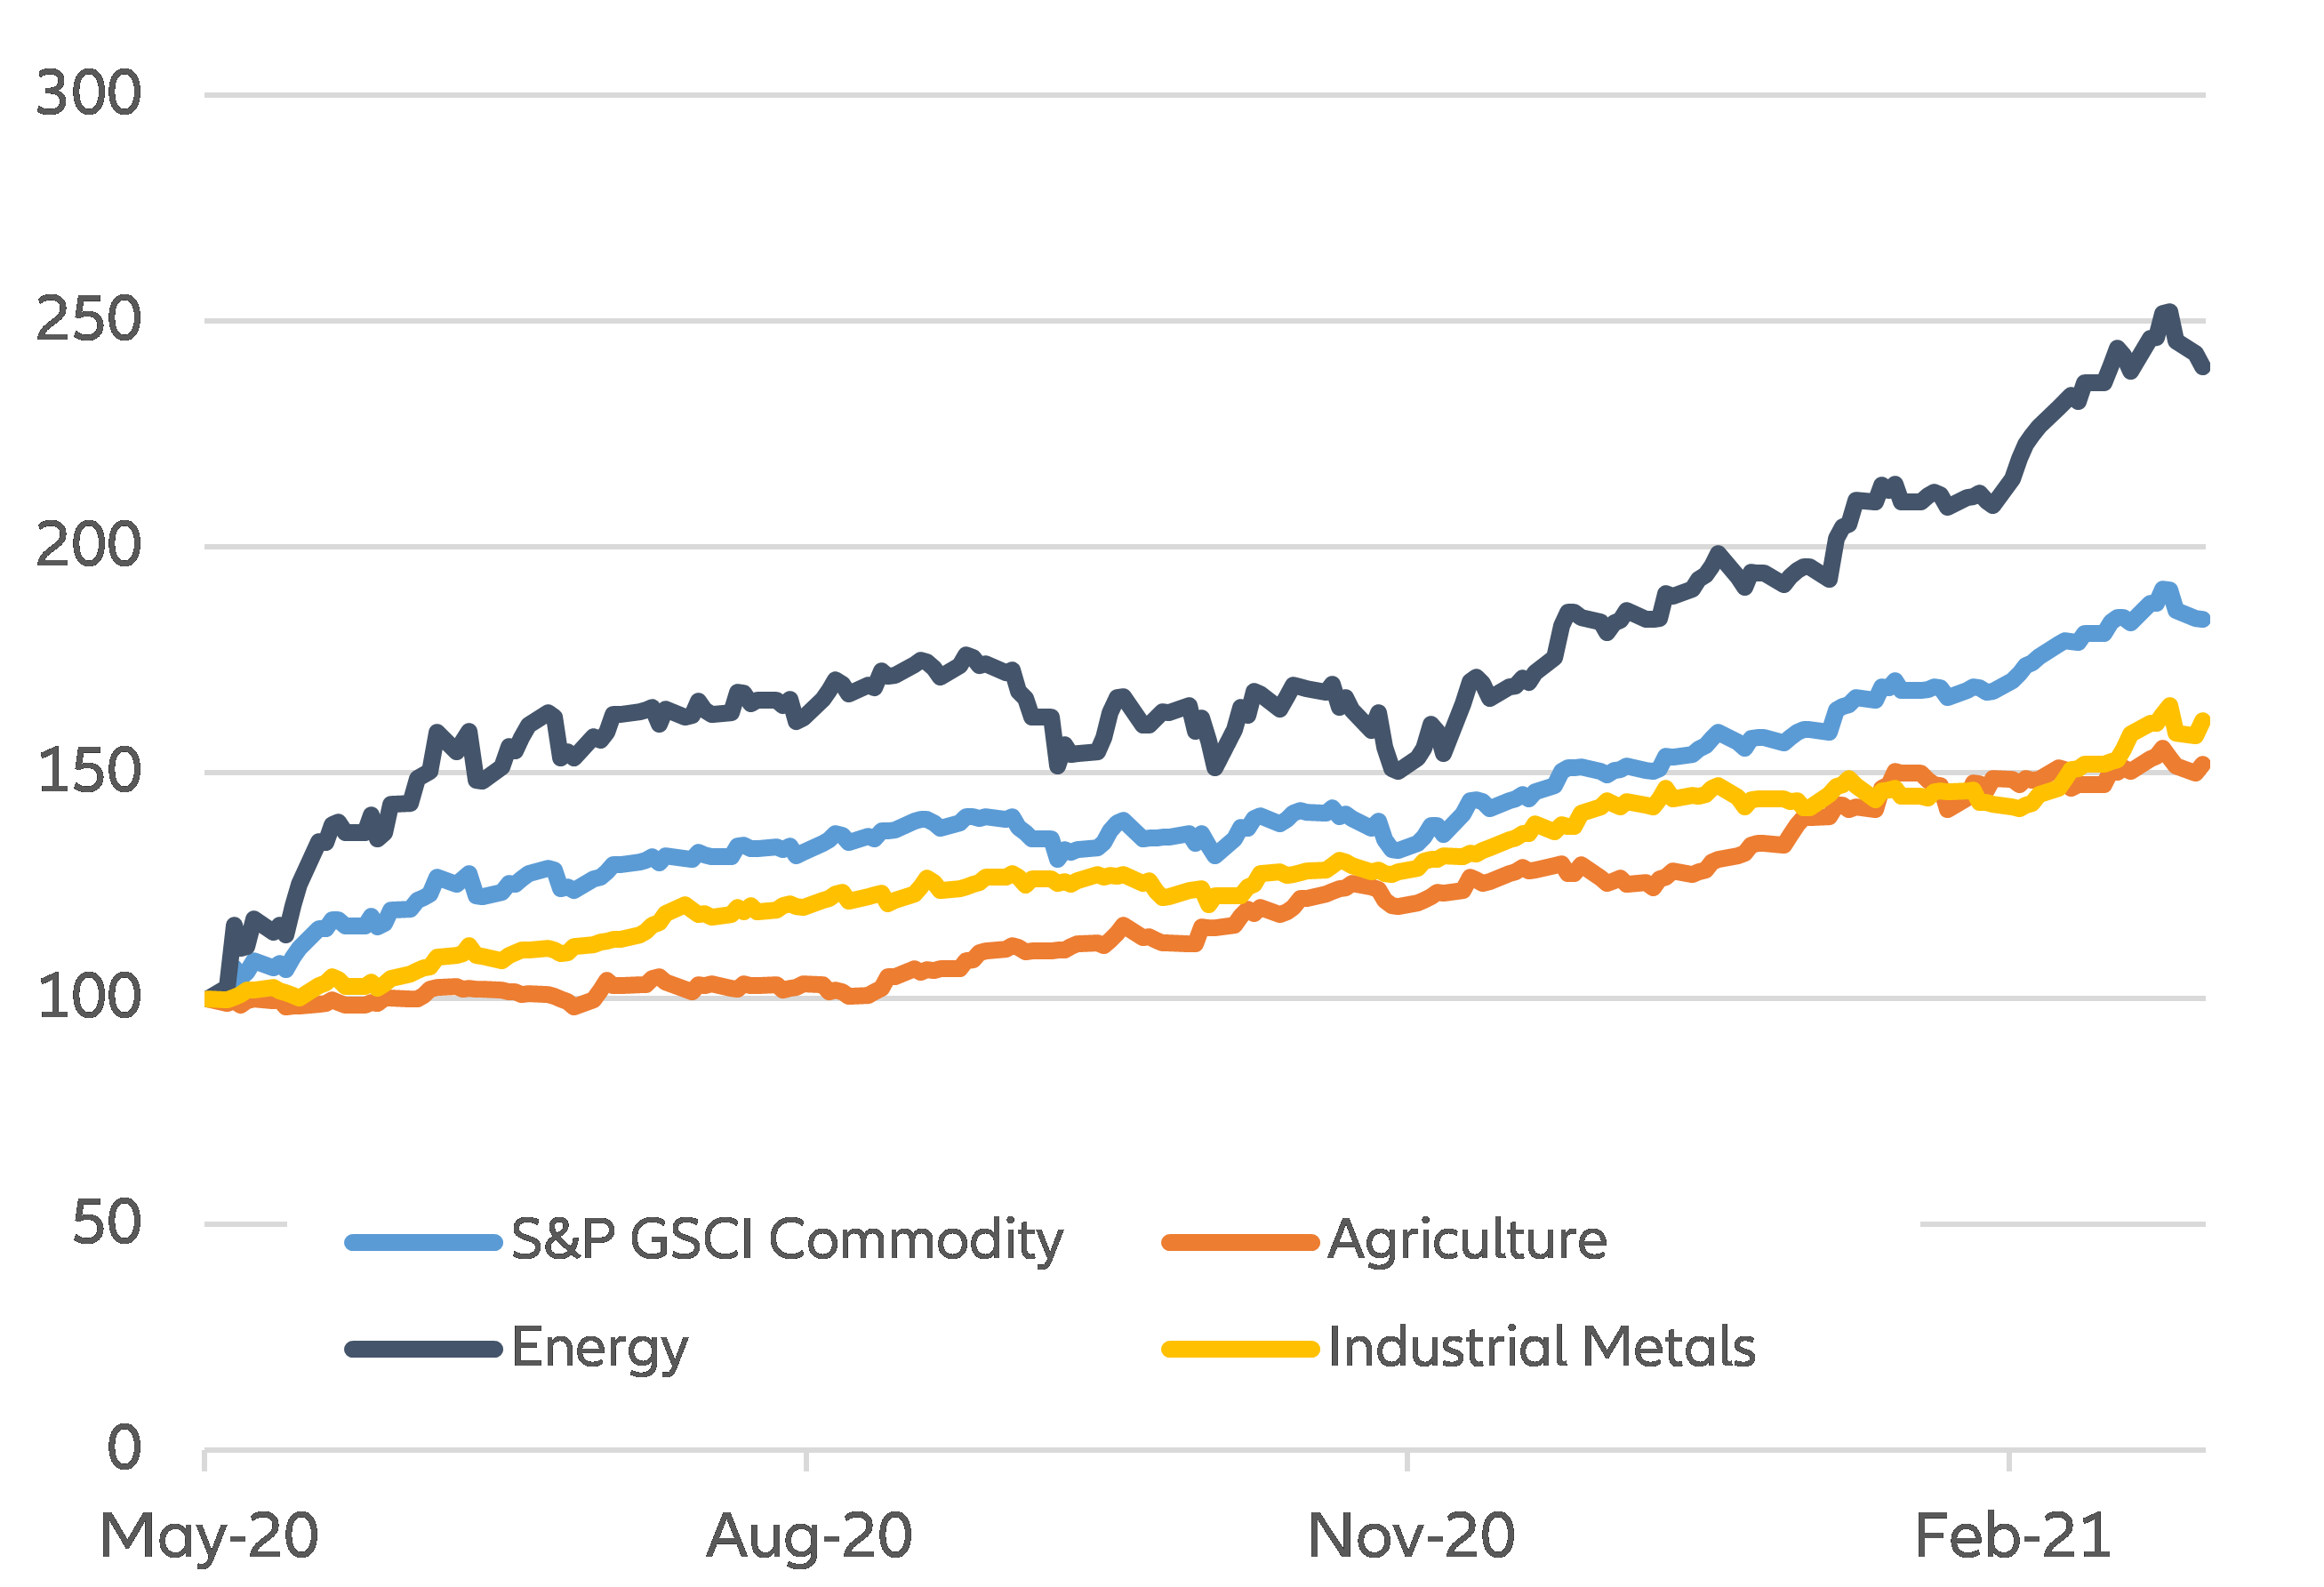
With oil leading the recent surge, some commodities are at multi-year record highs, in line with anticipated pent-up demand. Since the lows of May 2020, corn, soybeans and copper are at seven to eight-year highs, while cotton is trading at a three-year high (see Figure 1). However, energy prices, which are largely driven by oil, have experienced the biggest rise. The bulk of the increase can be explained by the expected acceleration of GDP growth for 2021, after lockdown economics paused the world, on and off, for an entire year. We forecast China to grow by +8.2%, the US by +5.3%, the Eurozone by +4.3% and Emerging Markets by +6% in 2021.
Figure 1 – Commodity price indices (May 2020= 100)
Sources: Refinitiv, Allianz Research
Yet, as we reconnect the world, and handle post-Covid-19 fears, supply and inventory constraints are temporarily pushing commodity prices higher. Whereas inventories have been decreasing for industrial metals in LME warehouses, we notice a pick-up in inventories for some metals, especially copper and aluminum, in Chinese SHFE warehouses. Furthermore, metals stockpiling implemented by the State Reserve Bureau (SRB) has historically been a policy support measure in China. During the financial crisis between December 2008 and January 2009, for instance, the SRB bought 590,000 tons of aluminum and 159,000 tons of zinc. Although figures are unknown, we can certainly assert that the SRB supported its metals industries by stockpiling in 2020.
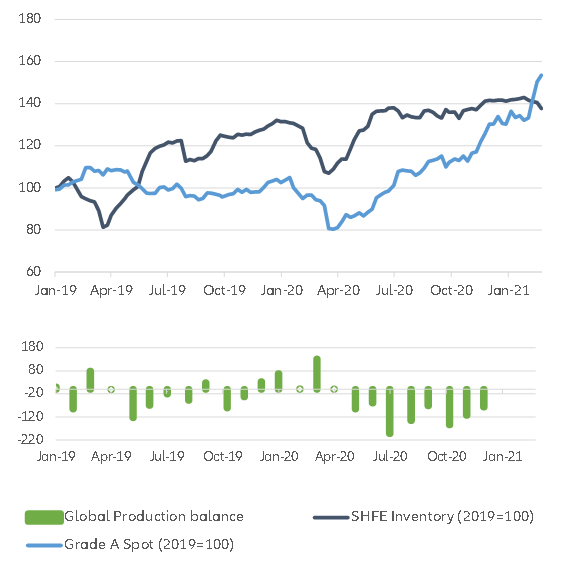
Copper is a particularly striking example: Chinese warehouses were restocking and maintaining high levels of inventories while the global production balance (production minus use/sales) was in deep negative territory (see Figure 2).
Figure 2 – Copper spot price, Shanghai Exchange inventories and global production balance
Sources: Refinitiv, Allianz Research
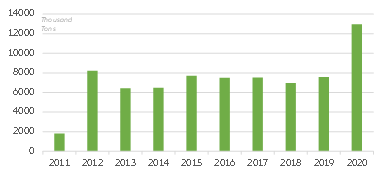
On top of using stockpiling as policy support for its industry, China also stockpiled food commodities for strategic reasons. Although we do not have data on SRB purchases, Chinese imports of grains & cereals (i.e. rice, wheat and corn) have surged by +71% in 2020 compared to 2019 (see Figure 3). Interestingly, in a context of tensions with Washington, China did not ramp up its food imports from the US. Imports of soybeans, the most imported food commodity from the US, have not recovered to pre-pandemic levels yet.
Figure 3 – China’s imports of grains and cereals
Sources: China Customs, Allianz Research
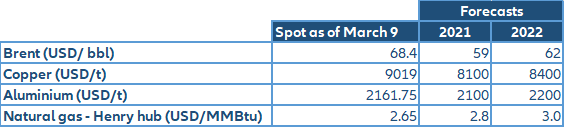
Commodity supply has been harshly hit by Covid-19: mines had to close, extraction in shale oil fields had to be interrupted and crops were lost due to a lack of available workers. Nevertheless, as the sanitary situation ameliorates, both demand and supply will normalize. In particular, we expect less action from China on commodity markets as policy support will decrease and strategic reserves are high. We also expect some dollar appreciation in Q2 2021. However, as supply is likely to remain somehow constrained, we see prices retreating slightly and consolidating at relatively higher levels for most commodities (see Table 1).
First, in the oil segment, the OPEC+ group is likely to increase prudently its output approach; the US shale sector remains focused on financial restructuring. In the food space, weather effects such as La Niña combined with export restrictions from some exporting countries (i.e. Russia, Ukraine) are likely to put a cap on the available output on global markets. Concerning metals, miners are happy to stay behind the curve: current prices allow them to reconstitute cash buffers.
Table 1 – Forecasts for selected commodities
Sources: Refinitiv, Allianz Research
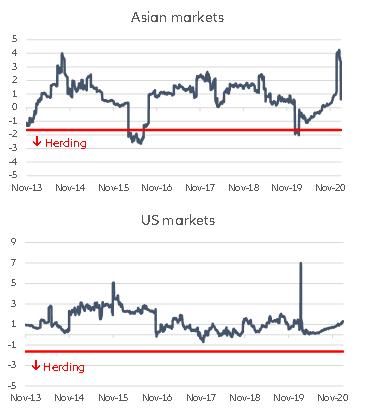
Beyond demand and supply issues, we do not see any sign of market participants propping up the whole commodity space. Expanding on previous academic research , we build a time-varying herding indicator for Asian and US commodity markets. Although we did see investor herding in Asian markets (i.e broad purchases or sales without any distinction regarding the type of commodities) in 2015-2016, and during a brief period in late 2019, as of today we see no evidence of such behavior in either commodity markets.
Figure 4 – Herding indicator for Asian and US commodity markets
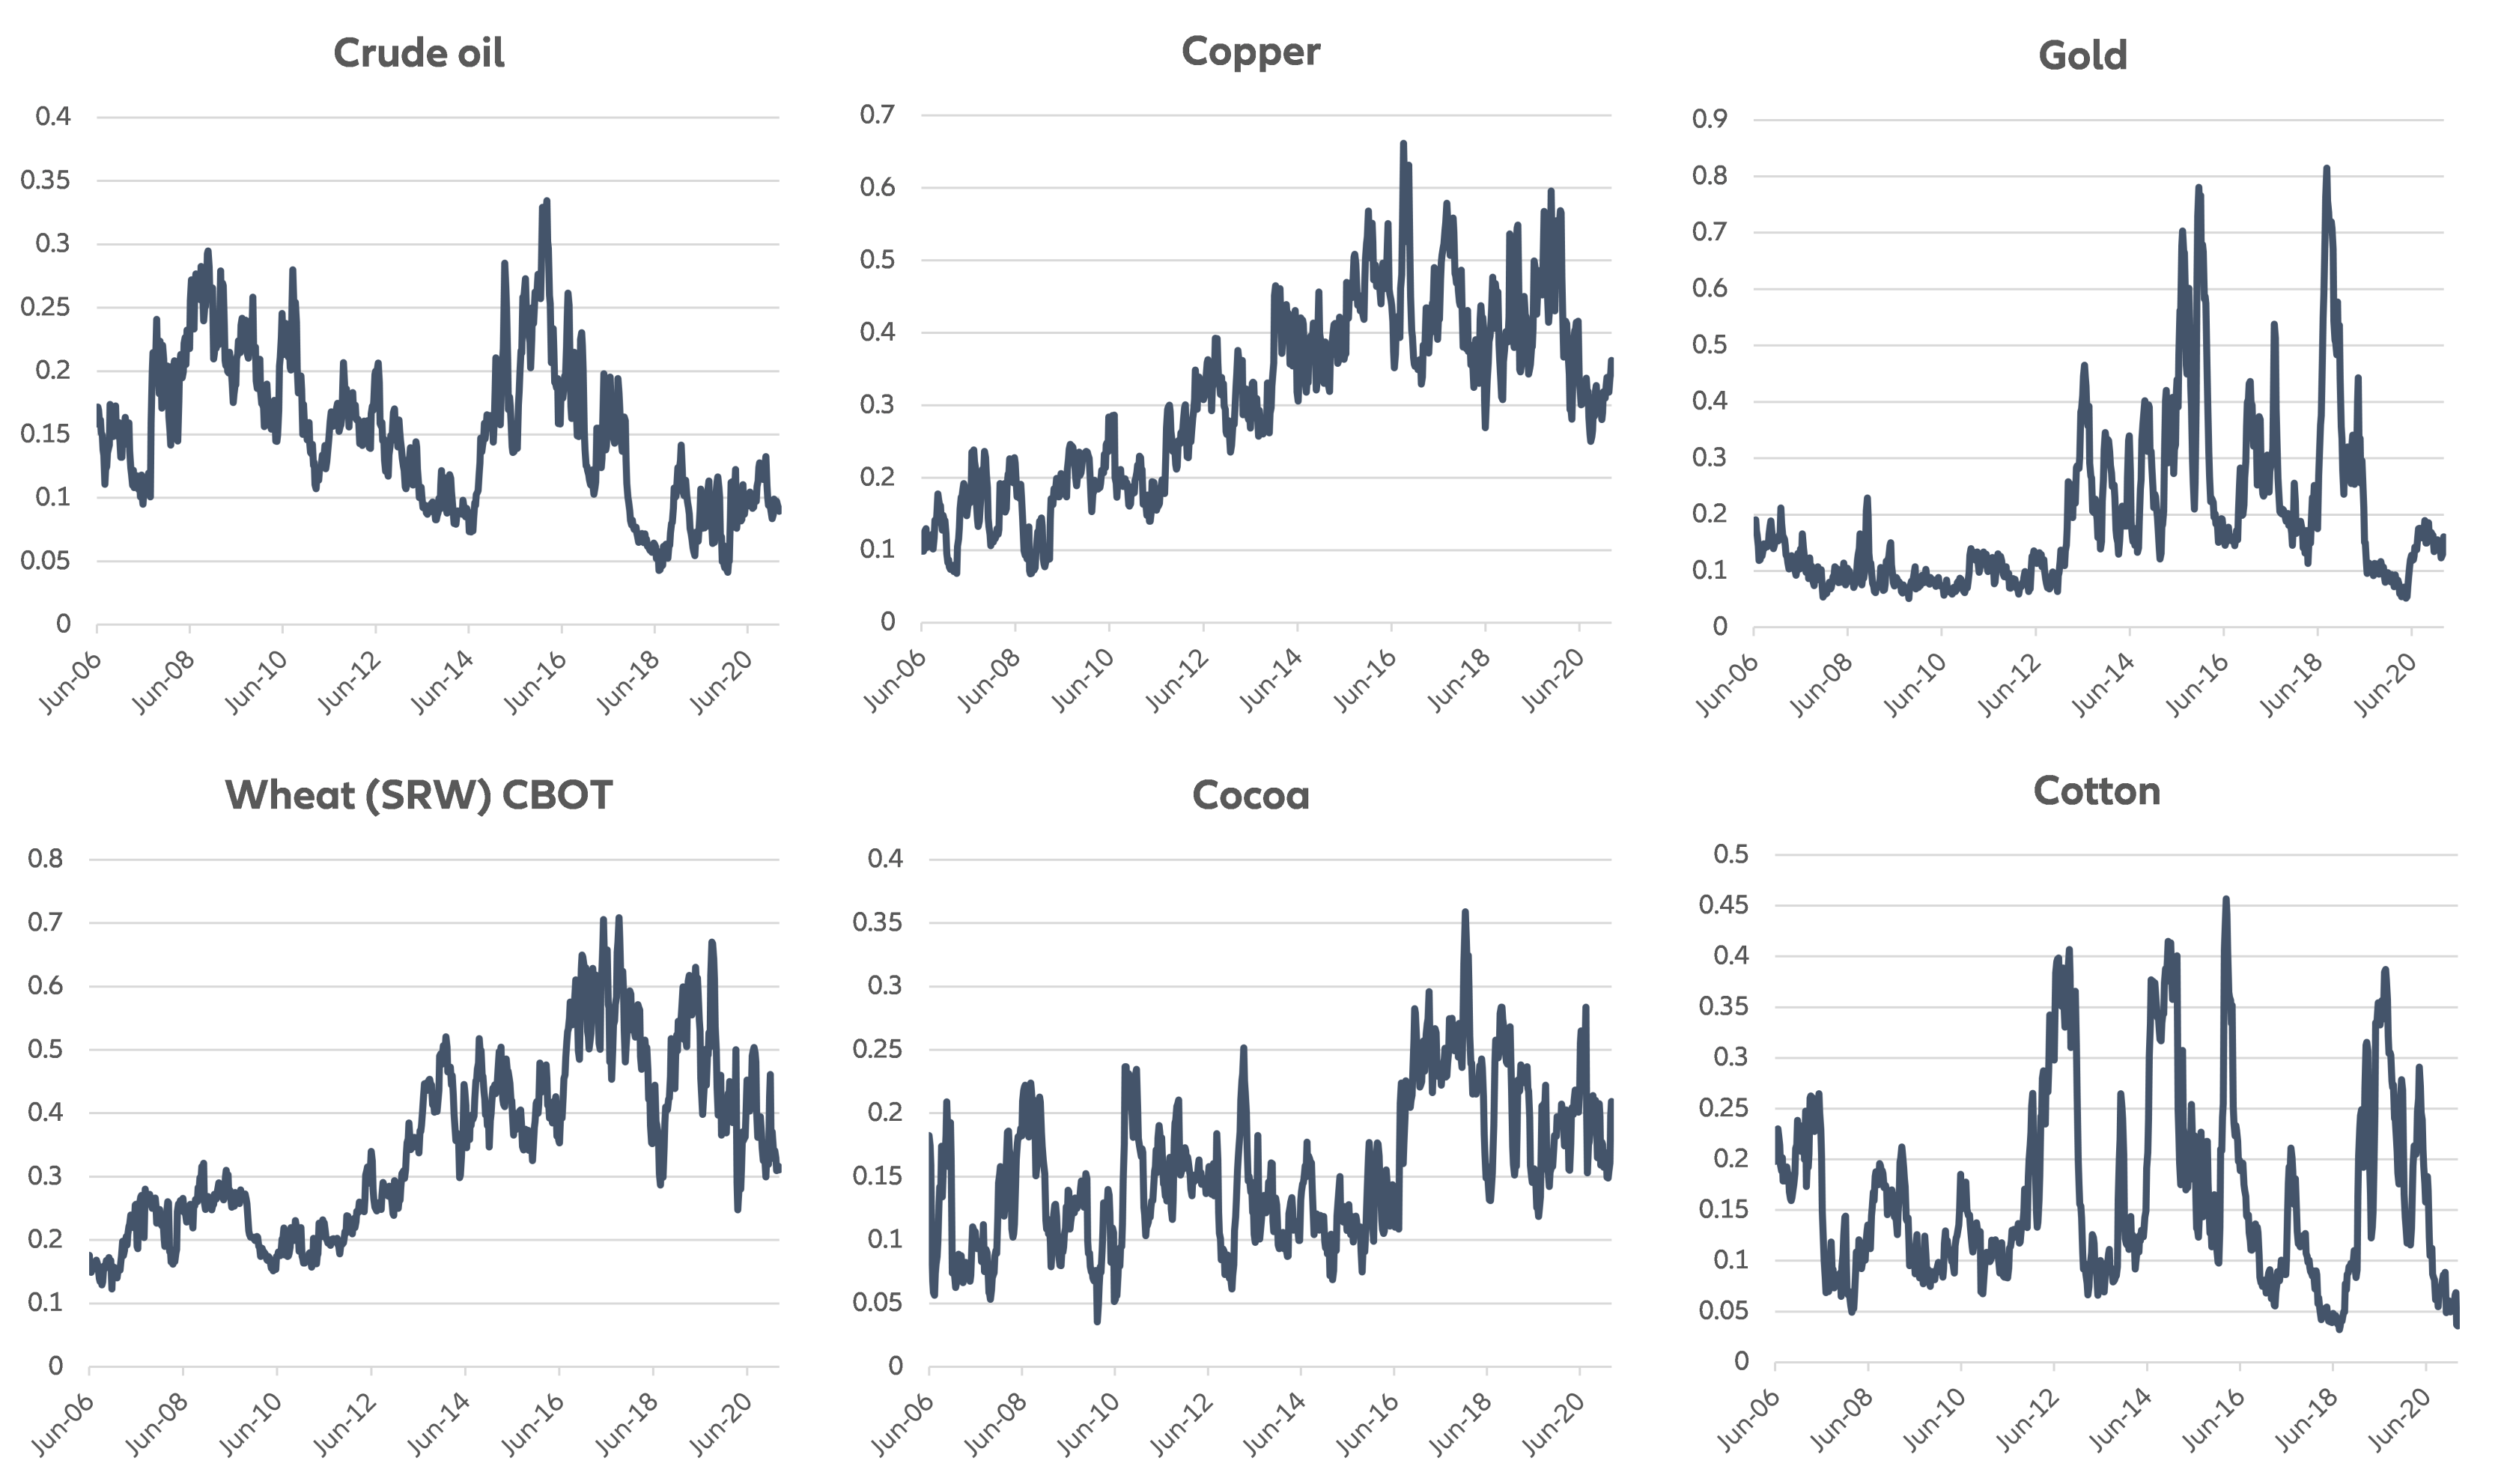
We see no evidence of financial speculation on individual commodities neither. Using CFTC data, we compute the Working’s Speculative index based on the relative market positioning of financial agents vs corporates. We find that it is lower than in previous bull cycles for all commodities (see Figure 5). The index was much higher for most commodities during the 2016-2017 cycle.
Figure 5 – Speculative index for selected commodities
Sources: CFTC, Allianz Research
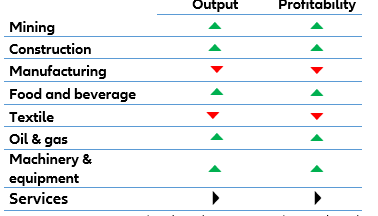
All in all, these inflationary pressures put some sectors at risk in the short run. With commodity prices rising, input prices are also under pressure. The latest survey data coming from the US and Europe are suggesting higher input prices. As some corporates are already working on thin margins and others are trying to make up for last year’s bad results, they might increase selling prices. Such a snowball effect could lead to inflationary pressures in the wider economy. From the perspective of firms, the vulnerability to a commodity price swing is not the same across sectors. Low pricing-power industries are likely to lower output and suffer from lower profitability (see Table 2).
Table 2 – Forecasts for selected industries
Sources: Lee and Ni (2002), Jiménez-Rodríguez (2008), Guidi (2010), Rayner and Bishop (2013) and Allianz Research

Senior Expert Demographics