Covid-19 to increase firms’ liquidity needs to a record USD8tn as payment delays and inventories surge

27 July 2020

Executive summary

  • Covid-19 entails longer payment delays and rising inventories among large corporates. Global firms’ liquidity needs, as measured by Working Capital Requirements (WCR) will increase by +5 days to 74 days in 2020 or USD8tn (+USD140bn). These liquidity needs are unfortunately not on the radar of policymakers, yet they represent the equivalent of close to 10% of global money supply. As a result, suppliers will continue to play the invisible bank to their clients, use more short-term credit lines from banks and look for additional funds from shareholders.
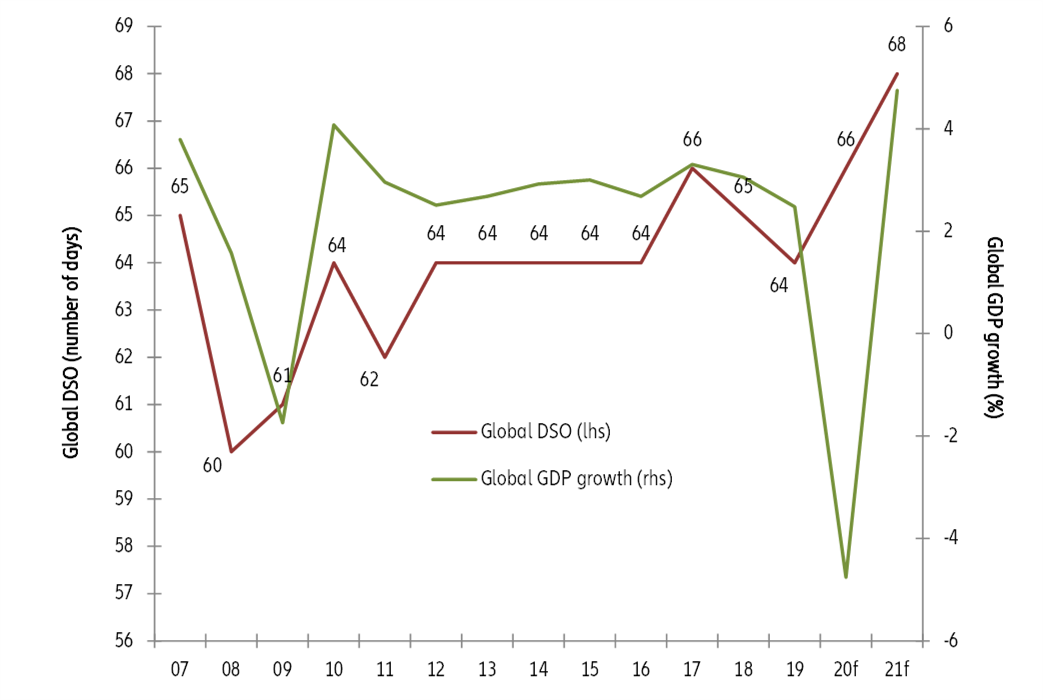
  • Payment delays, as measured by Days Sales Outstanding (DSO), will increase by +2 days to 66 days in 2020, and by another 2 days to 68 in 2021, it is the highest level over the last decade. After two consecutive years of decreases, DSO will increase twice as much as during the financial crisis on the back of the Covid-19 cash crisis. As output shrinks and uncertainty rises, companies will use longer payment terms as a commercial strategy to restore market shares.
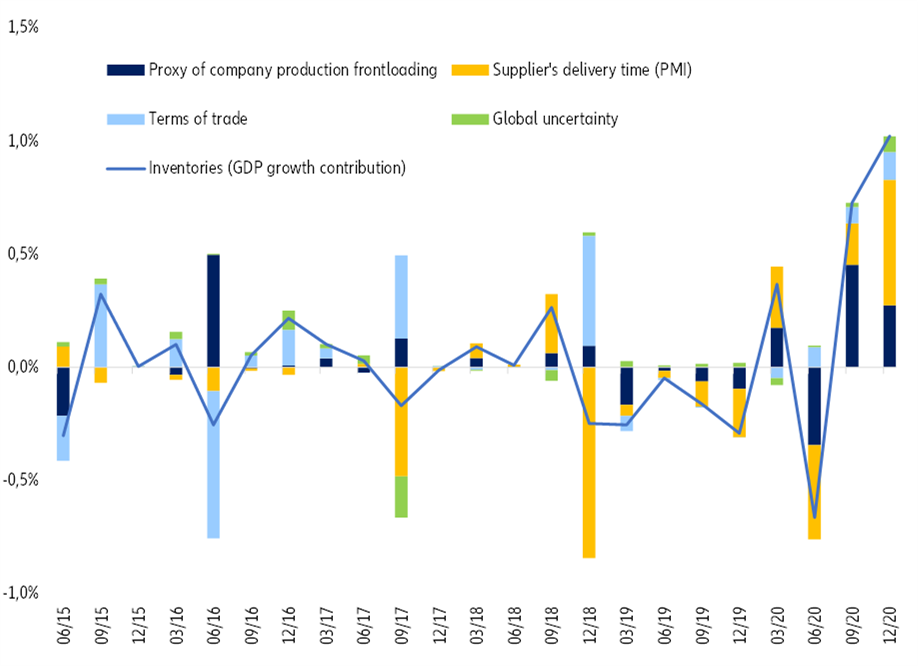
  • Global stocks, as measured by Days Inventory Outstanding (DIOs), will increase by +3 days in 2020. The prolonged supply-chain disruption likely due to future targeted lockdowns and the precautionary stockpiling of companies will push inventories up in H2 2020. In the Eurozone, we expect inventories to contribute +1.7pp to real GDP growth after -0.3pp in H1.
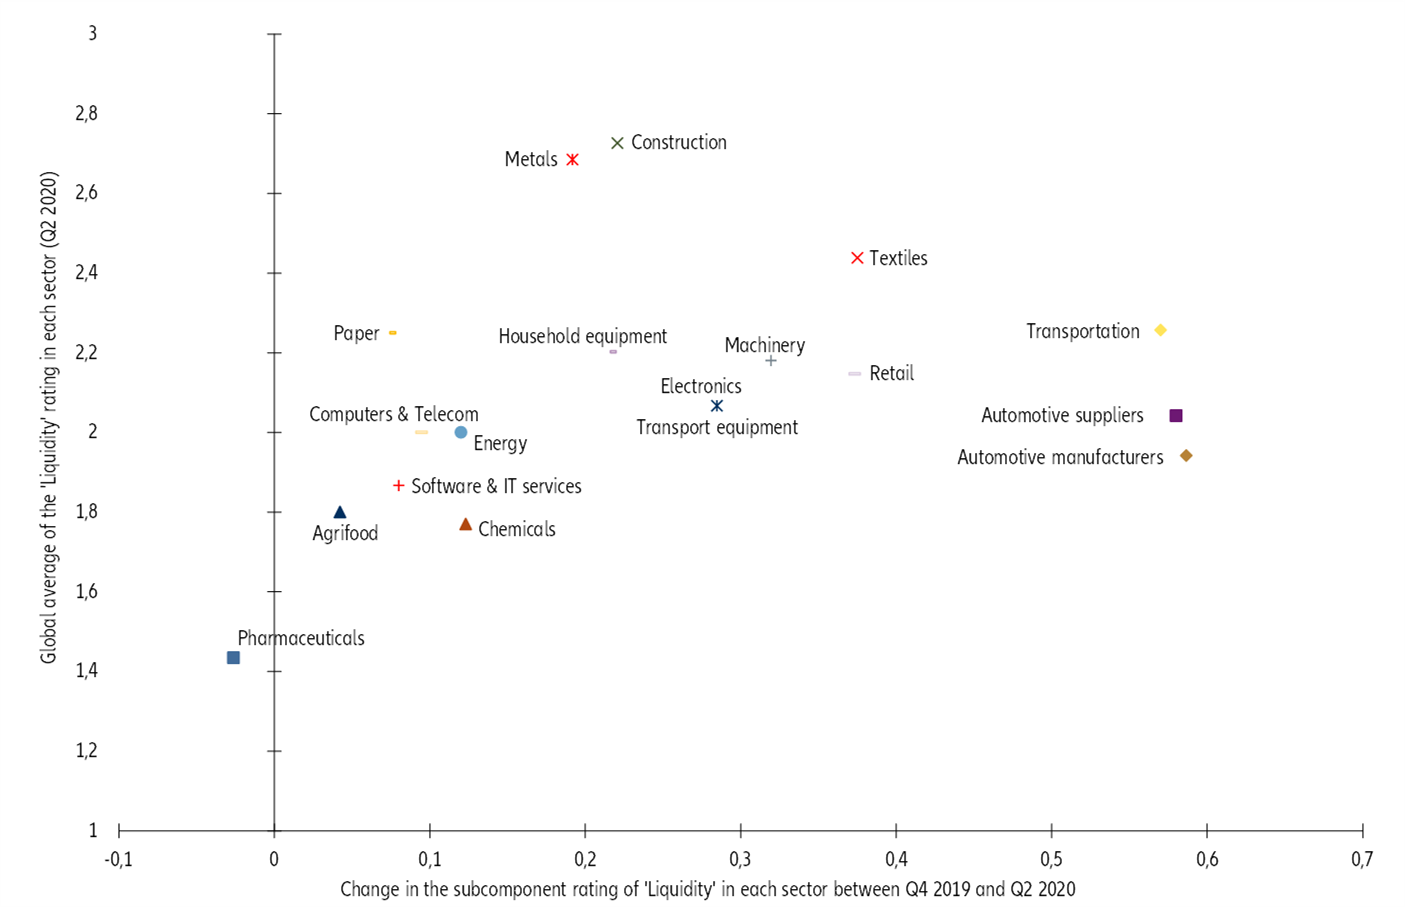
  • Transportation, automotive, textiles and (non-food) retail should be most liquidity-stressed. They will register the highest increases in WCR in 2020 (above +5 days) and deteriorating profitability, possibly entering distress territory, should they lack support from banks and investors in the coming months. Metals and construction also appear to be very fragile considering their current liquidity positions. In contrast, pharmaceuticals and agrifood are in the best positions.

Record level in global WCR in 2020 pushes company financing needs to USD8tn

We expect global WCR to bounce back to 74 days (+5 days) in 2020, with almost two thirds of this rise explained by an increase in inventories as companies will look for an edge to avoid any supply-chain disruptions from expected targeted lockdowns in the coming months.  This comes after a -1 day decrease in global WCR in 2019, less than expected due to unchanged suppliers’ payment terms and a very modest correction in inventories (-1 day). In 2020, we expect rising WCR to account for USD8tn of total financing needs worldwide , amounting to nearly 10% of the global money supply (M2). Against this rise, companies are likely to balance between (i) extending suppliers’ payment terms, (ii) using more short-term credit lines with credit institutions and (iii) asking for additional funds from shareholders.

In 2019 already, rising inventories had increased WCR in six countries: Denmark saw its DIO soar by +10 days, Spain by +8 days, Bulgaria by +6 days, Russia by +4 days and Turkey by +2 days.

Since the outbreak of Covid-19, policymakers have taken swift and unprecedented action to encourage banks to keep providing an emergency liquidity lifeline to the private sector, despite the risk of rising non-performing loans . So unless public loan guarantee schemes are extended, banks might become more reluctant to lend in 2021, putting at risk companies’ needs for financing their additional WCR, along with the ongoing recovery.

In terms of sectors, transportation, automotive, textiles and (non-food) retail should register the highest increases in WCR in 2020 and could be most at risk of a liquidity crisis. Metals and construction also appear to be very fragile considering their current liquidity positions, i.e. the expected cash balance of companies in the medium run.

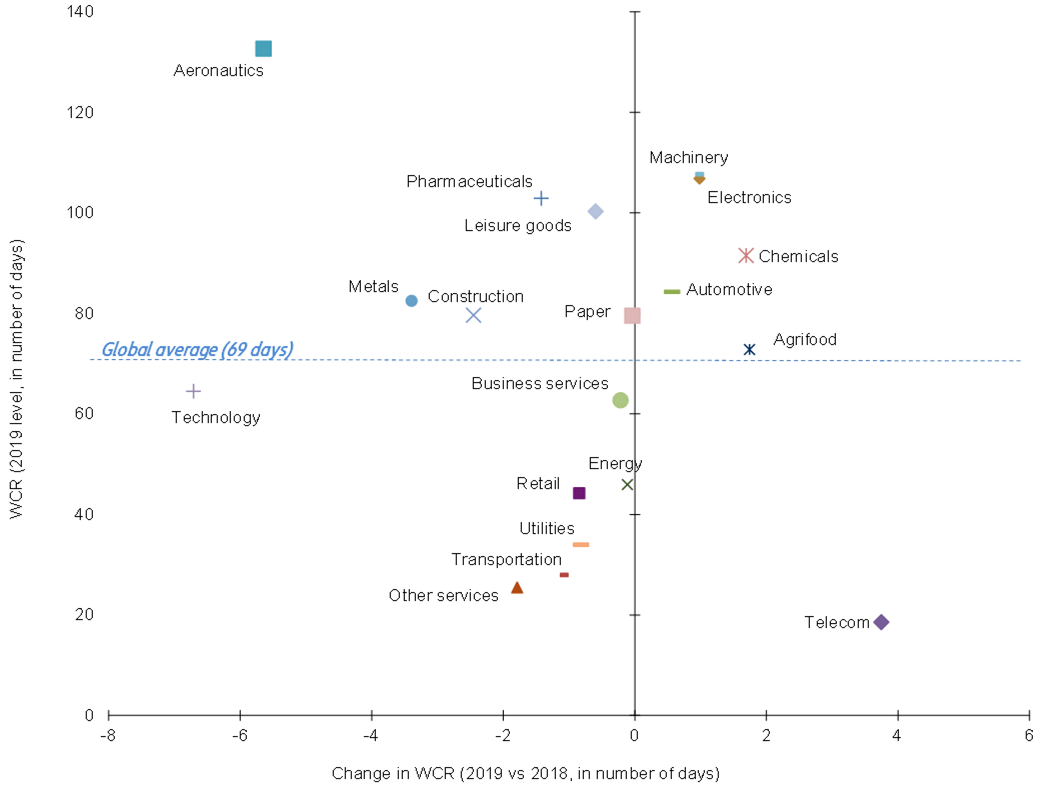
In 2019, telecom, agrifood and chemicals saw the highest rises in WCR in by +4 days and +2 days for the two latter, respectively (see Figure 1 below). Chemicals also suffered from high levels of WCR, above the global average of 69 days, while the other two sectors enjoyed lower WCR, giving them some leeway to cope with this rise. Meanwhile, aerospace suffered from extremely high WCR (above 130 days) and will suffer further from the strong fallout of the airlines crisis due to the travel bans in H2 2020.      

Figure 1 – Working capital requirements (WCR), level and change 2019/18

Figure 1 – Working capital requirements (WCR), level and change 2019/18
Sources: Bloomberg, Euler Hermes, Allianz Research

Global DSO to reach its highest level in a decade

It will be difficult to keep payment delays in check, given the ongoing resumption in activity post lockdowns. We expect a rise in global DSO by +2 days to 66 in 2020, its highest level over the last decade. This compares with a pre-crisis expectation of -2 days to 62 in 2020. Accounts receivables would reach USD7.2tn for listed companies, or USD18tn for all companies globally . In the 2009 financial crisis, DSO increased by +1 day to 61.The rise in 2020 comes after a drop of -1 day in 2019, in line with our expectations, as the global economic slowdown and record high trade uncertainty reactivated the need for payment discipline.

During H1 2020, companies tried to keep payment delays in check in order to protect against a cash-flow crisis after the Covid-19 shock. However, as lockdowns have largely been lifted, the ongoing resumption in activity is likely to bring about a détente in this strategy, as companies will use a relaxation in payment terms as a commercial strategy to restore market shares. This will compound already high DSO levels for several sectors still in disarray, such as (air) transport, which will stretch their cash positions. Already back in 2019, machinery, electronics and construction suffered the most from the longest DSO  with 84 days, 83 days and 82 days, respectively, well above the global average of 64 days. Chemicals, aerospace, automotive, technology and pharmaceuticals also faced above average DSO (see Figure 2). In 2021, we expect DSO to continue to rise by +2 days to 68 (see Figure 3), in line with the less supportive state-guaranteed loan schemes, which will weigh on companies’ cash-flow positions.

Figure 2 - DSO level and dispersion by sector in 2019

Figure 2 - DSO level and dispersion by sector in 2019
Sources: Bloomberg, Euler Hermes, Allianz Research
Figure 3 - Change in global DSO and GDP growth
Sources: Global Insight, Euler Hermes estimations

Companies are likely to build precautionary stocks to fight future targeted lockdowns and supply-chain disruption

The prolonged supply-chain disruption likely due to future targeted lockdowns and companies’ precautionary stockpiling will push inventories up in H2 2020: DIOs are expected to rise by +3 days in 2020, after +1 day in 2019. In the Eurozone, we expect inventories to contribute +1.7pp to real GDP growth, after -0.3pp in H1. During the lockdowns, the ratios of inventories to new orders spiked, signaling much higher stockpiling than in 2009 in most countries (see Figure 4). This was mainly driven by the pause in production, coupled with the demand shock. While in some cases this will be an edge for the recovery as sales and production resume, inventories remain above normal levels which indicates a slow recovery in domestic and external demand. In addition, supply chains are likely to remain impaired in H2 as long as social distancing and restrictions on international flows are maintained. We expect inventory levels to keep on rising as companies would rather avoid any supply-chain disruptions due to future targeted lockdowns.

In the Eurozone, we compute the evolution of inventories taking into account four variables: (i) the level of global uncertainty, (ii) terms of trade, (iii) a proxy of excess supply calculated as the spread between y/y growth of manufacturing production and retail sales and (iv) suppliers’ delivery times, which assess the disruption of supply chains for manufacturing goods. Hence, our model suggests a spike in inventories in H2 2020: +1.7pp contribution to real GDP growth in H2 2020 after -0.3pp in H1 (see Figure 5 for results and explanations of the explicative variables).

Figure 4 - Ratio of inventories/new orders (manufacturing PMI survey)

Figure 4 - Ratio of inventories/new orders (manufacturing PMI survey)
 Sources: IHS Markit, Euler Hermes, Allianz Research
Figure 5 – Eurozone inventories (contribution to real GDP growth)

Sources: Eurostat, EPU, AGI, Allianz Research


Box on the model on Eurozone inventories

  • Proxy of excess supply: spread between y/y growth of industrial production and retail sales. The higher the spread, the higher the excess supply.
  • Suppliers’ delivery times: the manufacturing PMI component indicating the time needed for being delivered. The lower it is, the higher the supply-chain disruption.
  • Terms of trade: the ratio between export and import deflators (y/y growth). An increase means terms of trade are favorable (export prices increase faster than import prices), which pushes companies to produce more, therefore increasing the level of stocks.
  • World uncertainty: the higher the uncertainty, the higher the inventory levels.

Transportation, automotive, textiles and (non-food) retail should be most liquidity-stressed

Figure 6 offers a view by sector of the state of liquidity (y-axis) and of the change in liquidity situations (x-axis) since the beginning of the year, i.e. including global lockdowns to fight against the Covid-19 outbreak, as assessed by Euler Hermes risk teams . Our liquidity rating assesses the level of cash-flow for more than 18 sectors. The liquidity rating of each sector varies between the 1 (low risk) and 4 (high risk). We look here at the global average of the liquidity rating. In a nutshell, the more a sector is on the right side of the chart, the more it is likely to face liquidity stress in the second half of the year. It is all the more the case that most sectors have already seen liquidity shortfalls in the first half of the year due to the sharp fall in activity because of lockdowns.

In line with past years, transportation, automotive, textiles and (non-food) retail appear to be the most endangered sectors in terms of the further financing of their lengthening DSOs and inventories (see Figure 6). This could turn into a liquidity crisis in the coming months, should they lack support from banks or financial investors.

The travel bans have been a wake-up call for the transportation and automotive sectors as companies could not operate at all during a two-month period. Like automotive, the air sector – included in transportation - is the perfect example to have in mind for understanding how lockdowns have wreaked havoc on the sector’s cash balance. Should their activity shortly rebound, airlines are very likely to run into strong difficulties to get some further credit lines from banks as it is well known that the first half of the year was terrible from a profitability point of view. Retail and textiles are the two other sectors jeopardized by the looming rise in DSO and inventories to cash in on the economic turnaround during the second part of the year. It is, however, more a case of a structural crisis in their business models, which the lockdowns compounded.

And even if metals and construction are not at the top right of the chart, they also appear to be very fragile considering their liquidity rating in the highest part of the chart – i.e. they are suffer from an already “sensitive” position in terms of liquidity. On the opposite side, pharmaceuticals and agrifood have been able to avoid liquidity constraints during the sanitary crisis.           

Figure 6 - Liquidity rating and change in liquidity by sector since Q1 2020

Figure 6 - Liquidity rating and change in liquidity by sector since Q1 2020

Sources: Euler Hermes, Allianz Research


Ana Boata
Head of Macroeconomic research
Maxime Lemerle
Head of Sector and Insolvency Research
Marc Livinec
Sector Advisor
Anita Poulou
Research Assistant