The devil is in the details: The EU carbon border adjustment mechanism (CBAM) will not only become more expensive than anticipated but will likely fail to restore a level playing field for industries heavily exposed to carbon pricing, first because it is an invitation for greenwashing. For setting the “tariff” of the CBAM, a company can use an individual assessment of its emissions instead of the default emission intensities provided by the EU. This is in particular problematic with indirect emission (e.g. electricity): Many foreign companies will find ways to completely attribute their use of green electricity – even if only a small share of their overall consumption of electricity – to the goods exported to the EU. This can easily be done if so called “power purchase agreements” (PPAs) are in place. The result is then merely the reallocation of existing renewable electricity to products imported into the EU, using the remaining brown electricity to produce goods for non-EU markets. Within the EU, producers don’t have the option to use this set-up to evade carbon pricing obligations for products they sell outside of the EU, unless they relocate their production for non-EU customers outside of the EU.
In addition, the focus on keeping the free allocation of certificates in place while trying to secure WTO compliance undermines the possibility for reimbursing the carbon levies of exports, ultimately shifting the competitiveness and carbon leakage issues just one step down in the value chain. Ideally, the EU CBAM would not only need to provide a level playing field for products sold on the EU market, but also for EU-based producers selling their products on non-EU markets. This would be possible with a focus on levying a carbon price only on products locally sold in the EU combined with a much broader product base, which includes important complex downstream products beyond the currently covered basic goods. Such an approach would give domestic producers the right to reclaim the carbon levies when exporting a product. It is well advisable for future revisions and a broadening of the EU CBAM product base to explore the options provided by the possibility of pricing carbon at the product level but determining the related emissions and collecting levies further upstream. This, for example, is the way the “national German emission trading system on fossil combustion for heat and transport” works, collecting the fees at the wholesale level while aiming at downstream emissions.
Much of the concerns regarding the WTO compliance stem from the free allocation of EU emission certificates. Depending on the sector, more or less of the EU emission trading system (EU ETS) certificates are allocated free of charge according to best-in-class benchmarks. This free allocation is supposed to be phased out during a ten-year period following the start of the regular CBAM in 2026. It remains to be seen if the WTO deems the suggested reduction of EU CBAM levies in proportion to the share of free allocations a fair practice. The focus on keeping the free allocation of certificates, however, has two drawbacks: It limits the flexibility of reforming the EU ETS towards a level playing field. And it excludes carbon levy reimbursements for exports as the WTO would regard such a combination as an unfair trade practice. The consequence: the competitiveness and carbon leakage issues is shifted just one step down in the value chain: if higher carbon related costs are passed on, e.g. from steel makers to EU car manufacturers, the car manufacturers in turn might choose to relocate part of their production outside the EU in order to gain access to cheaper steel for their non-EU automobile customers.
In its current form, the EU CBAM also lacks common actions to support the industries included. The European Commission acknowledges the risks of carbon leakage in their assessment. However, the expected loss of employment of just over 1% in CBAM sectors – and only a minimal loss of employment in downstream sectors – might be a little too optimistic. Also, the downstream losses are very unevenly distributed between sectors. Some sectors, such as construction, even gain in the EC assessment. The main losers are other non-ferrous metals with -0.9% output loss, the transport equipment sector with -0.4% (including the car manufacturers mentioned before), crops with -0.3% and chemicals as well as other equipment and consumption goods with around -0.2% in 2030.
A certain way to limit the negative impact could be to ensure that the European “green” versions of basic goods covered by the EU CBAM are cost-competitive “at the source” (i.e. without free allocation of certificates or reimbursements of carbon levies) compared to their foreign brown counter-parts in non-EU markets. Member states such as Germany have announced that they will establish mechanisms that aim at achieving exactly that. The policy instruments of choice for, say, green steel, aren’t limited to investment subsidies for blast furnaces that operate with hydrogen. They could also include so-called “carbon contracts for difference” (CCFD) that subsidize the green steel when it is sold, thus reducing not only the CAPEX of the underlying green investments but also subsidizing their OPEX to a competitive level. While the EU vaguely promotes the use of CCFDs in this respect, a coordinated and adequate EU strategy is still missing.
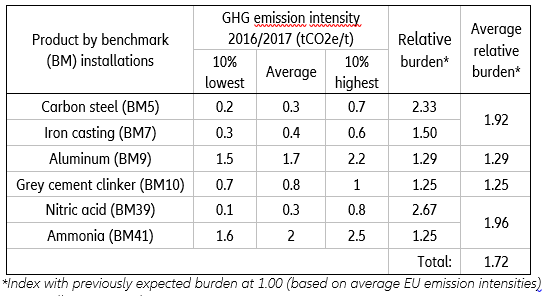
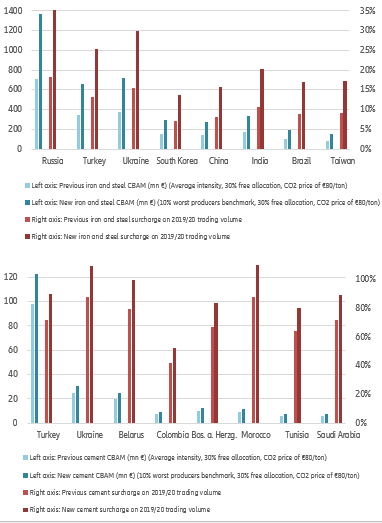
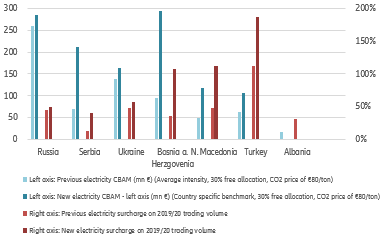
Overall, the EU CBAM could lead to a higher-than-expected burden for importers, especially Russia, Turkey and Ukraine. Previous analyses of the EU CBAM burden were based on the assumption that the product emission intensities are oriented towards average EU emission intensities while in the current version of the EU CBAM, default emission intensities are calculated from actual average emissions intensities of a respective country’s products plus an ominous markup that will be determined in a yet to be specified procedure. Or, alternatively, default emissions are calculated from the worst 10% of similar EU producers. Default values for electricity are calculated with a different approach, but we will come to that later.
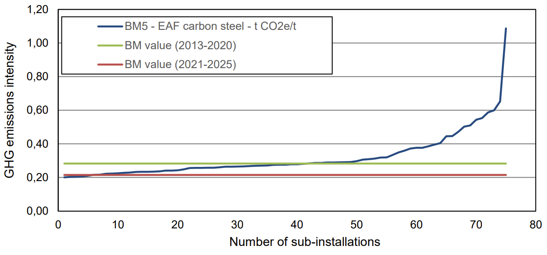
Figure 1 – Exemplary assessment of EU ETS benchmark installations in the carbon steel production