In focus – All eyes on fiscal in the Eurozone

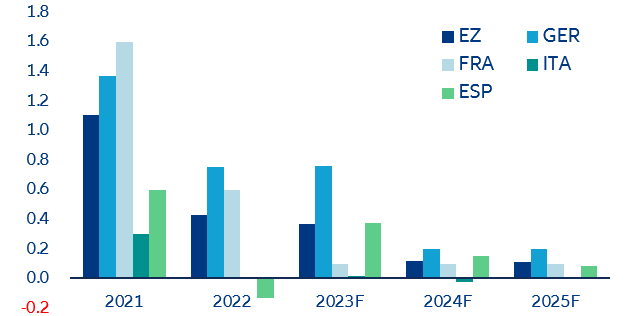
  • A toxic policy mix in 2024? The Eurozone is heading into a challenging 2024 with both fiscal and monetary policy turning restrictive as real rates turn more limiting and governments tighten their belts. As the terminal nominal rate has likely been reached just now, and the real terminal rate will only be reached in 2024 amid ongoing disinflation, monetary policy will have a highly restrictive impact for the foreseeable future. At the same time, after large stimulus packages as a reaction to the Covid-19 pandemic and the war in Ukraine, Eurozone countries are now turning towards fiscal consolidation through stringent budgetary measures. Fiscal stimulus in the Eurozone is expected to drop by -0.8% in 2024, slightly more than the -0.5% drop in 2023.
  • Fiscal consolidation is a long road ahead, and slippage risks should not be underestimated. It’s budget season and a first sneak peek into governments’ pledges show that the big 4 countries in the euro area have charted different pathways:
  •     o   Germany is pursuing fiscal consolidation through a strict budget course in the coming years (deficit seen declining from 2.6% in 2022 to 1.0% in 2025) – but it could be diluted by a shadow budget;
  •     o   Meanwhile, France is kickstarting a modest fiscal consolidation amid a challenging macroeconomic backdrop (deficit to decrease only marginally to 4.6% in 2024);
  •     o   In Italy, tax credit expenses have added clouds to the fiscal outlook (deficit at 5.0% this year, with risks titled to the downside); and
  •     o   Spain has a good consolidation plan (deficit forecast to average 4.0% in 2023-26) but its effectiveness remains to be seen.
  • Eurozone governments and institutions have been working hard on setting ground rules to return to a more sensible application of the EU fiscal framework. Though this is urgent, it will be challenging to come to an agreement as early as next year.

Italy’s construction activity saw a quite impressive rebound in 2021-22 (Figure 1), thanks largely to the generous tax credit scheme for house renovation. Investment in construction increased by +27.7% and +11.5% in real terms in 2021 and 2022, respectively. Given the much more limited increase in new construction (the number of housing starts slightly contracted in 2022 and building permits for new dwellings grew by a negligible +0.1%), we estimate that 40% of this expansion in 2021 and the bulk of it in 2022 was due to the boost from renovations and energy efficiency related to the incentive. The surge in construction investment occurred simultaneously with the escalation of construction costs by +6% in 2021 and almost +12% in 2022, which lifted up further the costs of the tax credits.

The extensive take-up of the scheme generated government expenditure way above its first estimates (EUR35bn). As of August 2023, investment has amounted to around EUR86bn and counts more than 425k interventions since its introduction. Yet, the new Eurostat accounting method for tax credits produced a backward revision of 2021 and 2022 fiscal deficits that touched 9% and 8%, respectively. Together with other incentives currently in place (i.e. bonus façade) totaling around EUR120bn, the untargeted scheme raises concerns over the government’s ability to meet this year’s fiscal targets. Fresh estimates report EUR30-40 bn of additional expenses, just few days ahead of the submission of the 2023 budget update.


Figure 1: Italy – Gross value added of the economy and the construction sector
Sources: Refinitiv Datastream, Allianz Research
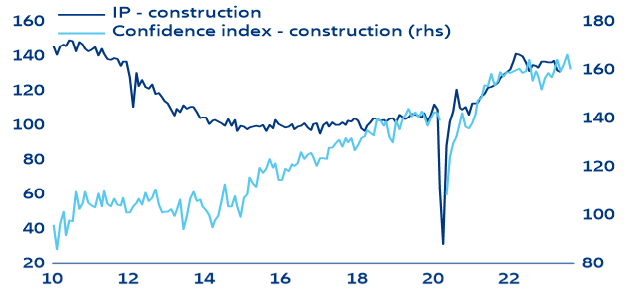
Paradoxically, we expect the gradual unwinding of the tax scheme (already revised in February 2023) to provide some relief to upcoming budgets, but we expect construction sector momentum to soften further. Monthly activity and sentiment data (Figure 2) confirm activity has started to slow down, hinting at a reversal of the visible improvements seen in 2021 and 2022. Industrial production decreased by -2.6% per month on average in the first quarter of this year (compared to an average increase of +12.8% in 2022) while sentiment and employment intentions in construction deteriorated recently. Furthermore, the latest business insolvencies data for the sector corroborate the halt in the downward trend initiated in 2021. In fact, the August increase was more than +50% compared to the same month of 2022.
Figure 2: Italy – industrial production and sentiment index in construction
Sources: Refinitiv Datastream, Allianz Research
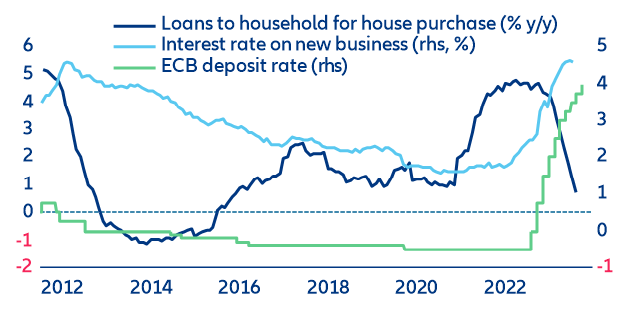
Fiscal measures winding down coupled with the rapid monetary policy tightening impact on credit demand and supply have created a dangerous cocktail for the broad Italian housing market. However, the tax credit has had a minimal impact on prices. Demand for credit declined at a faster pace than in 2012 while mortgage rates reached a record-high (Figure 3). While the introduction of the tax credit was expected to push up existing house prices, its effect has been imperceptible amidst the headwinds the sector is facing. In fact, the price of existing houses has increased less than the CPI or construction costs, which leaves real prices even lower. Analyzing the dynamics of the existing housing market is inherently complex, particularly at an aggregated scale. Yet, as energy-efficiency gains become more important in a context of fluctuating energy supplies, we expect a significant divergence between those who have undergone the renovation and those who have not. For the former, green renovations will help cushion the expected downturn in the housing market. Though Italy is emerging from a long housing market depression, we expect new house prices is to decrease by a further 3-5% until end-2024.  
Figure 3: Italy – Housing loans, rates on new business and policy rate
Sources: Refinitiv Datastream, Allianz Research
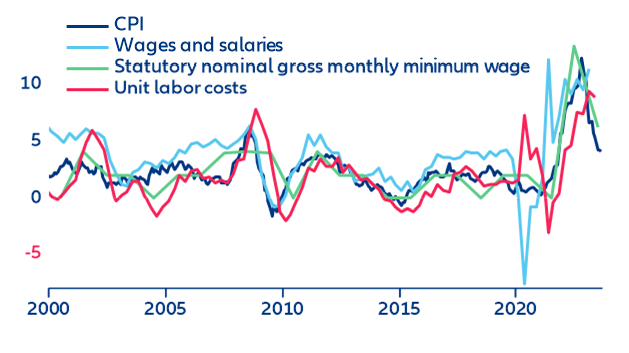
Belgium’s automatic wage-indexation system has raised fears of a wage-price spiral. But cooling energy prices are giving the government breathing room to defer some increases. Belgium is one of the few Eurozone countries to have an automatic wage-indexation system for most incomes. Wages in the private and public sectors, pensions and all social benefits are periodically adjusted to the cost of living, measured by the Health Index. When energy prices spiked in 2022, Belgium saw a higher pass-through from wholesale to retail markets because of its lower taxation of energy products compared to Eurozone peers. As a result, the CPI peaked at 12.3% in October 2022 (Figure 4). But the normalization of energy prices helped the CPI drop to 4.1% y/y in August 2023, while core pressures remain strong but posted their third consecutive decline (at 7.7%). This has allowed the government to postpone some indexation tranches.
Figure 4: Belgium – Inflation, wages and unit labor costs 
Figure 4: Belgium – Inflation, wages and unit labor costs
Sources: Refinitiv Datastream, Allianz Research
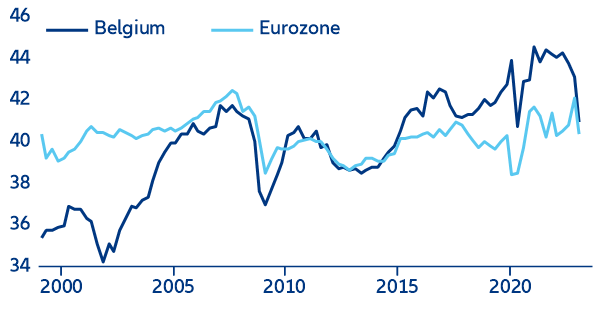
Belgian firms and the government are bearing the costs of indexed wages. In 2021-2022, the government made agreements with part of the private sector (one-off tax-free bonus between EUR500 and EUR750 instead of automatic increases) to preserve companies’ competitiveness in the face of rising wages. Yet, companies’ profits have been declining since Q3 2022 (Figure 5), which suggests that firms are not able to pass completely higher labor costs (and other production costs) to consumers. While government finances are declining from the peak seen in 2020, they have also been impacted by the mechanism. The boost to government revenues from higher inflation seems to not have offset the dynamic in 2022.
Figure 5: Gross profit share of non-financial corporations
Sources: Refinitiv Datastream, Allianz Research
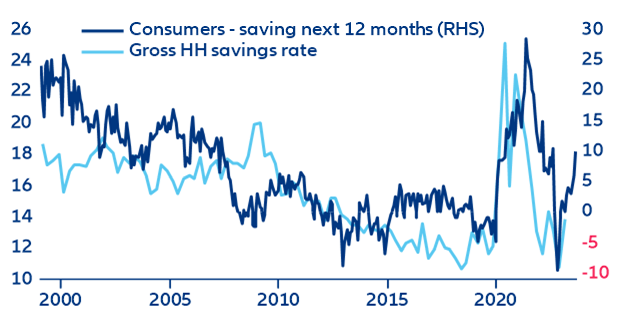
The labor market remains strong but shows the first signs of cooling. While the unemployment rate is low at 5.5%, the number of both employed and unemployed has decreased, and the inactive population has also increased. Belgium’s vacancies rate is still the second-highest in Europe, though it fell slightly from 4.68% to 4.63% in Q2 2023. Moreover, employment intentions are easing as indicated by the latest European Commission survey. Given increasing savings rates and intentions (Figure 6), this should provide some support to ease the pace of wage growth. However, if energy prices reverse markedly, more persistent inflation than anticipated could reinforce concerns over unsustainable wage setting.
Figure 6: Belgium – savings rate and intentions
Sources: Refinitiv Datastream, Allianz Research

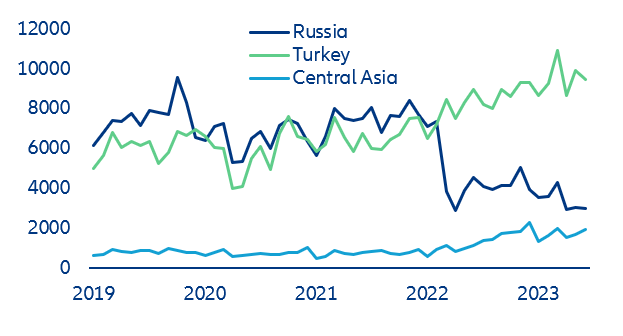
Despite efforts to enforce sanctions, EU goods under export ban still seem to find their way to Russia via third countries. Even though the EU issued comprehensive sanctions against Russia following its military invasion of Ukraine in February 2022, the Russian economy has not contracted as much as forecasts in 2022 predicted. One reason might be that the West has shielded energy from sanctions out of fear that a full embargo would cause oil prices to spike and drive the global economy into a recession. Another reason is that sanctioned goods continue to find their way into Russia. Looking at aggregate exports from the EU to Russia, we find a drop of -52% comparing H1 2019 to H1 2023 (Figure 7). But trade data indicate that EU-sanctioned goods might be exported to a considerable extent from the EU to third countries and from there to Russia. These are mostly countries that have not sanctioned Russia, such as Turkey, or are historically, politically and economically close, such as countries in Central Asia. Particularly for those that form the Eurasian Customs Union together with Russia, there are minimal checks once goods enter one of the member states.

EU exports to Turkey, for example, increased on average by +58.1% between H1 2019 and H1 2023. The numbers are even more striking for Central Asian economies: EU export values to Kazakhstan are up +100%, to Kyrgyzstan by a striking +800%, to Tajikistan by +151%, to Turkmenistan by +78.5% and to Uzbekistan by +66.6% comparing H1 2019 and H1 2023. This alone is not yet evidence, but Turkey and the Central Asian economies also trade more with Russia. Turkish exports to Russia stood at USD0.4bn in 2019 and increased to USD0.9bn in 2022. Similarly, in Central Asia, exports to Russia increased by +53.8% from USD0.8bn in 2019 to USD1.2bn in 2022.

Figure 7: EU exports, in euros
Sources: EU Comext, Allianz Research
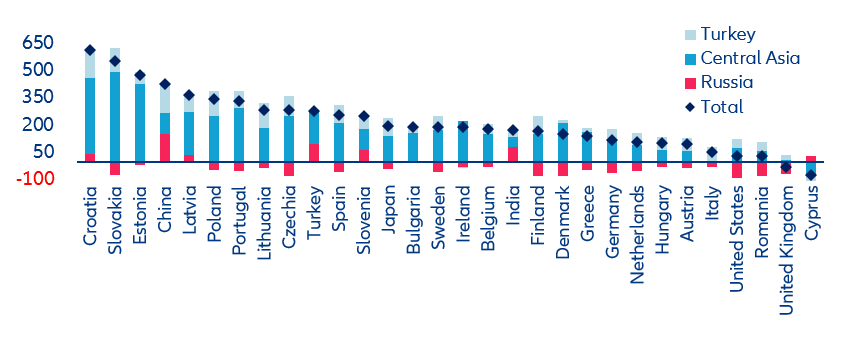
The notable shifts in trade patterns do not necessarily prove sanction evasion but could also be genuine trade diversion. Looking at patterns in trade exposure between Russia and individual countries gives an indication of the circumvention of shipments. Most western countries – with the exception of Croatia, Latvia, Slovenia and Cyprus – have sharply cut their direct exports to Russia, while others such as China, India or Turkey have increased it (Figure 8). But exports to Russia via Central Asia or Turkey have gone up everywhere – except for Cyprus. Most countries overall see a massive surplus in export flows across these countries comparing H1 2019 to H1 2023. Nevertheless, trade data does not give an indication of whether companies know that their products end up in Russia.
Figure 8 : Growth in exports to Russia, Central Asia and Turkey, H1 2019 to H1 2023, in %
Figure 8: Growth in exports to Russia, Central Asia and Turkey, H1 2019 to H1 2023, in %
Sources: National Sources, IMF DoTS, Allianz Research
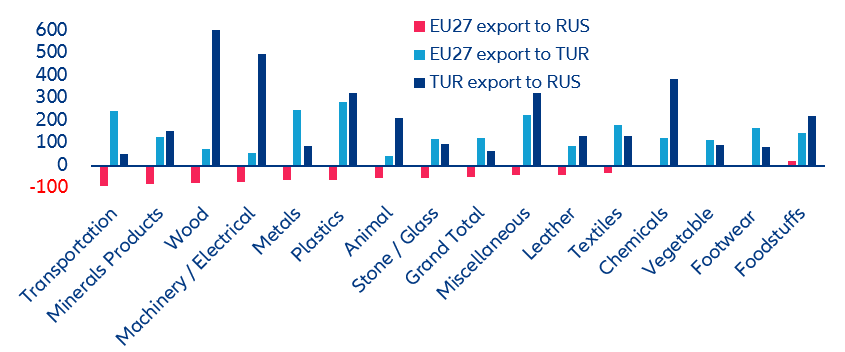
The issue of circumventing sanctions is particularly concerning when it comes to restricted goods. Under current sanctions, the export of certain technologies, including advanced semiconductors, electronic components and software, to Russia is prohibited. Additionally, the export of dual-use goods, such as drones or encryption tools that can be used for both civil and military purposes from the EU to Russia is also forbidden. In this line, trade data show a massive decline of direct exports of sanctioned goods to Russia in transportation (-90.9%), mineral products (-83.8%) and machinery and electricals (-71.1%). But the same sectors also show increases in EU exports to Turkey and Central Asia and from Turkey into Russia (Figure 9). While there is no issue if goods are traded legally, their path through third countries is worth paying attention to. If sanctioned items are exported to third countries and then re-exported to Russia, the underlying due diligence inadequacies will be considered sanctions law violations.
Figure 9: Growth in sectoral exports to Russia and Turkey, H1 2019 to H1 2023 in % 

Figure 9: Growth in sectoral exports to Russia and Turkey, H1 2019 to H1 2023 in %
Source: Sources: National Sources, Allianz Research
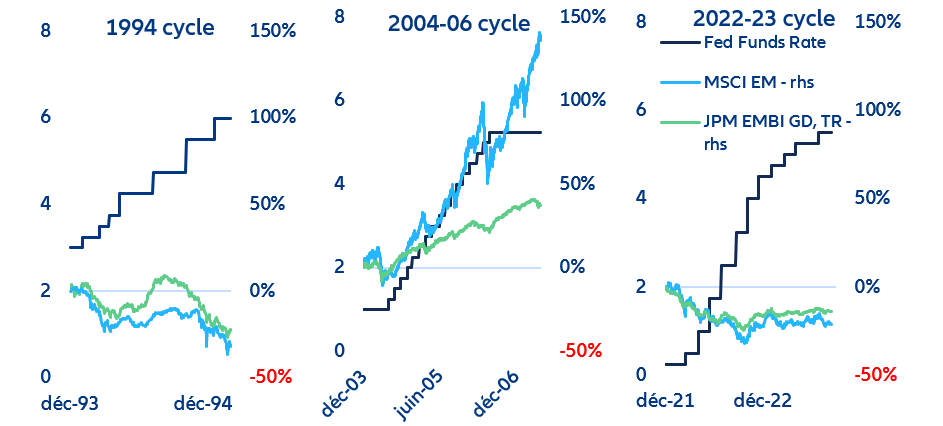
As structural concerns overshadow China's reopening tailwinds, and uncertainties around disinflation and central bank rates linger, are investors once again being too optimistic on emerging markets (EMs)? In 2004-2006, the Fed’s policy rate peak coincided with peak EM sentiment. During that period, factors such as the commodities supercycle, robust economic growth, inflation not that far from target and China's remarkable growth rates – which arguably underpinned the previous factors – fostered a surge of optimism. But this sentiment overlooked the sustainability of these growth rates and the potential negative effects of the ongoing tightening. Today, narrow spreads in EM hard currency sovereign bond benchmarks (Figure 10) resemble the 2004-2006 hiking cycle and raise the question of whether their initial resilience has led to an excess of investor optimism. However, the factors that spurred optimism then are missing from the current situation: economic growth prospects are weak, even for China. The scenario for EMs remains challenging: exceptionally tight monetary policy combined with China's slowdown pose notable risks to both the current and capital accounts of developing economies.
Figure 10: Evolution of EM hard currency sovereign spreads and interest rate cycles in the US
Source: Bloomberg, LSEG Datastream
These signs of optimism only emerged in 2023 and have overall been more modest than the 2004-2006 surge.  2022 posed challenges across financial markets, leaving few safe havens (regions or asset classes), but the USD strength contributed to the further underperformance of EM fixed income. The hiking cycle coincided with a war with global repercussions, which fueled the flight to safety. To add to this, serious doubts emerged about China’s economic and geopolitical trajectory. While the resurgence of optimism in 2023 has changed the trend, the cumulative results of this cycle remain underwhelming (Figure 11).
Figure 11: Performance of two major EM benchmarks during three Fed hiking cycles (shared legend)
Sources: Bloomberg, LSEG Datastream, Allianz Research. The starting date corresponds with the end of the year prior to the cycle.
Investors are being selective in their optimism, a sign that they are not disregarding the risks inherent to the current situation. Spreads in higher-yielding nations have diverged from those in better-rated countries, indicating a clear differentiation by investors based on perceived risks. Notably, many vulnerable EM sovereigns are grappling with limited access to financial markets. Their limited weight in – or even outright exclusion from – major benchmarks masks the ongoing correction. We acknowledge this is a sign that market participants are not disregarding the risks inherent to the current situation, but we expect benchmark USD spreads to widen until year-end by 30-40bps. In the medium to long term, should high yields persist, financial pressures on these countries would inevitably impact debt sustainability, increasing servicing costs and shrinking the fiscal buffer for vital public expenditure. On balance, the prevailing risks remain skewed to the downside.
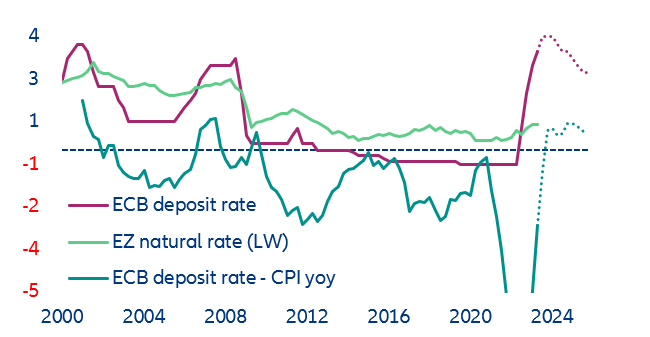
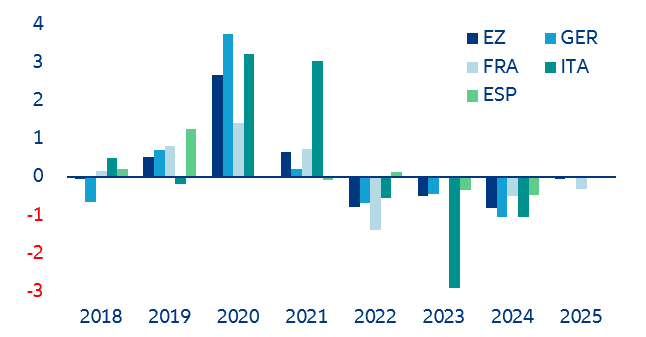
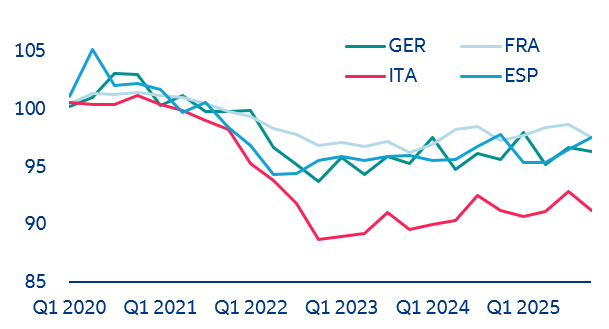
The Eurozone is heading into a challenging 2024 as the ECB’s policy rates will turn more restrictive in real terms at the same time as governments are tightening their belts. While we expect the ECB to start cutting rates in mid-2024, the real policy rate, approximated as the policy rate minus inflation, will rise amid ongoing disinflation. In fact, it will approach estimates of the neutral Laubach Williams natural rate, which it has never even come close to in Eurozone history (Figure 12). Secondly, monetary policy impacts the real economy with a lag. Since the terminal nominal rate has likely been reached only just now, and the real terminal rate will be reached in 2024, monetary policy will have a highly restrictive impact for the foreseeable future. Meanwhile, after large stimulus packages during the Covid-19 pandemic and the war in Ukraine, Eurozone countries are now turning towards fiscal consolidation through more stringent budgetary measures (Figure 13 and 14). Fiscal stimulus in the Eurozone is expected to drop by -0.8% in 2024, slightly more than the -0.5% drop in 2023. To add to this, the Eurozone is unlikely to see any substantial growth support coming from household consumption as ongoing nominal wage increases will barely compensate for the large level losses that have occurred amid high inflation rates in 2022-23 (Figure 15). In short, the consumer will not come to the rescue this time either.
Figure 12: ECB deposit rate in nominal and real terms and Laubach Williams estimate of Eurozone natural rate

Sources: Datastream, Allianz Research.

Note: Dots represent Allianz Research forecast.

Figure 13: Contribution of government consumption to growth (pps)

Sources: European Commission, Refinitiv Datastream, Allianz Research.

Note: Fiscal stimulus is defined as the annual delta in general government balance excluding interest, cyclically adjusted based on potential gross domestic product.

Figure 14: Fiscal stimulus in Eurozone and big-4 countries


Sources: European Commission, Refinitiv Datastream, Allianz Research.

Note: Fiscal stimulus is defined as the annual delta in general government balance excluding interest, cyclically adjusted based on potential gross domestic product.

Germany is pursuing fiscal consolidation through a strict budget course in the coming years – but it could be disrupted by a shadow budget. German fiscal policy will remain much more supportive than the pre-pandemic period. Due to the current cyclical and structural headwinds, the call for fiscal stimulus is high and the government announced an economic package worth EUR32bn of corporate tax cuts – spread over four years and probably financed by budget cuts rather than increased spending. Clarifying the fiscal outlook is thus challenging as many budget questions remain open.

A large share of fiscal action in recent years has been in off-budget spending, and it will probably continue to do so. Despite record spending, the federal government is in a bind. The desires of the government coalition are too high and thus borrowing is much higher than officially stated. To comply with the debt brake anchored in the basic law (“Grundgesetz”), net borrowing is only possible to a very limited extent. According to the draft, new debt should be EUR16.6mn in 2024, which is around EUR30mn less than in 2023. Fiscal balance as a percentage of GDP will improve from -3.7% in 2023 to -1.9% in 2024. While the budget deficit is expected to drop from 2.6% of GDP in 2022 to around 2.25% in 2023, 1.25% in 2024 and even 1% in 2025, mainly due to a reduction in spending on pandemic- and energy-crisis related support.

Overall, Germany's fiscal policy is expected to remain looser than before the pandemic, with a budget deficit projected for 2025 compared to a surplus in the years leading up to 2019. While the structural primary budget is likely to turn positive again in 2025, the surplus will be smaller than pre-pandemic levels. This balanced fiscal stance seems reasonable, considering Germany's current inflation levels and tight labor market, as well as the recognition that its pre-pandemic fiscal policy may have been too restrictive and contributed to below-target inflation.

However, due to federal special funds outside of the federal budget, such as for the Bundeswehr or the climate and transformation fund, real government spending in 2024 will be around EUR540bn instead of the officially stated EUR445.7bn. In addition, the government had already booked almost EUR90bn into the budget when the debt brake was temporarily suspended. The special funds have been criticized as they interfere with Parliament’s budget law. In addition, it would be more accurate to speak of “special debts” as debts and spending programs worth billions are hidden in there. The official path to fiscal consolidation in Germany is thus undermined by a shadow budget.

Meanwhile, France is kickstarting a modest fiscal consolidation amid a challenging macroeconomic backdrop. The French government is set to unveil its 2024 budget bill on 27 September. The Ministry of Finance is floating around EUR16bn of savings (around 0.6% of GDP) to target a fiscal deficit of -4.4% of GDP after -4.9% in 2023. It has already announced that it will forecast real GDP growth at +1.4% in 2024, a -0.2pp downgrade compared to its previous vintage. Nevertheless, the government’s real GDP growth still looks optimistic relative to the consensus forecasts (+0.8%; Allianz: +0.7%). The -4.4% deficit target may thus be difficult to achieve amid lower tax collections.

Tax revenues since the beginning of the year have already been weak amid falling VAT collections. They could undershoot next year because of weakening social contributions amid much slower job creation. The bulk of savings the government will count on will come from the phasing out of the tariff shield and other energy subsidies – this should bring around EUR10bn of lower spending relative to 2023. Besides these ‘’automatic’’ spending cuts as the energy crisis subsides, the government is looking for savings on health and labor market spending (potentially EUR1.7bn of savings on the latter).

On the revenue side, the government plans to hike or create new taxes to fund the green transition, such as a tax on flights departing from France. Housing policy is also expected to be tightened: For instance, the ‘’Pinel’’ tax credit (subsidizing investment in new housing for leasing) may be removed while the scope of ‘’zero interest rate’’ housing loan subsidy could be reduced. Against this backdrop, the government announced it will raise tax brackets in line with inflation to avoid an increase in the effective income tax rate for taxpayers (a long-lasting pledge of President Macron). This will mean a substantial EUR6bn of foregone revenues for the state. In all, we expect the government to miss its deficit target of -4.4% of GDP (we expect -4.6%) but broadly to stick to its consolidation plans despite lacking a majority in Parliament.

In Italy, tax credit expenses have added clouds to the fiscal outlook. Though the high inflation environment has helped to reduce the public debt ratio in the last couple of years (-10.5pps to 144.4% in 2022) via a higher denominator and a boost to government revenues, fiscal balances have not significantly improved since the massive stretch made during the pandemic and continued throughout the energy crisis. In Italy, a generous tax credit scheme (see Italy’s superbonus – housing boom and bust) has generated expenses larger than initially expected, also producing downward revisions to the 2021-22 fiscal deficits.

The government will submit the update to the 2023 budget on 27 September and soon after that the new fiscal targets for the next years. Though we expect some consolidation efforts, also in light of the likely reintroduction of the Stability and Growth Pact in 2024, the government will be stretched to cover unplanned costs as well as to meet electoral pledges (i.e. the tax wedge cut). Latest official estimates published in June foreseen a government deficit of 4.5% in 2023 and 3.7% next year (compared to our forecast of -5% and -3.8%, respectively) but higher financing needs (linked mainly to the tax credit, the revaluation of pensions and the delayed payment of the third instalment of NGEU funds) are not being compensated by the still higher revenues boosted by inflation. Moreover, economic activity has been slowing down.

Finally, interest payments will challenge further the fiscal position as the debt burden is gradually increasing as higher rates will kick-in on the debt that has to be rolled over. After a decade of a declining trend, we estimate that the interest payments to GDP will stay close to 4% in the coming years.

Spain has a good fiscal consolidation plan but its effectiveness remains to be seen. Whatever the outcome of the general election in July 2023, the need to address public finances will be unavoidable, limiting any attempt to pursue a more expansionary fiscal policy. Indeed, the 2023-2026 stability program presented by the government proposes a gradual reduction in the budget deficit, driven by the recovery of the Spanish economy from 4.8% of GDP in 2022 to 3.9% in 2023 and 2.5% in 2026.

While the economic recovery in 2021-2022 and rising inflation as a result of the energy crisis have helped improve the deficit and debt ratios, the next Spanish government will need to take further action in the future. While a left-wing government would likely raise taxes, a right-wing alliance would likely focus on cost-cutting. It should be noted that the fiscal effort over the next few years is likely to be significant, given the pressure from the pension reform that came into effect this year, which links pensions to the previous year's inflation index. The IMF estimates that this reform could add 3.2-3.5% to pension expenditure by 2050, on top of the 1pp increase due to population aging. As part of the National Recovery and Resilience Plan (NRPP), the European Commission has asked the Spanish government to reintroduce an adjustment factor that would adapt initial pension benefits to changes in life expectancy and the intergenerational equity mechanism. Failure to adopt these measures would reduce future tranches of EU recovery funds allocated to Spain, which is one of the main beneficiaries of the mechanism. We expect the budget deficit to average 4% of GDP in 2023-2026 and the gross debt to improve slowly from 112% of GDP in 2022 to 108% of GDP in 2026.

Eurozone governments and institutions have been working on setting the ground rules to return to a more advisable application of the EU fiscal framework, envisaged for 2024. Negotiations are still ongoing but it is clear that some form of discipline will be needed, also to not erode all the monetary policy efforts made so far. The negotiations have focused on more flexible and tailored rules to avoid harming countries’ economic growth and to avoid procyclical rules, as well to stimulate green investment and the green transition. Though it is urgent, we expect a political agreement will be very challenging to reach. But we believe countries will make their best efforts in the coming months, a must to ensure their debt-reduction paths will be sustainable and credible in the medium term.

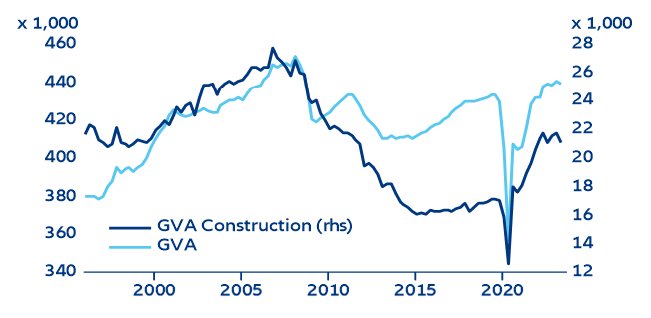
Figure 15: Eurozone - real wages (Index: 100 = Q4 2019)
Sources: Refinitiv Datastream, Allianz Research
Ludovic Subran
Allianz SE

Roberta Fortes

Allianz Trade

Maddalena Martini
Allianz SE
Maxime Darmet
Allianz Trade
Bjoern Griesbach
Allianz SE

Samuele Girardelli

Allianz SE

Pablo Espinosa-Uriel
Allianz SE
Jasmin Gröschl
Allianz SE