When the world’s top central bankers virtually convene at this year’s ECB Annual Forum, the scale and duration of the current surge of inflation will invariably be high on the agenda. But we continue to believe that the current cyclical price pressures are unlikely to morph into a long-lasting trend. As we first wrote in April 2021 , even though the pandemic is unchartered territory, the recent strong rebound in inflation is a product of the exceptional circumstances and hence likely to be temporary. While the reopening boost to services has eased, supply-chain disruptions since the start of the year have kept input prices and supplier delivery times at record high levels. Sharply rising energy prices have also pushed up headline inflation, which should remain elevated over the next few months as the recovery becomes entrenched.
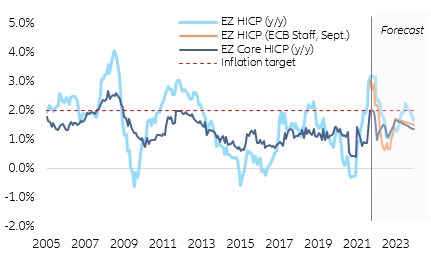
Figure 1 – Evolution and projections of Eurozone inflation (y/y, in %)
Sources: Refinitiv, Allianz Research
While there is still considerable uncertainty about timing and the eventual peak, we expect the inflation momentum to lose steam in early 2022 as base effects of energy prices dissipate and transitory factors due to the re-opening dynamics, including supply-side constraints, and the impact of German VAT changes, fully unwind. In fact, month-on-month, price pressures have started declining already. Consistent with recent forecasts by the
European Commission and the
ECB, we project average annualized HICP inflation of 2.2% and 1.5% in 2021 and 2022, respectively, with negative base effects to rein in inflation pressures in the second half of 2022 following the “inflation surge” during H2 2021 (Figure 1). Over the longer term, inflation expectations seem well-anchored. Though professional forecasters have slightly revised upwards their inflation outlooks for the next five years, even headline inflation remains firmly below the ECB’s inflation target.
It could get worse before it gets better … While the pick-up in inflation seems to have cooled over the summer, pandemic-induced supply chain disruptions have deteriorated as high demand and Covid-19 outbreaks in Asia exhaust transportation capacity, resulting in labor and materials shortages affecting especially manufacturing and construction.
The strong surge in demand from the recovery, especially for electronics, coupled with specific supply disruptions, led to bottlenecks in global supply chains, which we estimate to have cut global trade growth in volume by more than -2pp in H1 2021. In its recent
Economic Bulletin, the ECB estimates that Eurozone countries lost 6.7% of goods export volumes due to bottlenecks in supply chains in the first half of 2021, driven by shipping disruptions and shortages of certain products (shipping congestions represent at least one-third of the rise in trade flow value this year, according to our in-house trade model). The ECB also finds that strong goods demand currently accounts for about two-thirds of global manufacturing delays. A still large gap between orders and production despite rising inventories and improving delivery times (Figure 2 and 3) suggests that excess demand has amplified the impact of supply-side constraints.
Figure 2 – Production shortfall (PMI new orders – PMI Output, in points)
Sources: Markit, Allianz Research
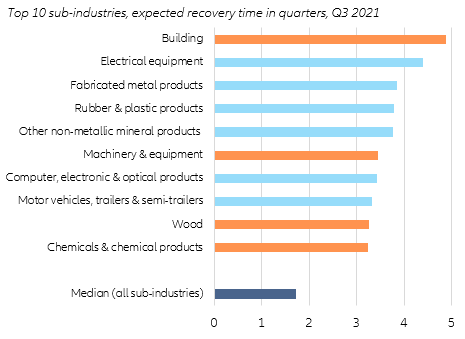
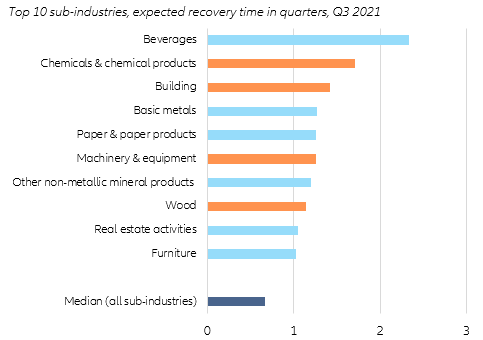
It could take time to normalize as manufacturers rush to restock amid historically high domestic production shortfalls and low inventories, which, in turn, may further fuel the recovery in volumes and prices. Construction/building is posting the highest materials shortage, which is also acute in electrical equipment as well as metal and non-metal products. Past evidence of recovery times suggests that it could take some industries more than three quarters to resolve current shortages (and almost two quarters for all industries on average), which would bring us to the end of Q1 2022 (Figure 4).
Figure 3 - Manufacturing sector: supplier delivery times (indexed)
Sources: Markit, Allianz Research
Figure 4 - EU: materials shortage intensity
Sources: Refinitiv, Allianz Research
To add to this, the Eurozone, like other advanced economies, is also facing labor shortages in several sectors, which may increase inflationary pressures. We find that recovery times are more than a quarter in the most affected industries, many of which also face material shortages (Figure 5).
Figure 5 – EU: Labor shortage intensity
Sources: Refinitiv, Allianz Research
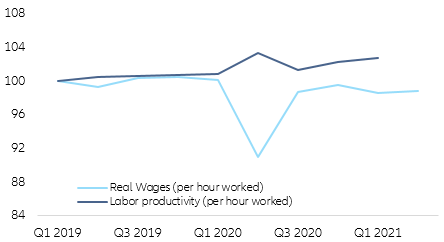
The scarcity of labor might worsen if partial unemployment schemes are not withdrawn completely by the end of the year, and if sluggish (re-)hiring by offering better working conditions, including higher wages, results in prolonged recovery-related labor reallocation. Some wage pressures could be building as real wages have not kept pace with productivity gains since 2019, suggesting that businesses’ non-labor unit cost component is driving current inflation as firms cope with higher input prices by preserving mark-ups (Figure 6).
Figure 6 – Eurozone: real wages and labor productivity (Index, 100 = Q1 2019)
Sources: Refinitiv, Allianz Research
In short, the continued release of pent-up demand could keep supply-side constraints higher for longer, while prevailing unemployment support schemes, even if more targeted, could keep labor market shortages elevated. If so, long-lasting supply shortages of natural gas and intermediate inputs as well as skilled labor would result in sustained price pressures, dampen the recovery, and hinder efficient resource reallocation, especially in countries with a large manufacturing base.
… but considerable economic slack will keep inflation from wage pressures and selling prices at bay. Despite the softening Eurozone growth momentum over the summer, the recovery is likely to be partial and uneven, with real growth forecast at +5.0% and +4.2% in 2021 and 2022, respectively. The current slack in the Eurozone remains sizable, leaving output in Q2 2021 more than -2.5% below its pre-pandemic level. While most Eurozone countries will recover to pre-crisis activity levels before the end of 2021, output gaps remain large, with persistent divergence across countries, suggesting limited price pressure even with reasonable assumptions on the steepness of the Phillips Curve.
(i) Pricing power. Expectations of higher selling prices to protect margins continue to rise but pricing power seems limited, especially over the longer term and in industries driving the current goods inflation, such as manufacturing (Figure 7). This raises the question of how the normalization of demand for goods and the concomitant rotation back to services would impact inflation. We think the overall effect should be net disinflationary as services inflation is likely to be more muted after catch-up effects dissipate. In addition, there are indications that demand has adjusted to constrained supply, which should make broad-based price setting more difficult.
Figure 7 – Short-term and long-term sectoral pricing power
Sources: Eurostat, Euler Hermes, Allianz Research
(ii) Wage setting. Eurozone wage pressures have been spotty, and the risk of large second-round effects appears to be limited for now as labor market slack is likely to persist for an extended period. While supportive policies have prevented massive job losses, labor participation has declined and artificially dampened the unemployment rate. The gradual phasing-out of policy support will bring back workers into the labor force, especially in lower-paid service sector, attenuating any impact on wages, particularly in the more vulnerable countries where nominal wage rigidities are more binding. There could be pockets of inflationary wage-price loops in sectors with pre-crisis labor shortages (e.g., financial services, health services, and communications technology), as opposed to sectors where labor shortages are temporary (and are likely to unwind as partial unemployment schemes expire). However, over the longer term, labor market slack—especially in terms of hours worked—slowly increasing employment and the stickiness of inflation expectations (and consequently core inflation) are likely to weigh on wage-driven inflation.
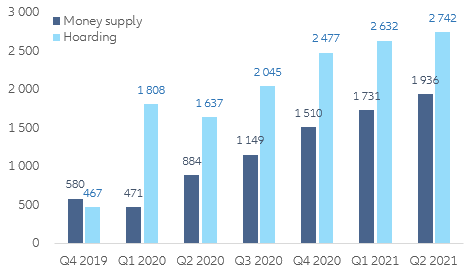
In addition, the hoarding component of excess savings has increased and dampens inflationary pressures from money supply over the longer term. Another inflation driver to watch is the sharp increase in money supply. For now, however, after more than two decades of secular decline, money velocity struggles to accelerate even amid the strong rebound in GDP growth. Despite a rapid expansion of money supply boosting private consumption, precautionary savings (after controlling for investments) remain stubbornly high amid continued uncertainty (Figure 8 and 9). This suggests lower nominal spending, which weighs on inflation as transactional money balances of households and corporates diminish relative to the growth of base money. Recently, money growth has slowed.
Figure 8 – Evolution of global money supply (y/y, in%)
Sources: Refinitiv, Allianz Research
Figure 9 – Money supply and money hoarding (cumulative change since Q1 2020, in EUR bn)
Sources: Refinitiv, Allianz Research
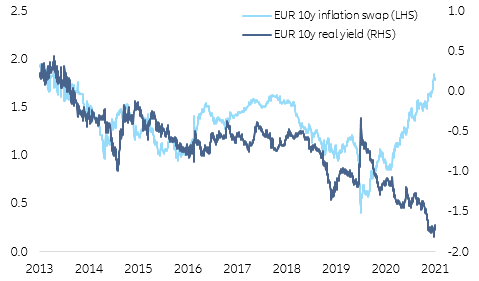
Market-implied inflation expectations are consistent with a fundamentals-based view of transient price pressures. One could be forgiven for interpreting the recent rise in long-term German government bond (Bund) yields as a sign of a bear-steepening re-run of rising inflation causing bonds to sell off. Indeed, the market price of inflation protection has recently risen significantly, while real yields have shown little movement. At first glance, the case for a stagflation scenario seems vaild (Figure 10).
Figure 10 – Market-based inflation vs. real yields (in %)
Sources: Refinitiv, Allianz Research
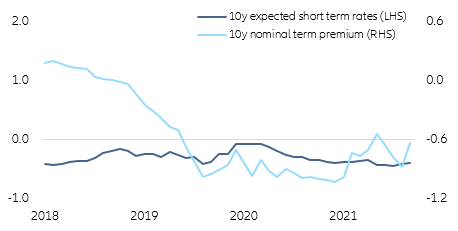
But this ignores the fact that the market for inflation protection is currently highly distorted due to low liquidity and high demand. In the US, we estimate the excess premium due to tight market conditions at 60bps. In the Eurozone, where the market is even more fragmented, this value is unlikely to be lower. Decomposing the term structure of German Bunds, which serves as the Eurozone sovereign benchmark curve, suggests that the rise was not driven by higher expected short-term rates, which would have implied higher inflation expectations (and a repricing of the inflation outlook). Instead, the yield increase was attributable to a higher nominal term premium due to a higher risk component (Figure 11).
Figure 11 – Decomposition of German 10-year government bond yield (%)
Sources: Refinitiv, Allianz Research
Our interpretation is that this reflects higher uncertainty about the future changes in real rates (rather than inflation) after the ECB had adjusted the scale and pace of its asset purchase program, which has changed the duration supply-demand dynamics. At current levels, the upside potential is largely exhausted, especially at the long end. However, either a supply shock in duration or rising uncertainty about the development of inflation and real interest rates could create upward pressure. In our view, a lasting return of long-term Bunds to positive territory is conceivable only at the end of 2022 or at the beginning of 2023. This adjustment should take place gradually via the expectation channel, with a simultaneous decline in the compression of the term premium due to asset purchases.
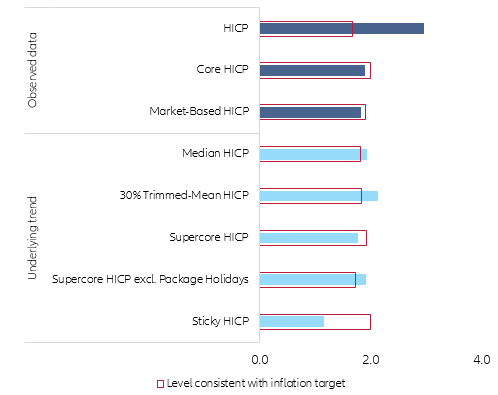
In short, with supply bottlenecks near their peak, we expect underlying inflation pressures to decrease gradually as long as wage growth remains spotty and price setting is limited (Figures 12 and 13). The effects of the supply-side constraints during the pandemic are reminiscent of those from the oil price shock, but the return of a 1970s-type resurgence of record inflation is extremely unlikely. Unlike the long stretch of soaring money supply and dismal growth during the easy money, deficit-strewn 1970s, the current fiscal expansion, massive government borrowing and prolonged monetary accommodation are very unlikely to usher in a period of stagflation. Most countries have adopted floating exchange rates, which act as absorbers to terms of trade shocks. Lower unionization and more open global markets have fostered higher competition in product and labor markets, weakening pricing power and wage bargaining. In addition, in contrast to the 1970s, most central banks in advanced economies, including the Eurozone, have adopted credible price-stability mandates to ensure low inflation.
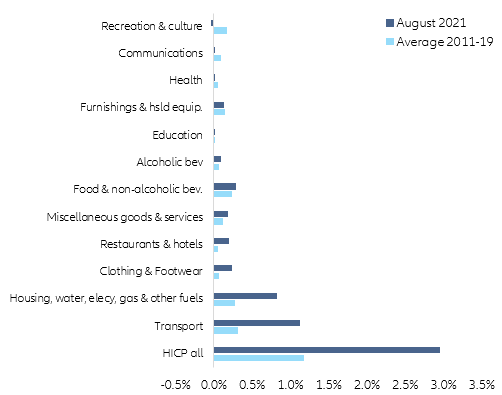
However, the prevailing uncertainty over inflation will test the ECB’s credibility and the way it will communicate “looking through” the current cyclical price pressures in formulating its monetary stance. Risks of large second-round effects from elevated headline inflation appear limited for now, with inflation expectations staying well-anchored and price pressures above the long-term average confined to a few sectors (Figure 12). The earliest indications of things going wrong will likely show up in the evolving expectations of inflation. If higher inflation fuels a spiral of wage pressures, higher expectations of inflation could, through price- and wage-setting, become a self-fulfilling prophecy. Scaling down unconventional measures and adjusting policy rates earlier would be necessary if evidence of inflation durably overshooting the price target materializes and before inflation expectations risk becoming unanchored.
Figure 12 – Eurozone: HICP breakdown by components (y/y, in %)
Sources: Eurostat, Refinitiv, Allianz Research
Figure 13 – Eurozone: observed vs. underlying inflation measures (y/y, in %)
Sources: Refinitiv, Allianz Research
Authors

Global Head of Macroeconomics and Capital Markets Research