Global FX implied volatility has declined to a historically low level.
In this paper, we address the following questions: Which currency (or currency bloc) has contributed the most to such a decline and why?
To which extent is global FX volatility linked to volatility in other asset classes (equities, interest rates)? How does the increasing importance of China for international trade impact global FX volatility, and do we see
a greater influence of CNY on currencies of countries with close trade relationships ? If so, to which extent does it dampen global FX realized volatility?
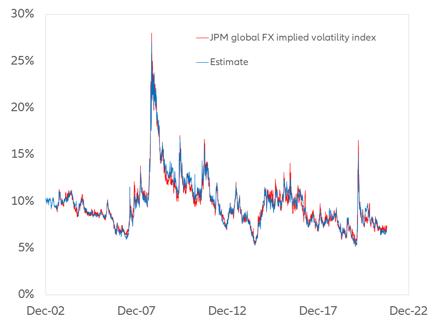
We characterize global FX volatility using the most commonly used market index J.P. Morgan’s global FX implied volatility index. Since index membership and composition are not publicly disclosed, we replicate the index as a linear combination of the one-month implied volatilities of selected currencies. We generate a very good fit to the historical dynamics of the index since 2003 using 12 out of the 28 currencies available
on Refinitiv (CAD, CLP, EUR, GBP, INR, JPY, KRW, MXN, MYR, PHP, SGD and TWD (R-sq= 0.9718; std estimation error = 0.46%)). Our model eliminates currencies whose implied volatilities do not improve the statistical power of our fit (i.e., they share “co-linearities” with other currencies in statistical parlance). For example, in the case of the CHF and the DKK with respect to the EUR or the AUD and the NZD vis-a-vis the CAD.
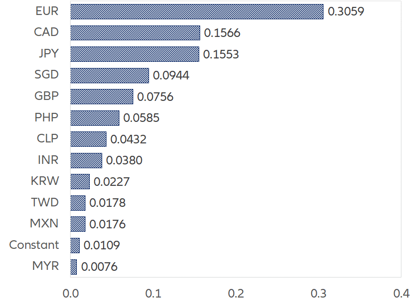
Figure 1 shows the weights inferred through this exercise (they are all statistically significant). We find that the EUR explains 30.8% of global FX volatility, followed by the CAD (15.8%), the JPY (15.6%) and the SGD (9.5%). Figure 2 then compares the JPM global FX implied volatility index with our estimate. On the basis of these weights, we can also determine that the EUR accounts for 36.6% of the decline in global FX implied volatility observed since the peak of 2008 (45.4% since the end of 2014), followed by the JPY (25.3% and 25.8%).
Figure 1 – Estimated weights in the JPM global FX implied volatility index
Sources: Refinitiv, Allianz Research
Figure 2 – Estimate of the JPM global FX implied volatility index
Sources: Refinitiv, Allianz Research
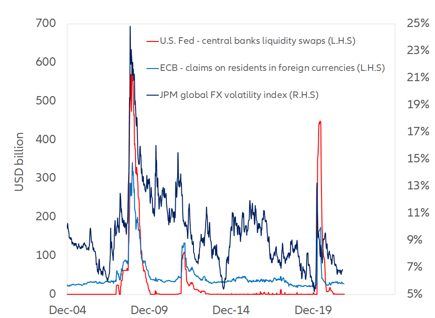
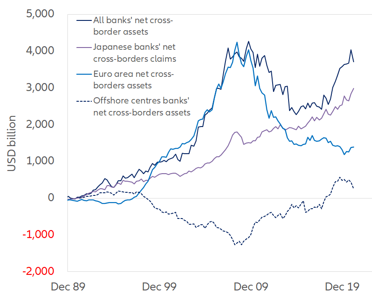
Big Brother is at work in FX markets … but not only there. Central banks’ liquidity support has helped to dampen global FX volatility during past periods of stress (Figure 3). Several spikes over the last two decades have coincided with rising global scarcity of USD funding. To mitigate this, the US Federal Reserve provided liquidity swaps to foreign central banks (red line) in September 2008, November 2011 and March 2020. Each time these swaps were made available at scale, the surge in FX volatility (dark blue line) subsided after foreign central banks passed USD liquidity to borrowing commercial banks. For instance, the ECB’s foreign currency lending to residents closely tracks the Fed’s lending to foreign central banks. At the peak of FX volatility during the Global Financial Crisis on 17 December 2008, the USD/EUR swaps accounted for almost 60% of the swaps made by the Fed. However, the size of required liquidity support from the Fed has declined over time due to structural changes. For instance, the potential demand for USD has declined since the GFC. As shown by the light blue line in Figure 4, Eurozone banks have drastically cut their foreign exposures outside the EMU, of which a large part is denominated in USD. Thus, at the 2020 peak (26 March), USD/EUR swaps accounted for only 40% of the Fed’s central bank liquidity swaps.
Figure 3 – US Federal Reserve liquidity swaps and ECB lending in foreign currency
Sources: Refinitiv, Allianz Research
Figure 4 – Net cross-border assets of BIS reporting banks by region
Sources: Refinitiv, Allianz Research
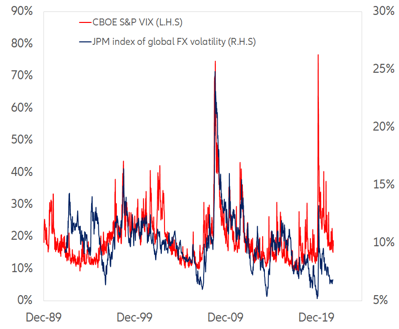
As shown in Figure 5, where the red line represents S&P 500 volatility (the Chicago Board Options Exchange’s CBOE Volatility Index or VIX) and the dark blue line global FX implied volatility, changes in FX volatility do not occur in isolation, especially if they are large. Historically, they are strongly linked to volatility of other asset classes and more correlated with equity volatility (VIX index) than US interest rates volatility (Merrill Lynch Option Volatility Estimated or MOVE index).
Figure 5: Global FX implied volatility and the VIX
Sources: Refinitiv, Allianz Research
Can’t we see the forest – the emergence of a CNY bloc – for the trees, its components? Interestingly, we do not find a statistically significant average contribution of the CNY to global FX implied volatility compared to other major currencies (see also Figure 1). We have eliminated the CNY implied volatility from our final regression results due to its negative weight, reflecting its low average value by far the lowest of the 19 currencies that pass the co-linearity test. Similarly, four of the other five currencies with the highest average volatility also carry a negative coefficient (BRL, COP, IDR and TRY) and are excluded. So, by design, our decomposition of global FX implied volatility is based on average effects and ignores the extremes.
However, the regional concentration of national contributions to global FX implied volatility warrants investigating whether the CNY has a gravitational pull on FX markets through trade relationships. Aside from JPY, which is a currency reserve, eight of the twelve currencies selected by our methodology for modeling global FX implied volatility (CAD, CLP, KRW, MXN, MYR, PHP, SGD, TWD) belong to countries that are located along the Pacific Rim and are members of the Asia-Pacific Economic Cooperation (APEC) forum. As such, they share strong trade and financial linkages with China. They also account for almost one-third of the decline in global FX implied volatility since 2008.
We examine the scope for a de facto “CNY bloc” operating through global realized FX volatility. We look at a basket of 25 currencies from both emerging and advanced economies comprising 21 APEC member countries (excluding JPY and USD) and four other countries (INR, ZAR, MUR, PKR).
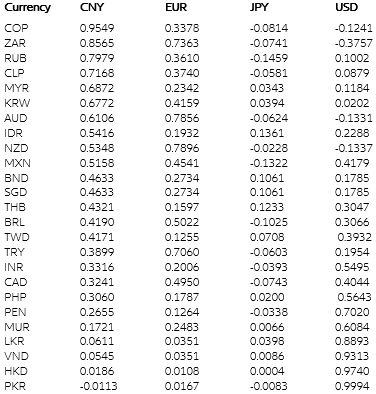
We model the weekly log returns (the dependent variable) of the 25 currencies under investigation as a linear combination of the weekly log returns since 1994 of four potential anchor currencies (or “attractors”) CNY, EUR, JPY, and USD using the CHF as common numeraire. The output of our multi-linear regression generates four “co-movement” coefficients of a currency to the CNY, EUR, JPY and USD.
Table 1 (cf. page 6) shows the latest values, sorted by descending co-movement coefficient with the CNY, of the four co-movement coefficients. The currencies most exposed to the CNY's gravity (CMC>0.5) are: the COP, ZAR, RUB, CLP, MYR, KRW, AUD, IDR, NZD and MXN.
Table 1: Average co-movement coefficients of selected currencies and their attractors (Jan. 1994-Nov. 2021)
Sources: Refinitiv, Allianz Research
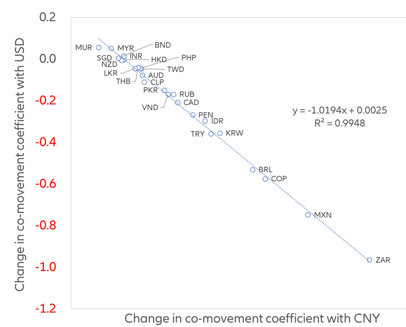
The co-movement coefficient with the CNY across all sample currencies has strengthened consistently over time. The currencies that have experienced the largest increases in their association with the CNY since 2014 are the ZAR, MXN, COP, BRL, KRW, TRY, IDR, PEN, CAD, RUB and VND. This increase came at the expense of a commensurate decrease in the co-movement coefficients with the USD (Figure 6, next page).
Figure 6: Change in co-movement coefficient with the USD and the CNY
Sources: Refinitiv, Allianz Research
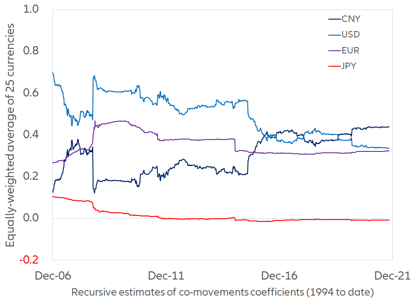
We also examine the way in which the co-movement coefficients have changed over time by estimating them recursively over time-varying samples. And we compute equally-weighted recursive estimates of the co-movement coefficients. Across the 25 sample currencies, the average co-movement coefficient with the CNY (Figure 7; dark blue line) has risen above the level of the USD coefficient (Figure 7; light blue line), which has declined. In contrast, the co-movement coefficients with the EUR and the JPY have barely moved; if anything, they have slightly decreased. The recursive estimates over a one-, three- and five-year moving period (not shown) confirm the increasing gravity of the CNY.
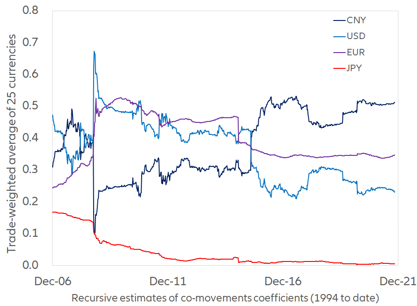
Finally, we control for the intensity of the trade relationship with China. For example, 18% of China’s imports from our sample countries come from Taiwan, but only 2% from India. Weighting the average co-movement coefficient by Chinese imports from each sample country accentuates the patterns (Figure 8). In other words, trade links (in addition to other factors, such as portfolio flows) underpin the emergence of a “CNY bloc,” which extends well beyond China’s backyard.
Figure 7: Equally-weighted average of co-movements coefficients
Sources: Refinitiv, Allianz Research
Figure 8: Trade-weighted average of co-movements coefficients
Sources: Refinitiv, Allianz Research
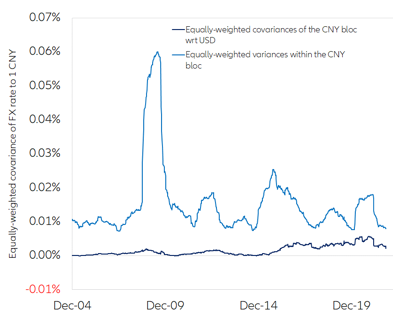
Finally, we examine whether the emerging CNY bloc has dampened global FX volatility. We decompose the aggregate volatility of the CNY and each sample currency relative to the USD into (1) the variance of the sample currency with respect to the CNY and (2) the covariance of the sample currency and the CNY with respect to the USD. There are two ways in which the emergence of a currency bloc can dampen global FX realized volatility with respect to the USD: (1) relative to the bloc’s anchor (CNY), the variance of the sample currency (e.g., KRW) may decrease (i.e., there may be less volatility within the bloc), and/or (2) relative to the USD, the covariance of the bloc's anchor (CNY) and the sample currency (e.g., KRW) may decrease, and even become negative (i.e., the co-movements of the bloc members with respect to the rest of the world may become more subdued). These two effects can either reinforce or partially offset each other. With respect to the covariance, (1) either the KRW and the CNY rise or fall together against the USD, which increases aggregate variance or (2) either one of the two currencies rises when the other one falls against the USD, which decreases aggregate variance (i.e., the movement of the KRW relative to its regional anchor – the CNY – offsets, at least partially – the movement of the regional anchor relative to the global anchor – the USD).
We find that the equally-weighted average of variance within the CNY bloc dwarfs the equally-weighted average of the covariances with the USD (Figure 9). Especially since 2014, the decline of the average variance within the CNY bloc has been larger than the increase of the average covariance. And this has happened despite higher CNY volatility with respect to the USD. Put differently, more stable cross-rates within the CNY bloc have dampened global FX realized volatility.
Figure 9: Variance within the CNY bloc vs. covariance of the bloc with the USD
Sources: Refinitiv, Allianz Research
It is not by mere chance that a CNY bloc has started to emerge after 2014 but rather a logical consequence of the growing integration, by design, of China in the global economy. From 2015 onwards, the Chinese central bank (the People’s Bank of China) has let the CNY be more driven by market forces. In 2016, the IMF included the CNY in the Special Drawing Rights (SDR) basket. Providers of capital market indices — the MSCI for equities in 2018, Bloomberg Barclays for bonds in 2019 — have, in turn, included Chinese financial assets in global benchmarks, thus reflecting their increased “investability” for non-residents.
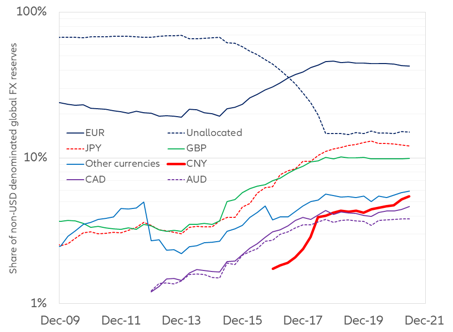
Two indicators among many show that both the official and the private sectors have validated the rationale behind such decisions. The share of the CNY in non-USD denominated global FX reserves has increased from 1.7% to 5.4%, the largest relative increase among currencies other than the dollar (red line in Figure 10, where the vertical axis is a log scale).
Figure 10 – Share of non-USD denominated global FX reserves
Sources: Refinitiv, Allianz Research
Last but not least, China and its foreign counterparts settle an increasing share of their current and capital transactions in CNY. From 2014 to 2020, RMB-settled cross-border receipts and payments by non-banking sectors have grown on average by +16.1% and +14.4% a year, against +3% for foreign currencies.
The emergence of a CNY bloc means that a China factor is increasingly present in a large set of non-CNY-denominated assets. This can create “hidden” opportunities as well as “hidden” risks. Unless China or its trading partners turn decisively inward, this is here to stay.