Executive Summary

An initial ‘back of the envelope’ calculation suggests that the recent heatwave across the United States, Southern Europe, and China may have cost 0.6pp of GDP in 2023. The cost ranges from 0.1pp for France to 1.3pp of GDP for China.  One day of extreme heat (above 32 degrees) is equivalent to half a day of strike.

Adaptation is key. In the short term, warning and prevention measures can be put in place. But these need to be complemented by longer-term structural adaptation measures aiming at preparing cities for climate change (i.e., urban greening) and finding ways to productively adapt workplaces to increased heat burden (i.e., adapting buildings, infrastructure, and working hours).

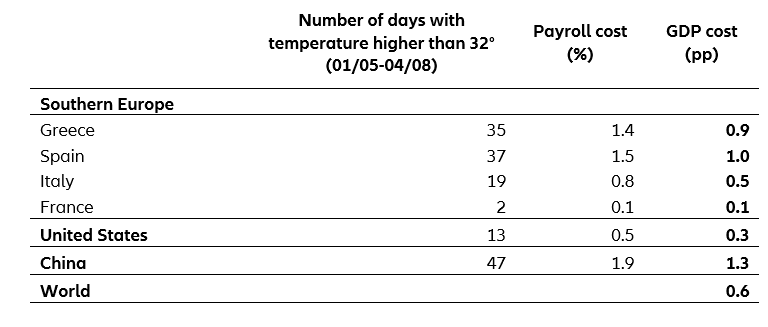
Over the past couple of months, the US, Europe, China, and other countries in Asia have been faced with record high temperatures. Everywhere, news reports of record high temperature have made the headlines, highlighting the physical risk of climate change and questioning economic resilience to extreme temperatures. Figure 1 shows daily 2-meter air temperature measured by satellite data and computer simulations to offer a real-time snapshot of global temperatures. According to Copernicus Climate Change Service/ECMWF, last June was the hottest month of June on record. The world’s oceans reached record high temperatures for two months running over April and May, according to the National Oceanic and Atmospheric Administration. This influenced the wave patterns of the jet stream, a high-altitude band of fast-moving air, and lead to a heatwave that lasted for weeks.

Climate change will increase the frequency and intensity of extreme hot weather, making heat waves, droughts, and wildfires the “new normal”. Such events not only impact people and wildlife, but also economies. Natural disasters have significant, direct negative economic consequences, such as high property losses in developed countries and casualties in developing countries.

·       Net macroeconomic (i.e., indirect) losses are overall negative, but are likely to be small for large, developed economies, as they are better able to cope with negative production shocks (e.g., compensating for lost production with increased production elsewhere). Moreover, while destroyed capital stock affects GDP only slightly and rather in the long run (the infrastructure loss of the Ahrtal flood in Germany in July 2021 is estimated to equal 0.1% of GDP, for instance), the (mostly debt-financed) relief measures show up immediately in the GDP measurement. In statistical analyses, this also leads to the phenomenon of "productive destruction", the impression that natural disasters have (temporarily) a positive impact on economic growth.

·       The indirect economic impacts are generally more severe for low-income countries and smaller, less-diversified economies, even if international disaster and development aid leads to (short-term) increase in cash transfers.

·       However, the relationship between GDP growth and natural catastrophes is highly nonlinear for disaster intensity. For example, a disaster in the top 1 percent of the disaster index distribution might reduce the GDP growth rate by 7%, while a disaster in the top 5 percent of the distribution reduces it by only 0.5%.

·       The impact of tipping-points has been ignored in IPCC based damage projections so far, as scientific consensus on quantifying these impacts is still missing.

Figure 1: Daily 2-meter Air Temperature
Sources: Climatereanalyzer.org, Climate Change Institute, University of Maine.

Additionally, heat-affected employees reduce their working hours and experience work slowdowns and make errors. Reduced labor productivity as a result of extreme temperatures is a well-documented phenomenon. The negative effects are more pronounced in poor countries which often have higher exposure (e.g., Africa, South Asia) and vulnerability (e.g., housing quality, air conditioning). The decisive factor for productivity losses is the number of days with extreme heat (typical measure: days above 90°F/32°C). According to Foster, Smallcombe, Hodder et al., the capacity to perform physical work dips by approximately 40% when temperatures hit 90 degrees Fahrenheit. Furthermore, when temperatures soar to 100°F/38°C, the decline in productivity is even more dramatic, plummeting by two thirds. Behrer, Park,  Wagner et al, using US wealth data, claim that hotter temperature can reduce labor productivity, work hours, and labor income. They find that one additional day >32 °C (90 °F) lowers the annual payroll by 0.04%, equal to 2.1% of average weekly earnings. They also find smaller impacts of heat in regions with higher average wealth. These effects are due to a combination of reductions in labor supply, labor productivity, labor demand and an increase in firm costs. The estimates, which consider annual temperature fluctuations, account for intra-year adaptations such as inter-temporal labor substitution. This adaptation occurs when workers and companies try to compensate for productivity lost during a hot day or week by catching up during a cooler period within the same year. However, trying to explicitly quantify the effects of low temperatures on the payroll did not show significant impacts.

Using a first approximation, we estimate the impact of this year’s heatwave on GDP in the United States, Southern Europe, and China. Based on elasticities from the two academic articles above, we ran a ‘back of the envelope’ calculation of the consequences of the recent heatwaves. In all humility, this first-order estimate comes with several strong assumptions:
(i) temperature data is not final and we limited ourselves in scope to six countries; (ii) we used daily country averages instead of grid cell data; (iii) the elasticities for payroll impacts were calibrated on US county-level data, and payroll to GDP sensitivity was taken as two-thirds; and (iv) other channels of impact such as agricultural productivity were not taken into account.

Results show that China, Spain and Greece may have lost close to a point of GDP from the current heatwave, while Italy’s loss is closer to half a point, the US lost to a third of a point and that of France is negligible (0.1pp). All in all, using weights in global GDP, the heatwave’s toll is close to 0.6pp of GDP growth for 2023 which is important and highlights the burden of physical climate risk.

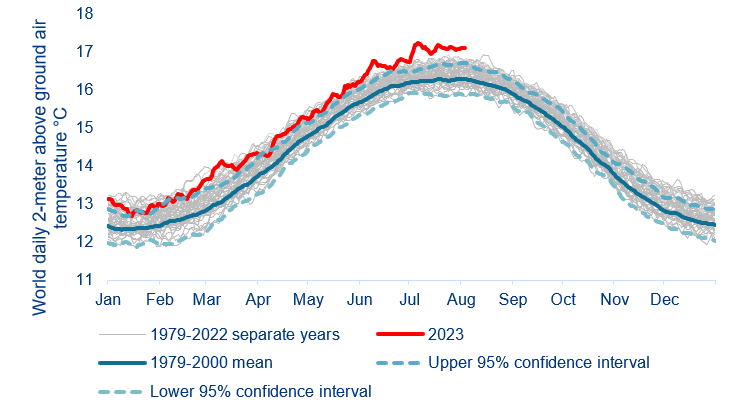
Table 1: Reductions in GDP due to the number of hot days over 32° Celsius
Sources: Visual Crossing, Behrer et al. (2021), Allianz Research
Adaptation is key: workers' conditions are influenced by societal decisions, suggesting that the productivity losses due to heat can be mitigated. Several approaches, including technological, infrastructural, regulatory, and behavioral changes, can be employed by individuals, businesses, and governments. Although the relevance of these methods depends on local contexts, many of them seem cost-effective. Strategies such as optimizing work schedules, working in early morning or evening hours and using passive cooling mechanisms are promising. Climate-aware urban planning and modifications to building design can best tackle high base temperatures, whereas air conditioning can adapt to brief temperature spikes, given adequate, affordable, reliable, and clean electricity. Popular studies tend provide a distorted picture by neither accounting for these adaptation potentials, nor for the fact that due to climate change labor productivity might see increases in winter months as well, which compensates for some of the summer losses. President Biden recently cited the USD100bn annual losses in recent years that can be attributed to a report on the economic and social consequences of extreme heat for the United States. A look at  the methodology of this report reveals exactly the mentioned bias. While the report quantifies the potential extreme heat impact in the summer to double by 2030, reaching an estimated loss of 0.5% of projected GDP, the seminal work by Heal and Park suggest a net effect over a particularly warm year in the US of GDP gains of up to 0.5% GDP. In the study we used for our calculation (Behrer, Park,  Wagner et al.), adaptation is partially factored in, as mentioned above.

Globally, heat stress is projected (by the ILO) to reduce total potential working hours worldwide by 2.2% (equivalent to 80 million full-time jobs). According to the 2022 report of the Lancet Countdown, in 2021, 470 billion potential working hours were lost—an increase of 37% from the annual average in 1990–99, and an average of 139 hours lost per person.

There is a growing possibility that upcoming summers will gradually resemble the extreme conditions witnessed just recently. Adaptation to extreme heat will only happen gradually as the effects on productivity and GDP growth are only temporary. It is not like air conditioning is a simple solution. For some, the technology is either not practical (outside workers) or simply financially unattainable. And the extensive use of air conditioning would massively increase energy consumption. This could even end up amplifying heat waves if the energy comes from fossil fuels. Besides other reasons, fast-tracking the switch to clean energy sources is thus vital.

The good news is that it is possible to prepare for heat waves, both physically and economically. Heatwaves, unlike many other natural hazards, are predictable. Adaption is key. In the short term, warning and prevention measures can be put in place. But these need to be complemented by longer-term structural adaption measures aiming at preparing cities or climate change (i.e., urban greening) and finding ways to productively adapt workplaces to increased heat burden (i.e., adapting buildings, infrastructure, and working hours).

Andreas Jobst

Allianz SE

Jasmin Gröschl

Allianz SE

Markus Zimmer
Allianz SE