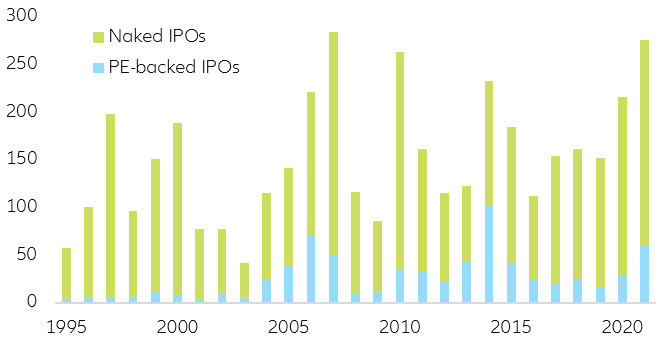
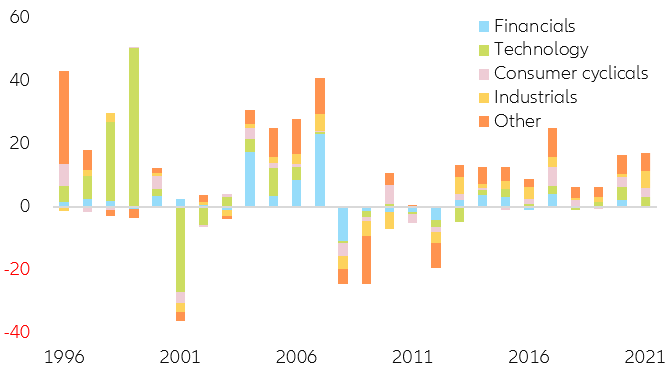
Initial Public Offering (IPO) volumes are set to hit a new record in 2021, offering investors higher return potential than traded equity, albeit with higher risk. But investing in the right IPO depends on more than just geographical location and sector. Within the first nine months of 2021, the volume of global IPOs has already exceeded the whole issuance seen in 2020, with the Americas and Asia-Pacific (excluding Central Asia) accounting for more than 75% of the total capital raised and China (29%) and the US (30%) being the main contributors. These numbers are even more impressive since they exclude the 2020-2021 SPACs (Special-Purpose Acquisition Company) market rush (Figure 1).
Figure 1: Volume of IPO proceeds (in USD bn) worldwide
Sources: Refinitiv, Allianz Research
*IPOs (live, >50 M, excluding SPACs, closed-funds, etc.)
** Naked IPOs: traditional IPOs and direct listings
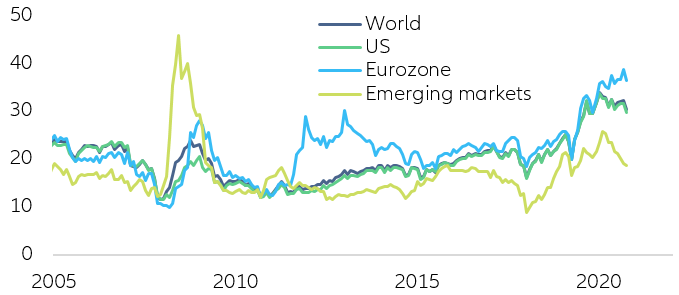
The market acceleration is hardly surprising as the ultra-high equity valuations, due to ever-increasing equity prices, create the perfect landscape for companies to go public. Most IPO-intensive equity sectors (e.g. information technology) are currently trading at 20-year high multiples, with the Eurozone having now outpaced the US and the world aggregate. At the same time, emerging markets are struggling to keep up due to diverging economic conditions and the Chinese legislative crackdown (Figure 2).
Figure 2: Equity information technology sector – 12-month trailing PE ratio
Sources: Refinitiv, MSCI, IBES, Allianz Research
This historically low-rate environment, high equity multiples, improving macroeconomic outlook and implicit central bank “whatever it takes” put protection set the stage for a continuing IPO acceleration. Nevertheless, there are some risks to keep in mind: IPO candidates tend to be particularly sensitive to changes in interest rates, given their relatively long cash flow duration (IPO candidates pay more of their cash flows in the long-term future rather than in the present), and remain extremely vulnerable to equity market volatility. Hence, if interest rates were to abruptly rise (e.g. due to a policy mistake, persisting inflation, etc.), or equity markets were to revert from the current bull run (e.g. due to exogenous factors, change in risk appetite), IPO markets would close shop extremely fast. In fact, periods of extreme negative market performance in 2000-2002 and 2008 led to a substantial shrinking of the IPO market for the next one to two years. However, we do expect equity markets to avoid a meltdown and converge towards long-term average returns. In this context, the IPO wave is far from over but should moderate in pace and size.
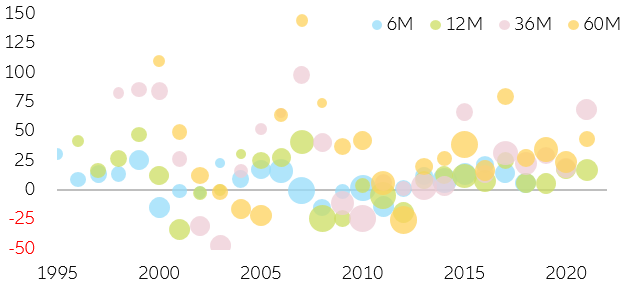
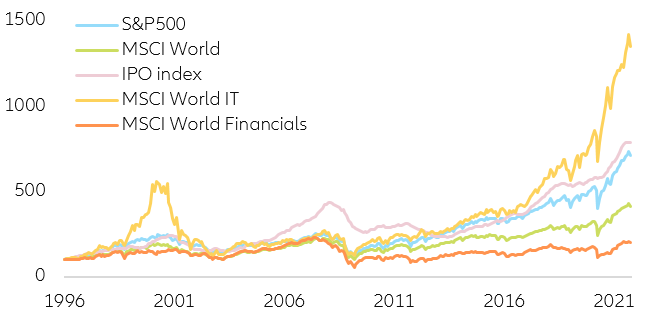
Since 1995, the global post-IPO performance has offered a return profile close to that of traded equity markets, with on average ~7.0% in the six months after the IPO, ~7.5% in 12 months, ~19.7% in 36 months and ~24.4% in 60 months (long-term average equity returns are ~6 to 7% per annum). In this regard, our proprietary IPO index shows that from 1995 to 2008, companies that went public significantly outperformed major equity market indices, though 2008 marked the beginning of a cumulative underperformance vs the S&P500 until today, translating into an overall 11.4% cumulative pick up versus the S&P500 within a period of 25 years (Figure 3 & 4).
Figure 3: Performance of global IPOs after X months (in %)
Sources: Refinitiv, Allianz Research
*IPOs (live, >50 M, excluding SPACs, closed-funds, etc.)
** Size of the balls references aggregate IPO volumes in USD
Figure 4: Global IPOs vs. world indices performance
Sources: Refinitiv, Allianz Research
*IPOs (live, >50 M, excluding SPACs, closed-funds, etc.)
**Proprietary index calculated with global IPOs, including IPOed companies since inception and for 12 months.
Because of this, it is tempting to conclude that, on an aggregate basis, IPO companies do not generate a big enough alpha or excess return vs traded equity to justify a complete shift towards an IPO-centered portfolio strategy. Of course, these results are unsurprising as financial theory clearly suggests that it is an extremely challenging task to consistently outperform the market over long periods of time.
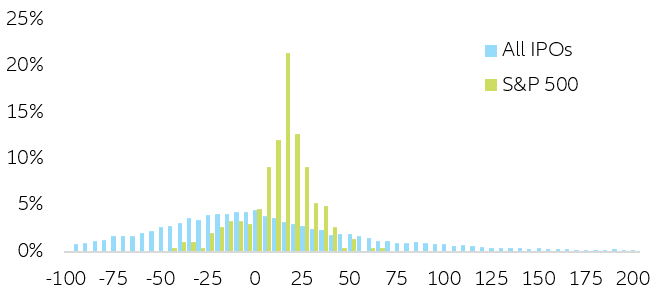
However, it would be unreasonable to remain at an aggregate level as the underlying nature of the IPO business and the relative low market “liquidity” vis-a-vis traded equity means that stock-picking is the key determinant of future returns, making it more difficult to embark on a broader passive portfolio strategy. This stock-picking bias is confirmed when comparing the return distribution of traded equity vs IPO companies, which shows that despite the average return being higher for traditional traded equity (more suitable for passive investing), the tails or extremes of the return distribution are wider and denser in the case of IPOs (Figure 5).
Figure 5: Histogram yearly returns S&P500 and IPOs
Sources: Refinitiv, Allianz Research
How can investors pick a successful IPO? The right location, sector and size do play a role, but private equity-backed IPOs are likely to outperform “naked” ones. Dissecting the IPO market further, it becomes clear that IPOs follow equity sector performance. In other words, like a dog that tries to bite its own tail, the acceleration in the relative performance of a certain sector versus the broad market tends to trigger a wave of new IPOs within the thriving sector as companies ready to go public take the window of opportunity to jump into the market. With that in mind, the rapid acceleration in tech-related IPOs before the Dotcom bubble and the acceleration in financials before the subprime crisis are a clear representation of this self-fulfilling dynamic.
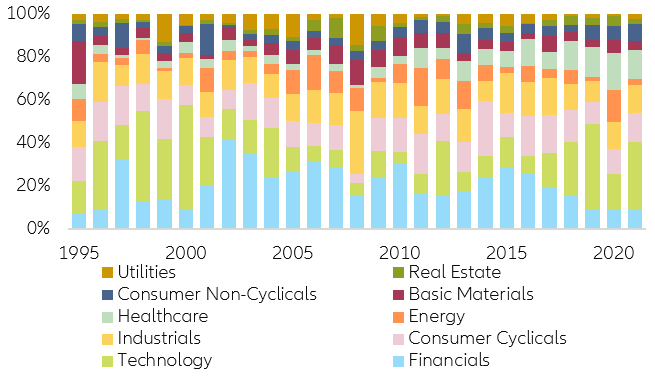
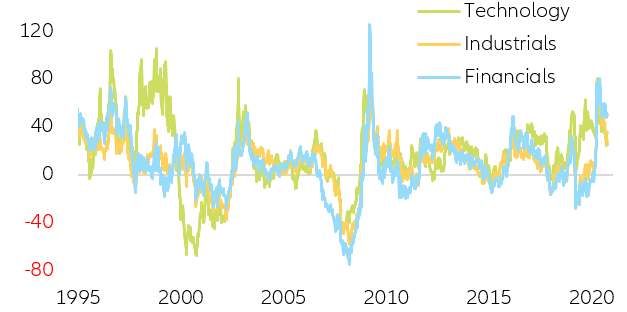
Following this principle, the Covid-19 pandemic led “stay-at-home” and health-care-related sectors to outperform (i.e., technology and healthcare) triggering an IPO acceleration within those specific sectors. However, current market dynamics suggest that the recent acceleration is unlikely to continue for much longer, leading to a slow and steady reversal to long-term average returns and issuance levels. As a result, we expect pro-cyclical IPO markets to decelerate and pave the way for more traditional/defensive sector IPOs. In this consolidating phase, it is noteworthy that non-IPO-intensive sectors tend to thrive in market consolidating environments, with industrials, materials and energy showing resilience (Figures 6 & 7).
Figure 6: IPO sector distribution (% of total capital raised)
Sources: Refinitiv, Allianz Research
*IPOs (live, >50 M, excluding SPACs, closed-funds, etc.)
Figure 7: US equity sector performance(y/y%)
Sources: Refinitiv, Allianz Research
Undoubtedly, if selecting the right IPO was an easy task it would no longer generate interesting returns as every participant would, immediately, jump into the market (“A strategy that becomes common knowledge can no longer be considered a strategy”). But by treating IPOs as a tactical investment (investment horizon of 12 months) and breaking down the IPO by location, sector, type, and size, there are some interesting commonalities among successful IPOs.
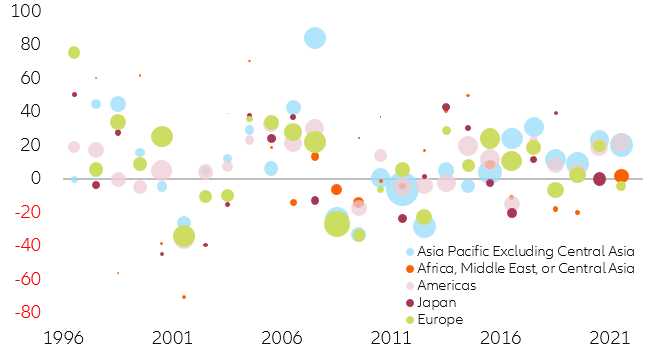
With regard to location, there are three clearly identifiable subgroups. African and Middle Eastern IPOs have averaged -0.5% return in the 12 months after going public, with relatively low volumes. In contrast, Asia (excluding Central Asia) (+9.4% y/y), Europe (+6.6%) and the Americas (+4.6%) have posted returns close to those of traded equity. Interestingly, Japan (+22.5%) became an outlier due to outperformance during the dotcom bubble (Figure 8).
Figure 8: 12-month IPO returns per region (in %)
Sources: Refinitiv, Allianz Research
*IPOs (live, >50 M, excluding SPACs, closed-funds, etc.)
**y-axis capped at 100%
China (+11.4% y/y), South Korea (+14.0%), Germany (+7.3 %) and the US (+5.4%) also outperformed their respective equity indices, while the UK (+2.4%) and Brazil (+1.5%) underperformed their respective local markets. With these results in mind, it becomes clear that there are certain markets that tend to be more favorable for companies going public.
Looking at sectors, we find a clear market pro-cyclicality of the IPO business. In the years prior to the dotcom bubble (2000-2001) the technology sector was responsible for more than 90% of the overall IPO performance, becoming the drag right after the crash. Similarly, financials had a relatively high importance in the years prior to the 2008 Great Financial Crisis crash. Despite this clear pro-cyclicality, the recent IPO performance is different as it cannot be attributed to a single sector but rather to the whole market. This hints to a healthier and more structural market over-performance rather than a one-time single sector acceleration (Figure 9). This unusual behavior seems consistent with the broad equity rally experienced since the initial March 2020 market sell-off.
Figure 9: Sector contribution to 12-month IPO returns
Sources: Refinitiv, Allianz Research
*IPOs (live, >50 M, excluding SPACs, closed-funds, etc.)
But having chosen the right location and sector does not guarantee an easy homerun. As in any stock-picking strategy, the difficulty comes from understanding the differentiating factor that leads certain companies to market success (better corporate culture, better client base, better market positioning, disruptive technology etc.). This triage requires an extremely high level of experience and expertise for consistent success. In this regard, an IPO that is backed by a private equity firm should, in principle, outperform its non-PE backed counterparts as lots of research and scouting have gone into the investment decision well before the IPO phase.
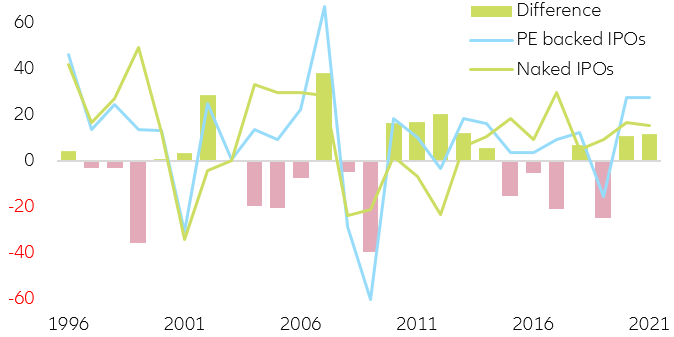
On this matter, data shows that PE-backed IPOs have indeed outperformed traditional IPOs by as much as 5.2% in the 12 months after the IPO, especially during periods of market consolidation. Thus, it can be inferred that PE-backed IPOs tend to outperform their “naked” peers (traditional IPOs + direct listings) in periods of market stability and consolidation while they tend to underperform in market selloffs due to concentration risk (Figure 10).
Figure 10: Average 12-month returns for PE-backed vs. naked IPOs (in %)
Sources: Refinitiv, Allianz Research
*IPOs (live, >50 M, excluding SPACs, closed-funds, etc.)
** Naked-IPO: IPO without any backing (traditional IPOs + Direct listings)
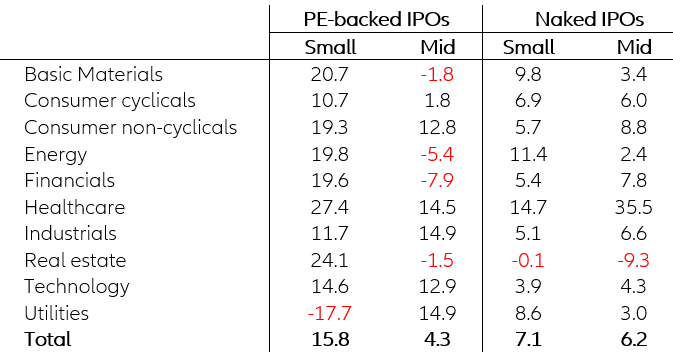
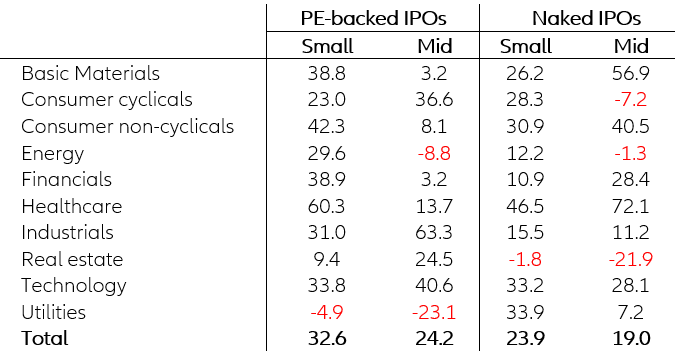
Even with the right backer, size matters. While IPOs on average tend to yield ~6 to 7% in yearly returns irrespective of their size, there are significant differences between PE-backed and naked IPOs when it comes to size-adjusted returns. Private equity-backed companies seem to have the upper hand within the small-cap environment (USD50mn-500mn), with an excess return over Naked IPOs close to 8%. At the same time, PE-backed IPOs seem to underperform within the mid-cap business (USD500mn-2000mn), with naked IPOs generating a ~2% excess return (Table 1).
However, diving deeper into the sector performance, we find that PE-backed companies seem to substantially outperform naked IPOs within technology, consumer non-cyclicals, real estate, and small-cap financials, sectors that also gather the biggest IPO volumes.
Table 1: 12-month returns of PE-backed IPOs vs. naked IPOs (in pp)
Sources: Refinitiv, Allianz Research
*IPOs (live, >50 M, excluding SPACs, closed-funds, etc.)
**Small-cap companies (USD50mn-500mn), mid-cap (USD500mn-2000mn)
*** Big companies (>USD2bn) have been ignored due to the low participation of PE companies in that size bucket
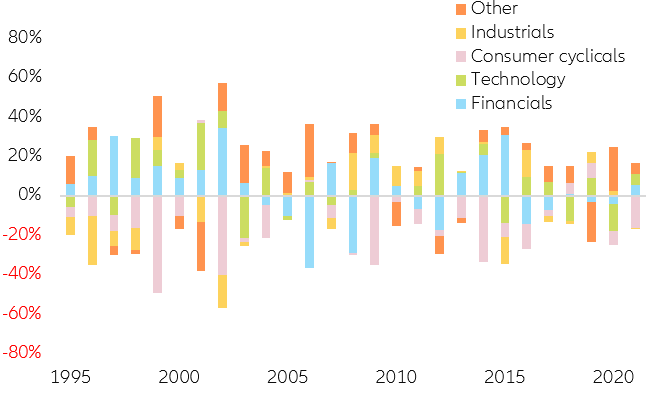
What explains the substantial return divergence between naked-IPOs and PE-backed IPOs on an aggregate basis? The key lies in the fact that PE companies do not fully follow the aggregate IPO market behavior with their careful company selectivity leading to substantial differences in sector allocation. For example, PE companies refrained from overweighting financials in 2006 and 2008 while doing so in 2014 and 2015. Similarly, PE companies did not follow the 2020 technology trend while they are, on average, overweighting the sector in 2021. All in all, being pickier in the asset selection process seems to add some quantitative and qualitative overlay to the investment process that helps differentiate successful from unsuccessful tactical IPO investments (Figure 11).
Figure 11: Active weights of PE-backed IPOs vs. naked IPOs
Sources: Refinitiv, Allianz Research
*IPOs (live, >50 M, excluding SPACs, closed-funds, etc.)
**Active weights: difference between PE-backed and Naked IPOs weights
Results from a more strategic perspective (~five-year investment horizon) also seem to confirm the value of investing in IPOs alongside PE companies and choosing the right location and sector (Table 2).
Table 2: 60-month returns of PE-backed IPOs vs. naked IPOs (in pp)
Sources: Refinitiv, Allianz Research
*IPOs (live, >50 M, excluding SPACs, closed-funds, etc.)
**Small-cap companies (USD50mn-500mn), mid-cap (USD500mn-2000mn)
Why are PE and IPO investing interesting for an institutional investor? Institutional investors’ growing interest in PE and IPOs as an asset class is mostly driven by financial reasons, given their outperformance as well as the opportunity for the diversification and risk mitigation of a portfolio.
However, there are strategic benefits that investors can leverage from PE investments as well. While traditionally institutional investors had a passive role in PE investments, hands-on approaches have recently been developed. Hence, institutional investors have started taking on an active role in working with portfolio companies, which has brought additional benefits on top of financial returns. Strategically, PE investments can support driving an institutional investor’s own competitiveness. Fostering knowledge exchange and working together with successful entrepreneurs as well as doing joint business development in adjacent areas, institutional investors can derive strategical benefits by having access to the most innovative sectors of the economy.
On top of this, PE investments can benefit institutional investors’ own business in particular through access to an entrepreneurial and innovative culture and capabilities as well as leveraging new and established clients from both parties. Lastly, institutional investors can access emergent business areas with option-like upsides, e.g., through opportunities in strategic whitespaces. In general, institutional investors should become more actively involved to secure their long-term competitiveness by partnering and investing in high-growth PE companies to leverage their technology and catchup on the latest innovation (e.g. Facebook’s acquisition of Instagram and WhatsApp).
For institutional investors, the appetite in public markets is mainly driven by a potential discount on the share price at the time of the IPO. After the IPO window has passed, stocks of promising companies may skyrocket, making it difficult to invest. Additionally, later-stage and growth companies are looking for investors who are interested in crossover investments. Hence, institutional investors investing in PE as well as IPOs have become a frequent occurrence in the market, putting high pressure on participants investing in both spaces.
Authors

Senior Investment Expert

Senior Manager Platforms & Acquisitions

Research Assistant