The SPAC party isn’t over yet, but don’t wait up for another phase of record high offerings as seen in 2020 and Q1 2021 — at least in the US. After hitting record highs in both volume and number, and becoming the preferred path over Initial Public Offerings , SPAC (Special Purpose Acquisition Companies) offerings came to a virtual halt in Q2 2021. Only 41 new SPAC IPOs came to the market in Q2 2021, compared to 283 in Q1 2021, amounting to ~USD91bn of proceeds (Figure 1).

Figure 1: SPACs vs IPOs (in USD bn)
Sources: Bloomberg, Allianz Research    *IPOs (>50 M, excluding SPACs, closed-funds, etc.)
Besides changing investor appetite, this trend reversal can also partly be explained by the ever-increasing scrutiny from regulatory bodies (e.g. the US Securities and Exchange Commission ). In March 2021, the SEC issued several statements expressing concerns over the reporting, accounting, and governance of SPACs. These reports were followed by additional warnings in Q2 2021, focusing on the accounting treatment of SPAC warrants. Most recently, the SEC sued a SPAC for “allegedly” misleading investors.

In addition, the early 2021 increase in long-term interest rates added further pressure to SPAC valuations. This is particularly the case as de-SPAC transactions  tend to target early-stage businesses with high growth, meaning they tend to have “long duration” cash flow profiles. In this regard, active SPACs have even “longer duration” because they have not yet purchased a business, meaning that the future cash flows are virtually 0 until a proper target is found. All in all, the underlying nature of SPACs makes them “long” and even “ultra-long” duration, which in a period of stable but mildly increasing interest rates looks rather counterproductive.

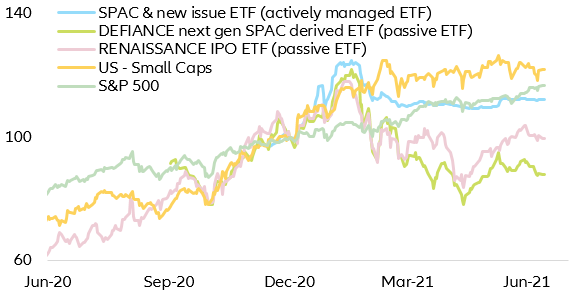
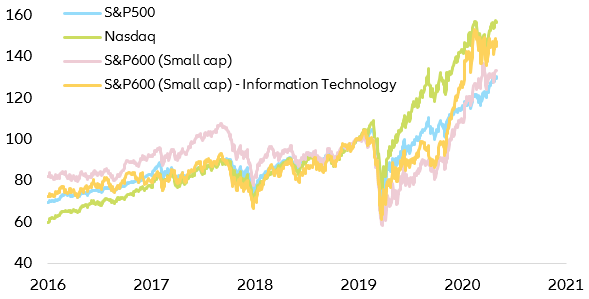
All these mounting headwinds for the industry translated into an abrupt market rotation, with the S&P500 outperforming by as much as ~29% (+16.7% S&P500 vs -12.2% US SPAC ETF) the US traded SPAC markets and by ~17% the IPO Index (+16.7% S&P500 vs -0.3% US IPO ETF). This abrupt change in investor’s appetite has left more than half of US traded SPACs trading at a discount. Overall, this structural underperformance does not imply that there is no value in SPACs as the SPAC & New Issue ETF (an actively managed fund combining SPAC and IPOs in the last 12 months) has seen +12% return in 2021, representing a ~-5% underperformance vis a vis the S&P500. This signals that through active management and careful asset selection, one can still get an interesting return enhancer even in times of a market meltdown (Figure 2).

Figure 2: US SPAC & IPO EQ Indices vs S&P500
 Figure 2: US SPAC & IPO EQ Indices vs S&P500
Sources: Refinitiv, Allianz Research
Looking ahead, we believe that the SPAC capital-raising business is here to stay but we do not believe it will keep growing at 2020 and Q1 2021 rates, at least in the US. Instead, we expect it to stabilize at much lower volumes, mainly because of an increasing mismatch between supply and demand. We remain doubtful that there will be enough private companies willing to go public after the current market frothiness starts dissipating and interest rates restart their slowly but steady rising path, leaving big chunks of floating capital without a target. This will, in turn, force some SPACs to liquidate before merger (Figure 3).

Figure 3: SPAC market
 Figure 3: SPAC market
Sources: Refinitiv, Allianz Research
But the slowdown is not a bad thing. A slow but steady reversal to fundamentals and a decent clean-up of the SPAC universe should allow for some market consolidation and for both PE and mid- to long-term SPAC investors to enter into companies at decent valuations rather than at current ultra-expensive levels.

In this context, some sectors are set to remain far more vulnerable than others when it comes to SPACs and de-SPACs. This is specially the case as the increasing number of tech- and fintech-driven SPACs (around ~40% of traded SPACs are currently targeting these sectors) is driving the sector to bubble-like behavior and, in turn, increasing the technology equity sector concentration risk (Figure 4). Of course, this is not only due to SPACs: The already heavy portion of the technology sector in broad US equity indices (~25%) paired with the extremely exuberant earnings expectations is adding to the sector’s fragility, leaving the whole market at and unstable equilibrium point (Figure 5).

Figure 4: US equity market concentration risk
Sources: Refinitiv, Allianz Research; The lower the entropy the higher the concentration risk
Figure 5: US info tech EPS growth expectations (in %)
Sources: IBES, Refinitiv, Allianz Research
So are SPACs still a good investment? With an extremely heterogeneous market, the size, sector, sponsor and management of the SPAC are key for future returns. As in the case of IPOs, the performance of traded SPACs is subject to market timing risk, meaning that sponsors of a SPAC have to rightly time the SPAC IPO in order to have two years of equity market stability or frothiness so that the acquisition power of the SPAC is not jeopardized. In this regard, the combination of relatively stable but positive equity market performance (~5-6% yearly) with a period of low long-term interest rates seems to be the perfect ecosystem for SPACs to thrive.

Moving to the extremes of the return distribution, that is to say, periods of high market volatility, also tend to heavily impact traded SPAC performance both in a positive and negative way. Because of that, the recent equity bull run paired with the increasing appetite of small private companies to go public has set the stage for a remarkable SPAC performance, with an average return of 5 to 10% in the six months after the SPAC IPO . Nonetheless, and despite the decent return, the variance around SPAC performance is striking, adding to the case for a careful asset/management selection (Figure 6 & 7).

Figure 6: Performance of traded SPAC after IPO (in %)
Sources: Refinitiv, Allianz Research
Figure 7: US equity performance (100 = 31.12.201)
Sources: Refinitiv, Allianz Research
But not everything is momentum! A significant chunk of this positive performance is also due to the sector targeting of traded SPACs towards technology & fintech sectors. Of course, this does not come as a surprise as those sectors tend to historically dominate the IPO market and have experienced the biggest inflows since March 2020, outperforming all other sectors (Figure 8).

Figure 8: SPAC target sectors
 Figure 8: SPAC target sectors
Sources: Refinitiv, Allianz Research
What return should an investor expect from tactically investing in a SPAC? Looking at the average return from holding SPAC units from IPO until merger, the expected return hovers around ~5 to 15%, resembling the expected return for small cap equity markets. Consequently, one could infer that investing in SPACs during the “search” period does not bring a real benefit when compared to equities. More so as the failure to find a decent target paired with the possibility of suffering exacerbated price corrections due to early redemptions and speculative trading by opportunistic investors may pose more downside than upside risks.

Contrary to this “at par” and even negatively skewed performance throughout the life of the SPAC, the last month before the merger is extremely interesting. During this period, successful SPACs that have managed or are about to find a decent merger candidate (well considered by market participants) generate lots of expectations, thus thriving and outperforming the broader equity market by generating decent double-digit returns right before the merger (Figure 9).

Figure 9: SPAC last one-month pre-merger performance (in %)
Sources: Refinitiv, Allianz Research
It all sounds good, but how does an investor know when to enter the market? As always, timing is an extremely difficult issue and if somebody knew the answer then they would most probably never share it. Nonetheless, the time between a SPAC’s IPO and merger has become shorter of late and is extremely interlinked with market conditions. This means that in periods of market frothiness and high valuations, the time to de-SPAC is shorter while it is longer in periods of market stability and downward-trending markets. Having said that, it currently takes between one and six months for a SPAC to find a target (Figure 10).

Figure 10: # of days from SPAC IPO until de-SPAC (in days)
Sources: Refinitiv, Allianz Research
Because of this, one could argue that if the interested investor has done proper research and is convinced about the capacity of the SPAC managers to find a decent candidate while being able to withstand equity-like volatility in the portfolio, the earlier one enters the SPAC the better!

What happens after De-SPACing?
As in the case for traditional IPOs, the initial IPO fever quickly dissipates as soon as investors lock in tactical gains and exit their long-standing positions. Because of this, the average performance of the freshly traded company tends to have a negative bias (0 to -10%) three months after the merger is completed (Figure 11).

Figure 11: Three-month post-merger performance (in %)
Sources: Refinitiv, Allianz Research
This initial market sell-off by tactical and speculative investors sets the stage for value investors to start cherry-picking their strategic investments based on fundamentals and long-term growth perspectives.  Because of this, the return dispersion between newly traded stocks increases, making stock-picking and asset selection the key determinant of future returns. In this regard, successful companies will tend to outperform the market both from a tactical and strategic perspective, leaving mid- to long-term investors with decent upside potential probabilities (Figure 12).

Figure 12: 12-month post-merger performance (in %)
Sources: Refinitiv, Allianz Research
Overall SPACs offer a good risk-adjusted return and may prove more resilient than outright small cap equity in periods of extreme market volatility, provided the SPAC market is somewhat “clean”. In this regard, the US SPAC market seems to be quite overflooded with fresh SPAC capital (accounting for 90% of SPAC IPO volumes). Thus, looking at other geographies may prove more appealing (Europe and Asia) (Figure 13).

Figure 13: SPAC market (# of SPACs)
Sources: Refinitiv, Allianz Research

From a broad sector perspective, the tech and fintech sector should be avoided due to the extreme market competition for a profitable deal and the underlying ultra-high equity valuations. Nonetheless, and if the investor manages to select the right SPAC/SPAC manager (a manager with the right background, expertise, and network), both short- and long-term returns may prove extremely appealing. Consequently, as in the case of private equity investments, the investor capability to select the right SPAC and the right market environment will be the key determinant of the success of the investment. All in all, SPACs are like PE investments: if you choose right you will be extremely profitable, but if you choose the wrong one you may lose a great part of your initial investment (Table 1 & Figure 14).

Table 1: SPAC pros & cons

Table 1: SPAC pros & cons
Source: Allianz Research
Figure 14: SPAC SWOT analysis
Source: Allianz Research