Covid-19 will upend the old pecking order in the global economy – and in climate policy. China is not only leading the economic recovery post-Covid-19 but also seems to be shifting from laggard to leader in climate policy, with President Xi Jinping’s pledge for net-zero emissions by 2060. The EU, too, raised its climate targets significantly in the framework of its “Green Deal” and underpinned them with its bold EU Recovery Fund. As for the U.S., the upcoming elections could be a turning point when it comes to climate leadership.

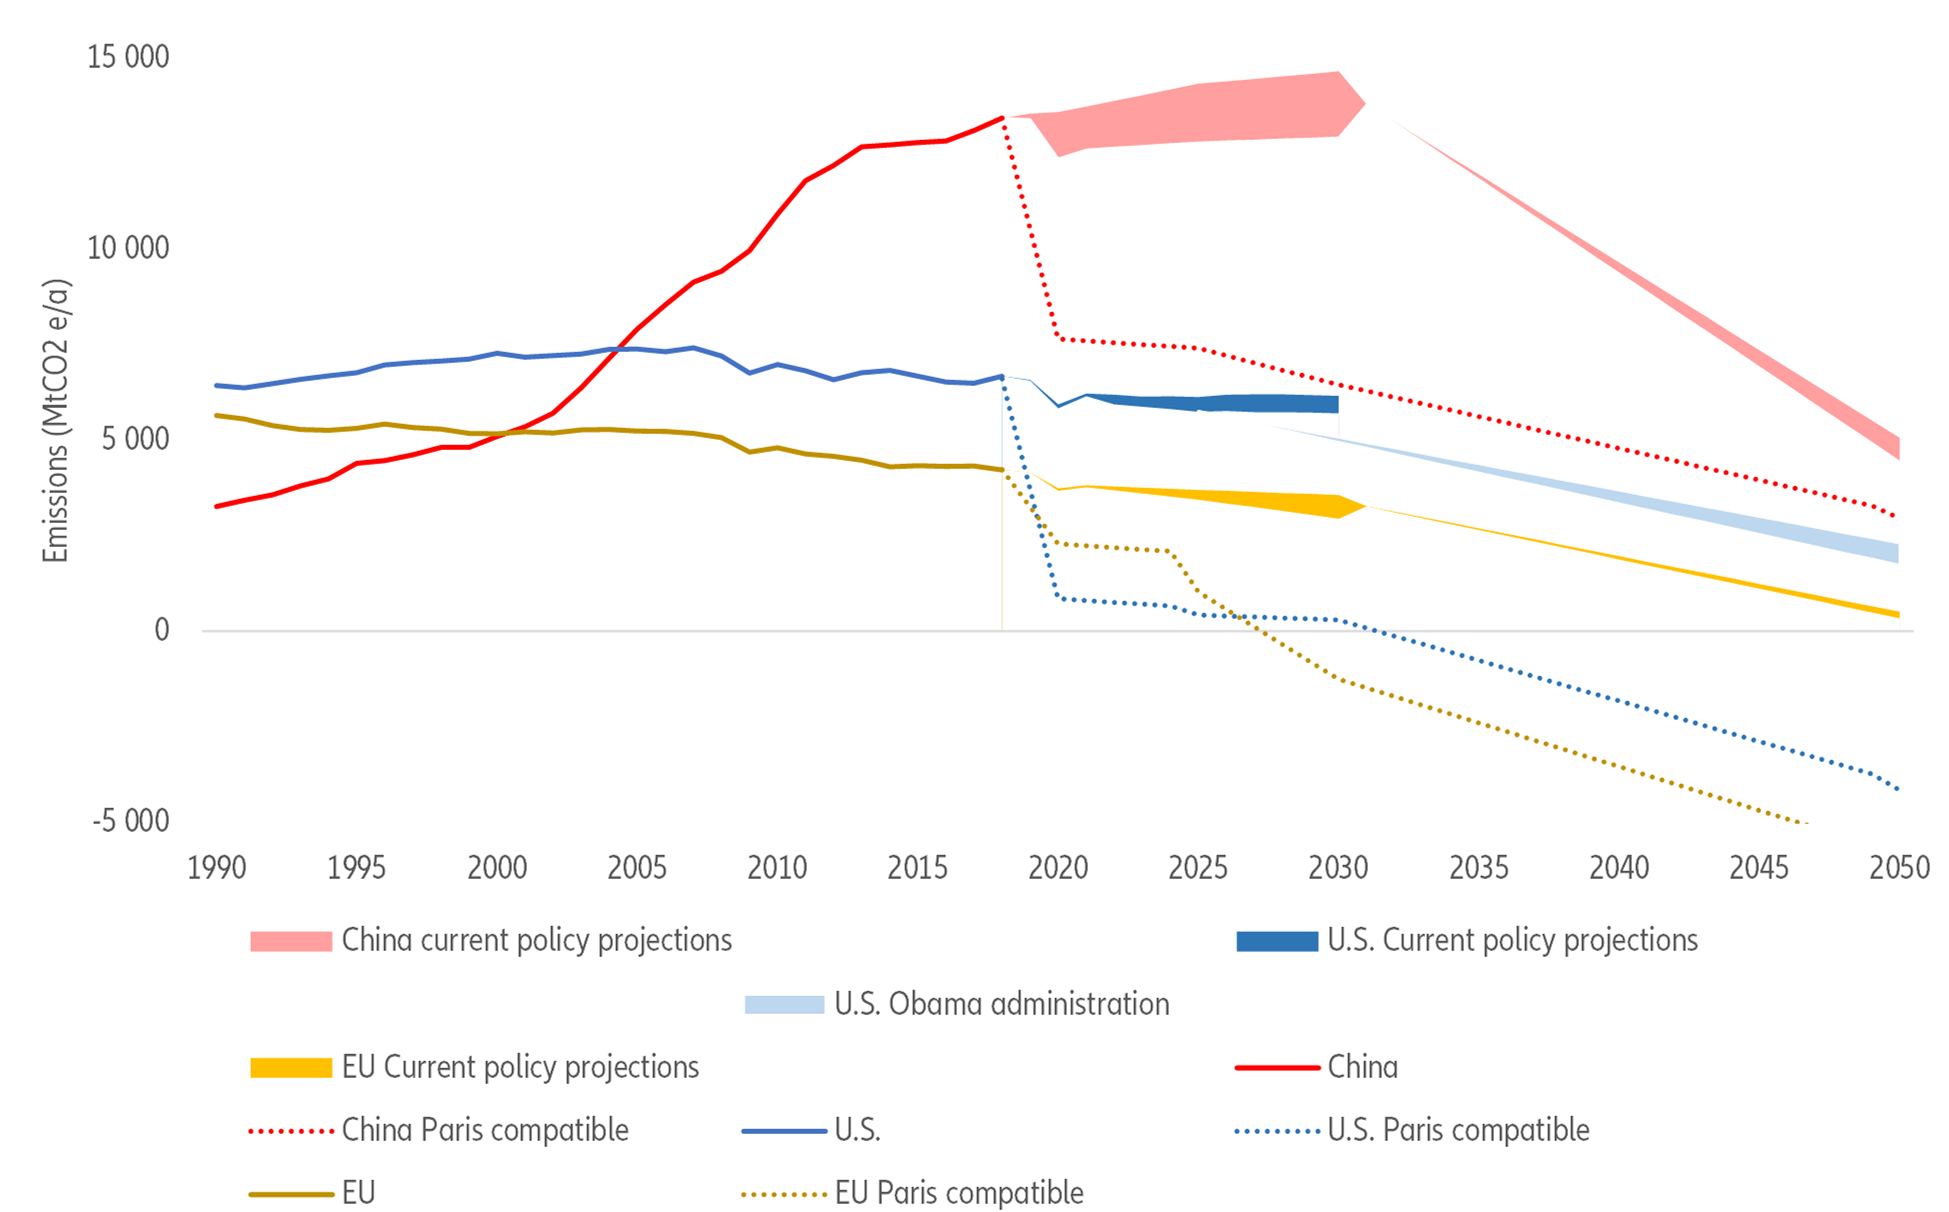
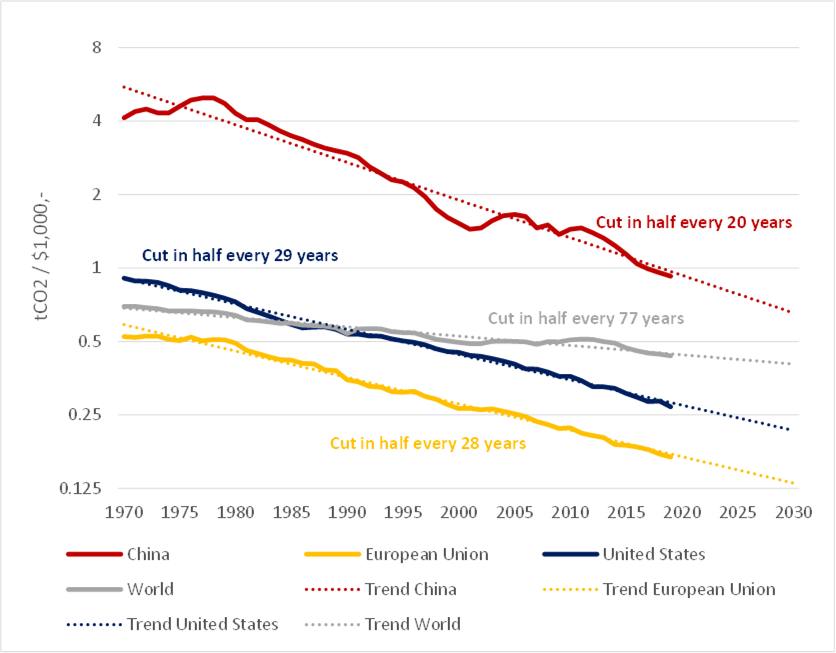
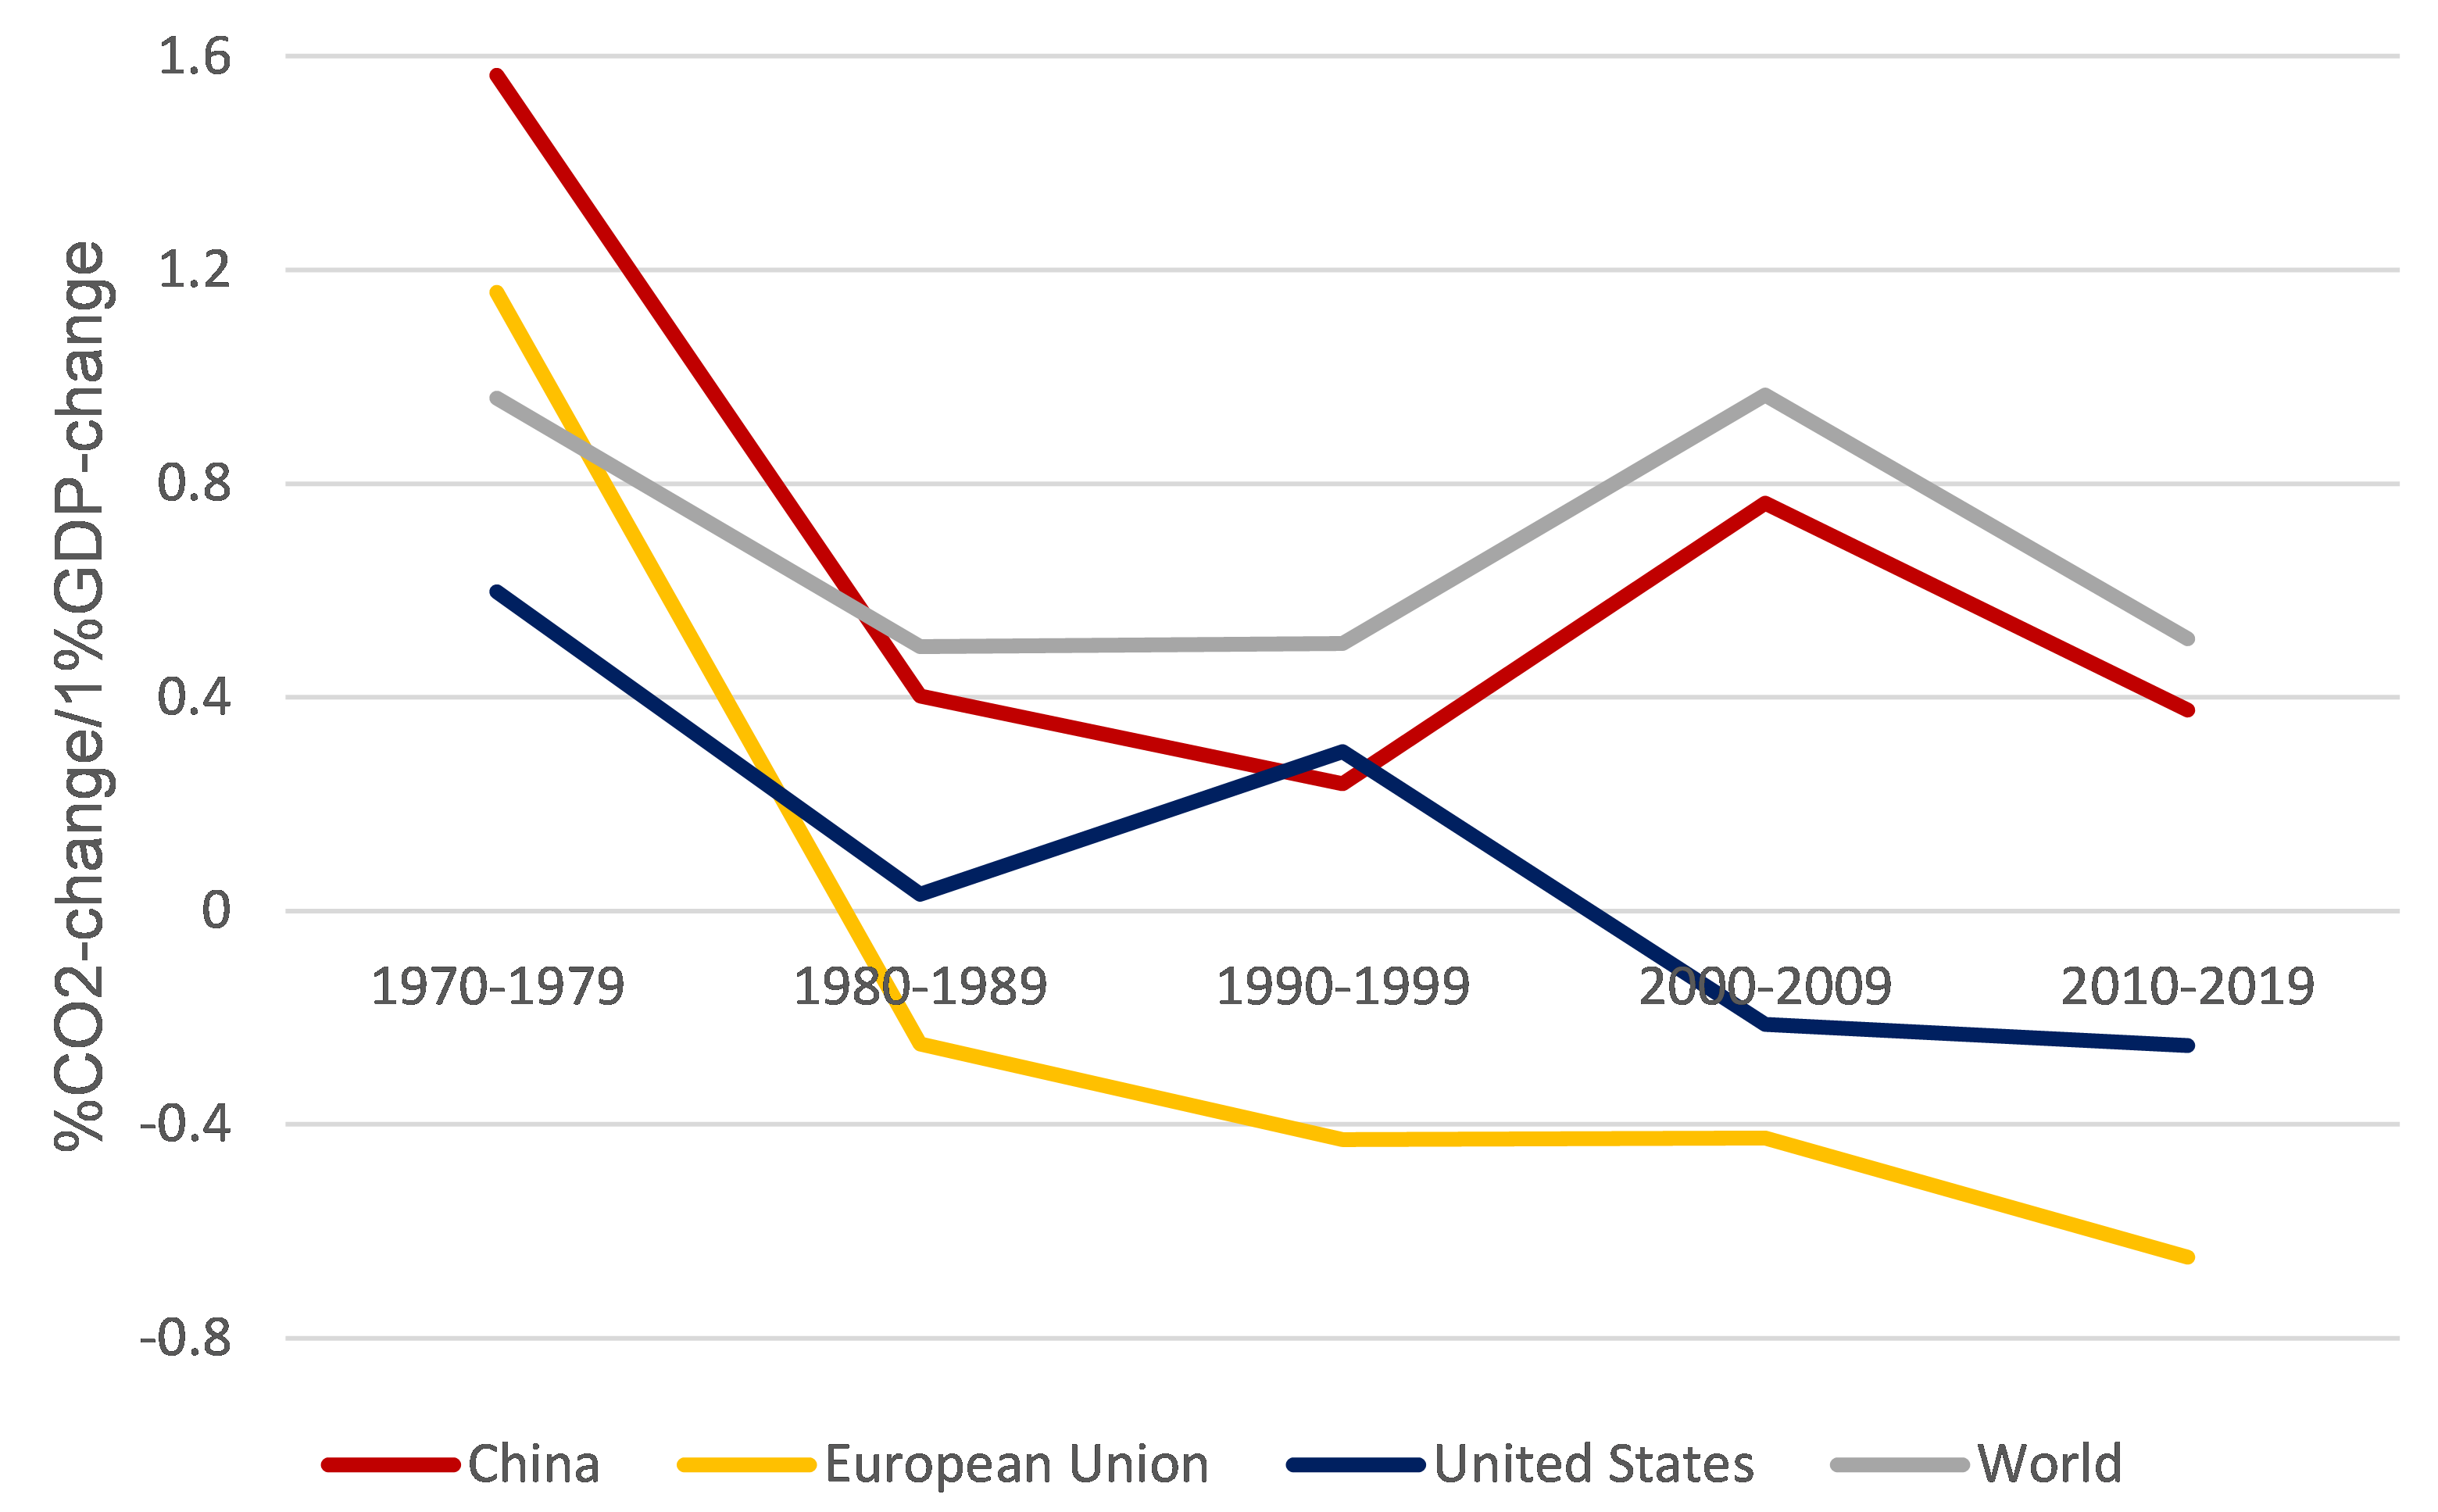
This gearing up of climate policy is welcome – and overdue. Decoupling economic growth from emissions growth isn’t enough.
Based on today’s policies, the EU, China and the U.S.’s emissions combined will grow to 23.6 billion tonnes of CO2 in 2030, far above the 5.5 billion tonnes that would be compliant with Paris Climate Agreement goals. Their combined shortfall of 18.1 billion tonnes of emission reductions is equal to 50% of 2018 global emissions. Emission intensity as measured by CO2 emissions per dollar of GDP has been cut in half every 20 years in China, every 29 years in the U.S. and every 28 years in the EU. Our analysis reveals that this trend has been astonishingly robust for the past 50 years. Following these trends, zero emissions will never be reached.
 
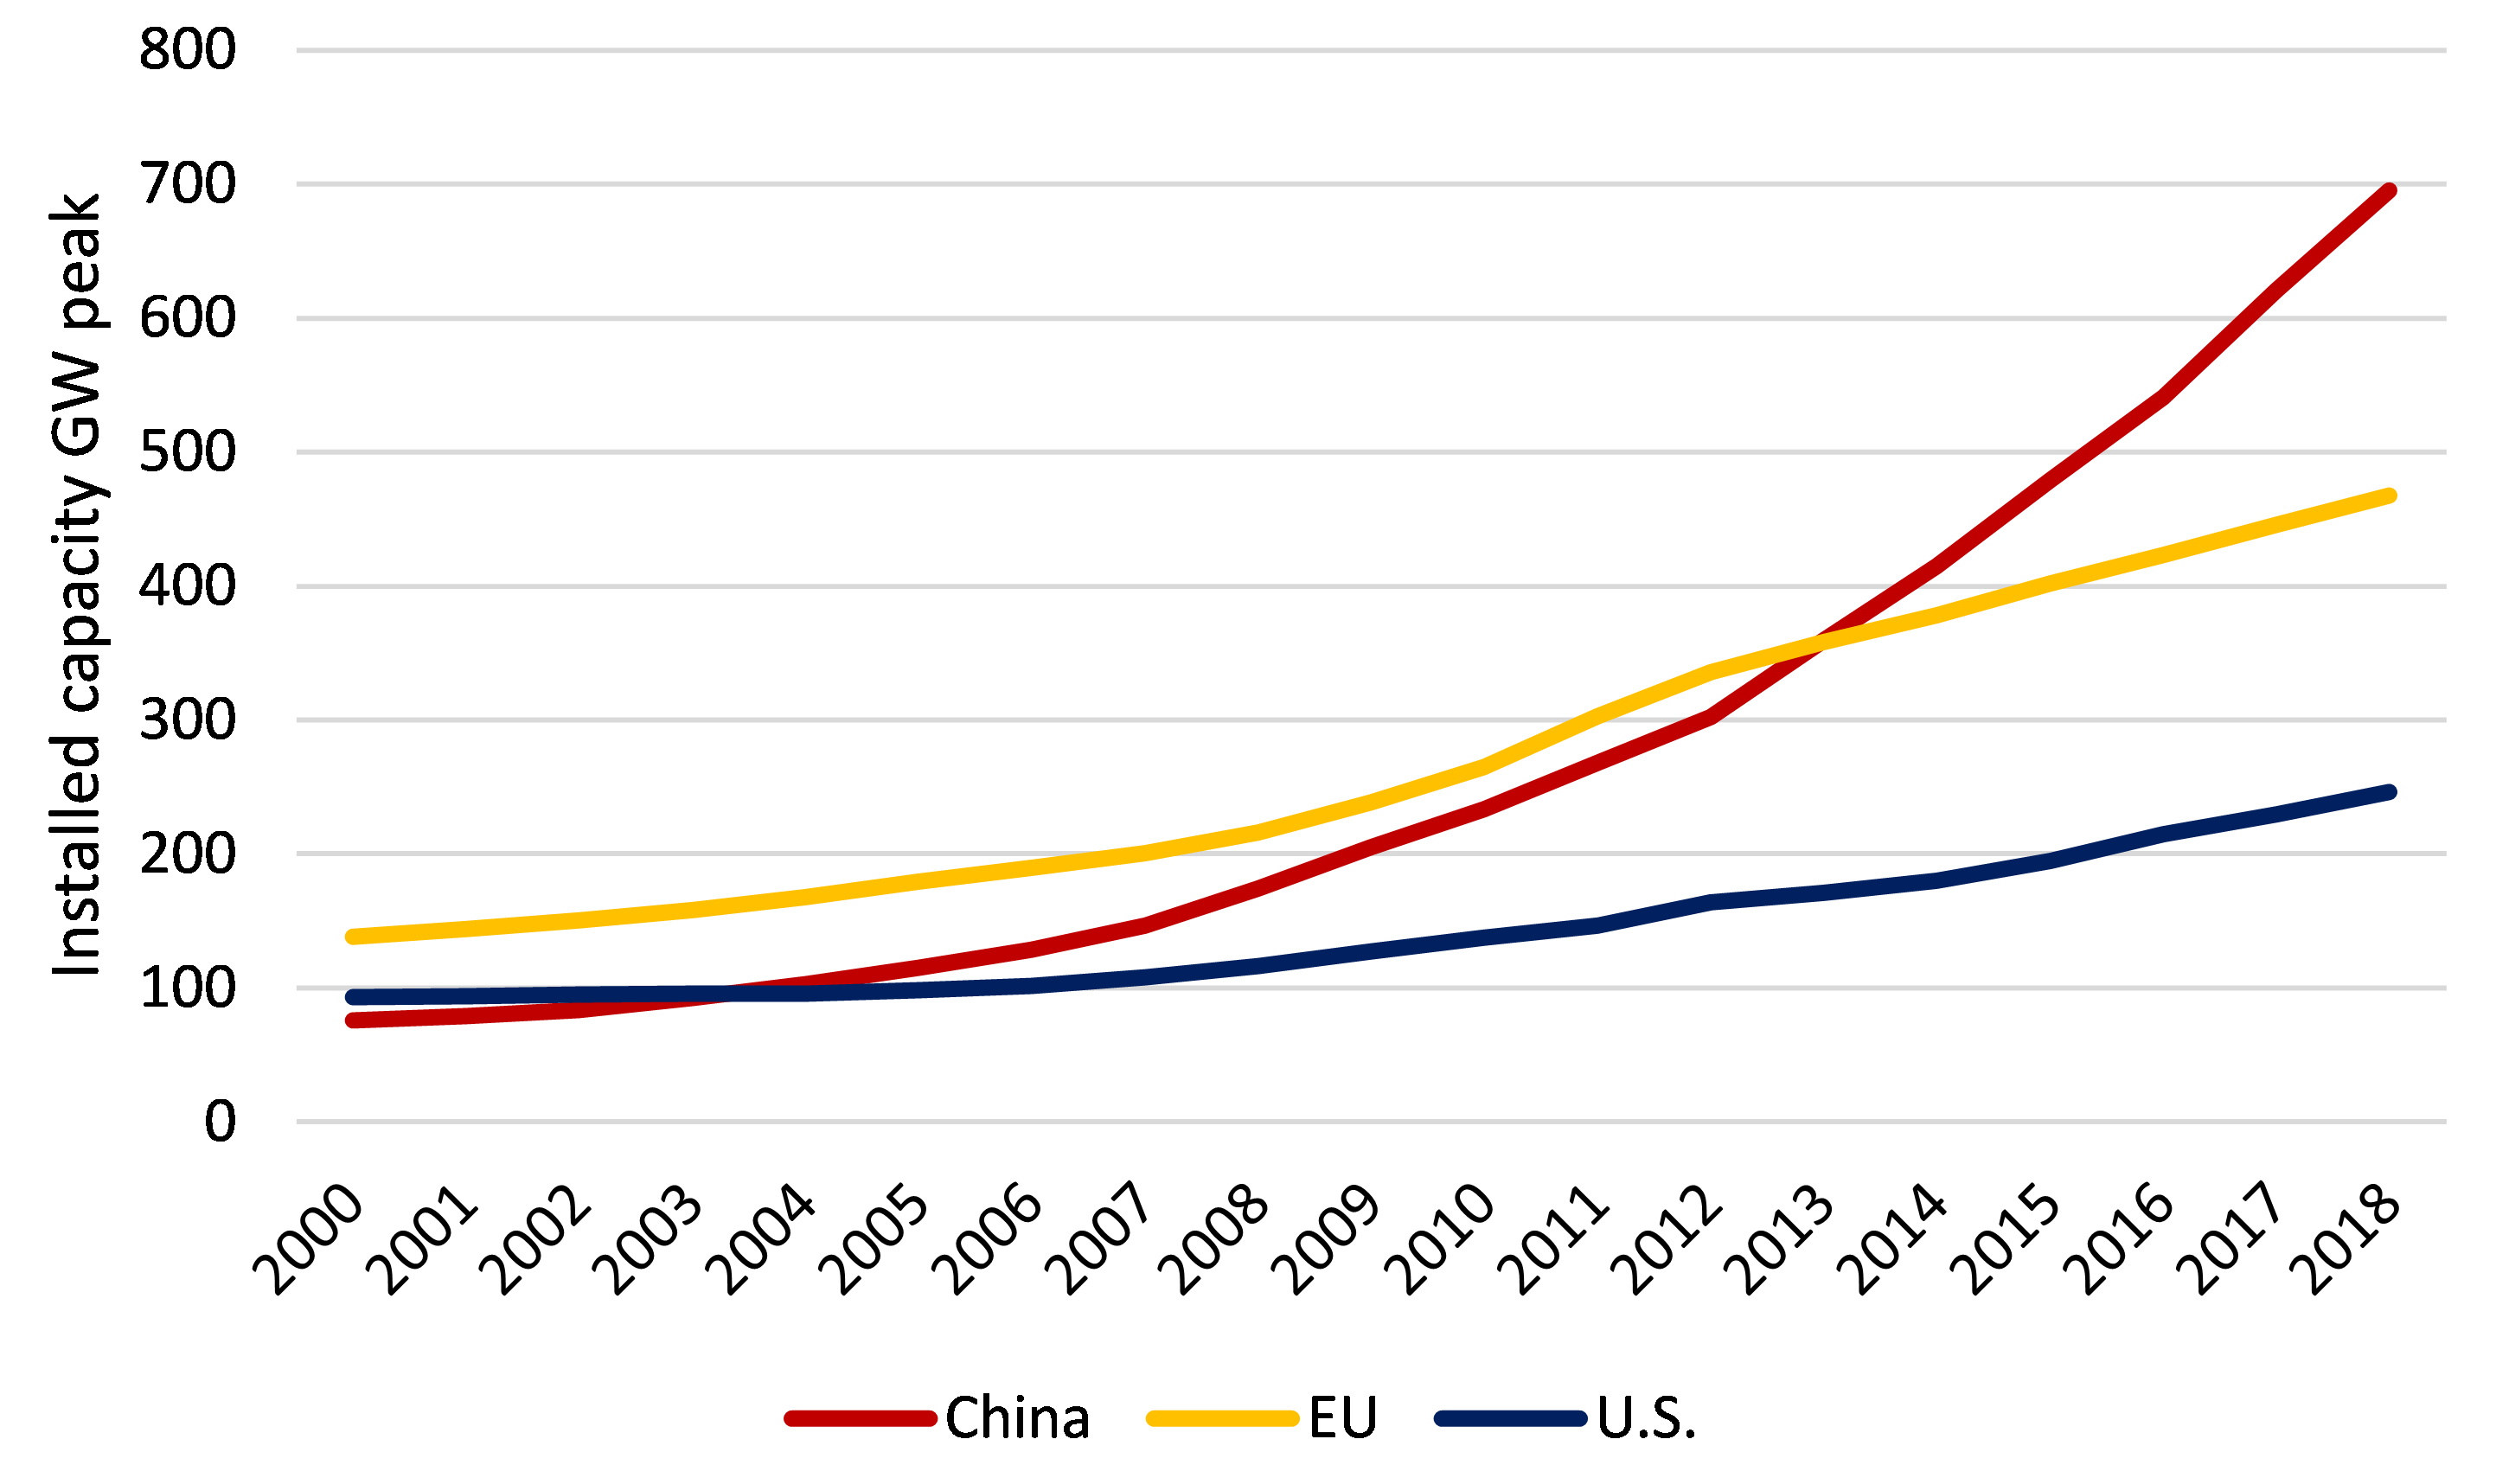
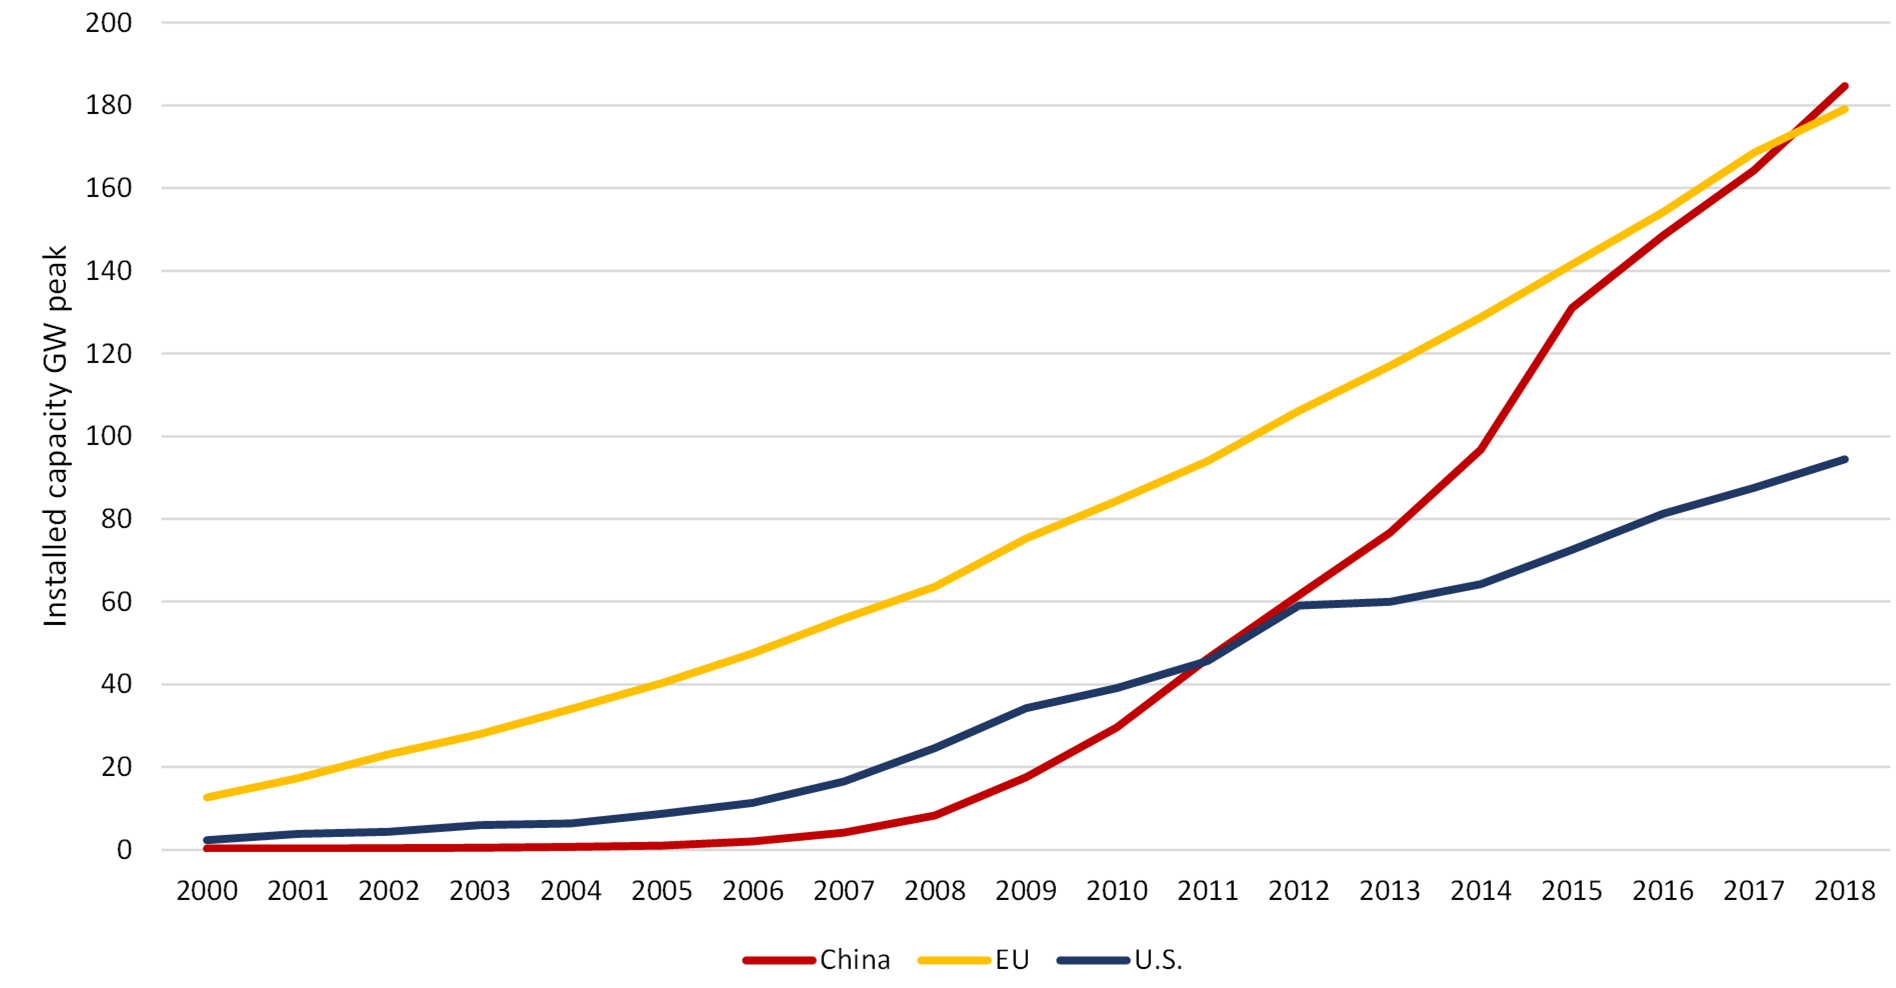
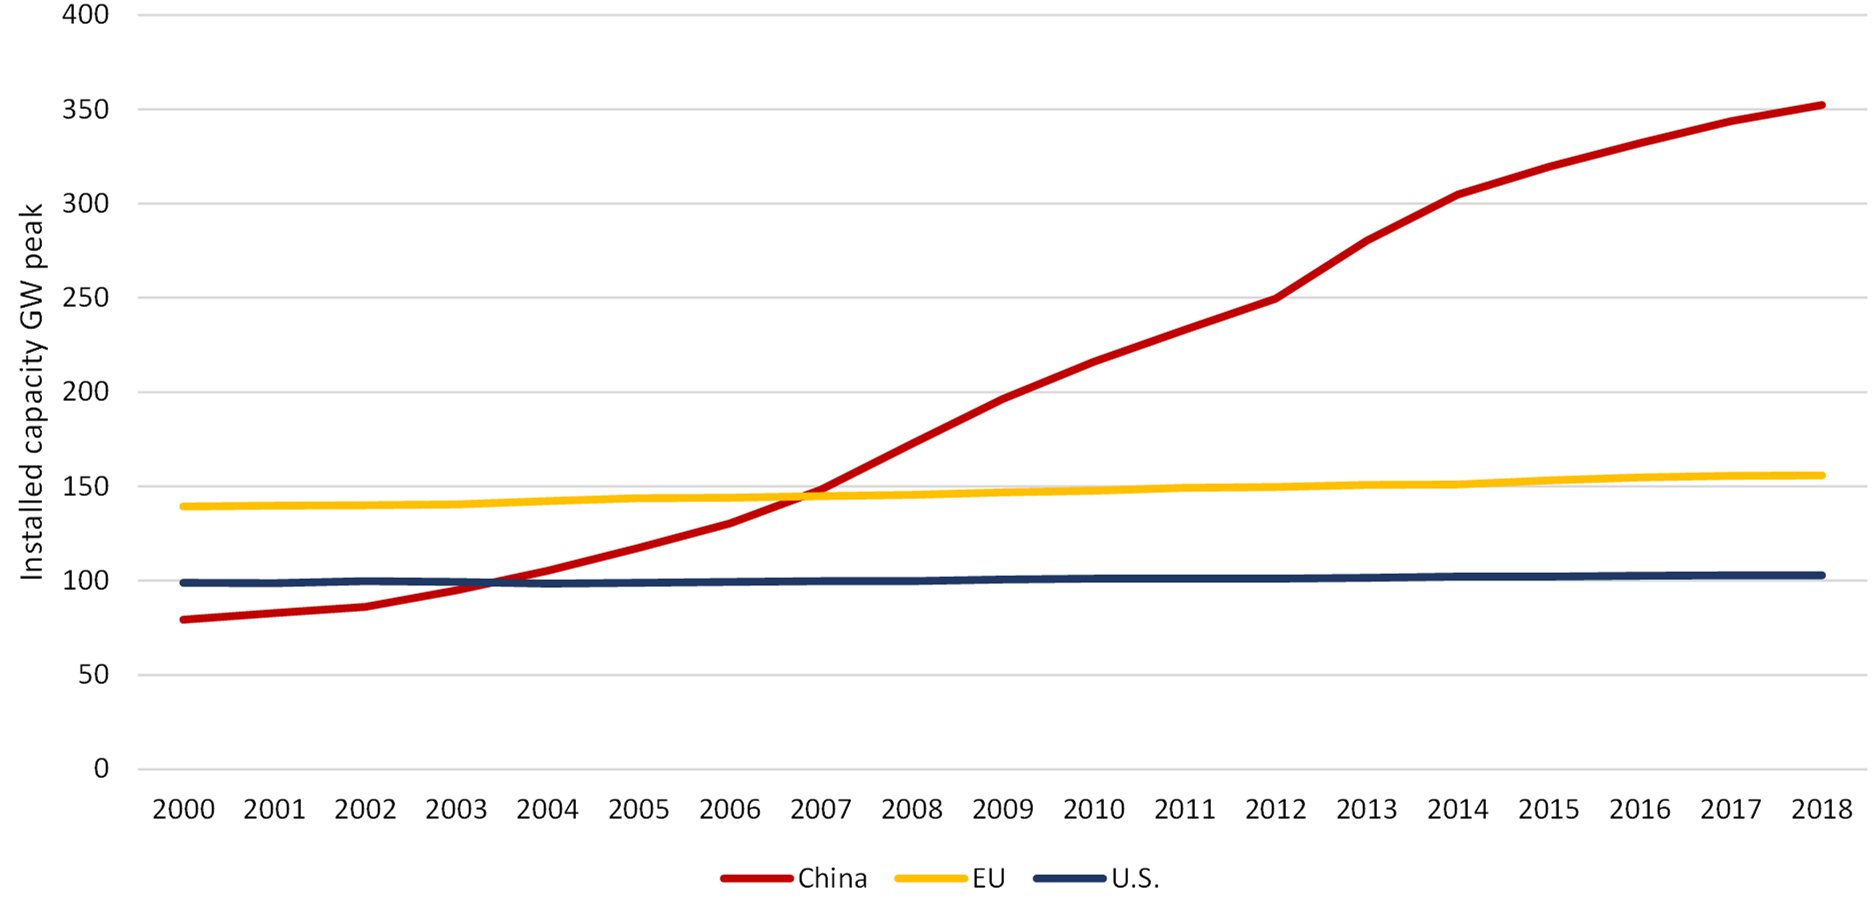
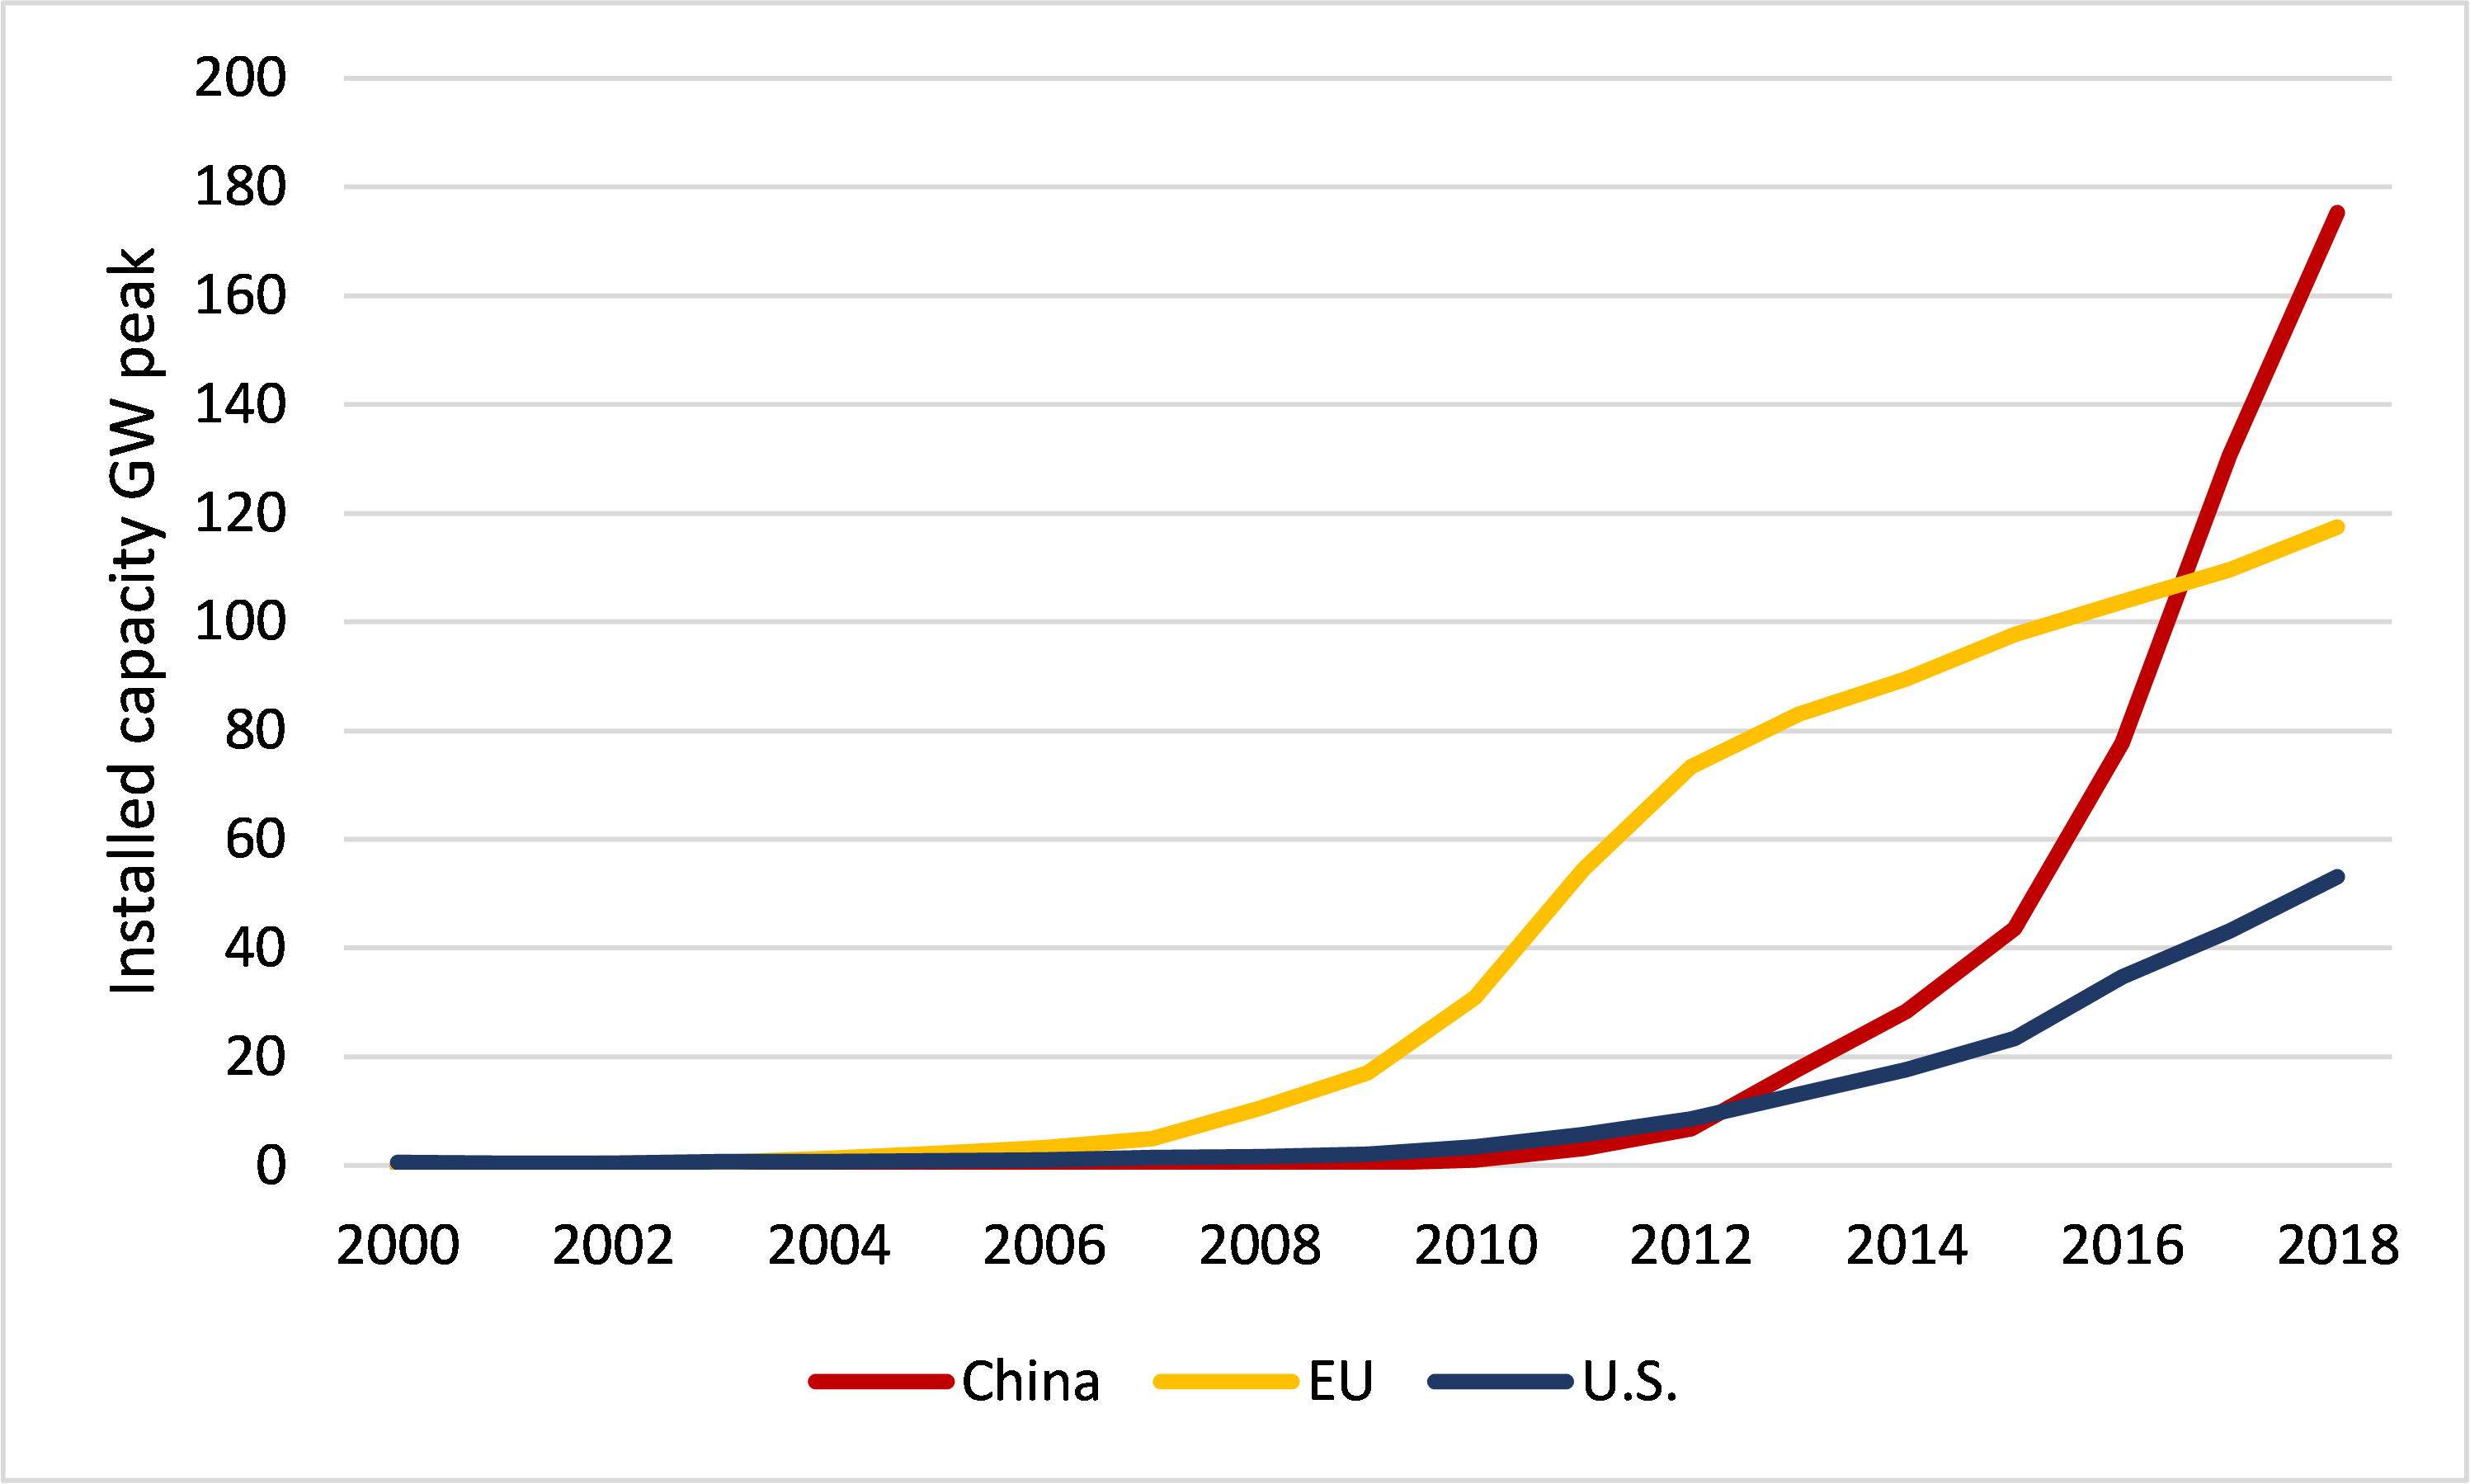
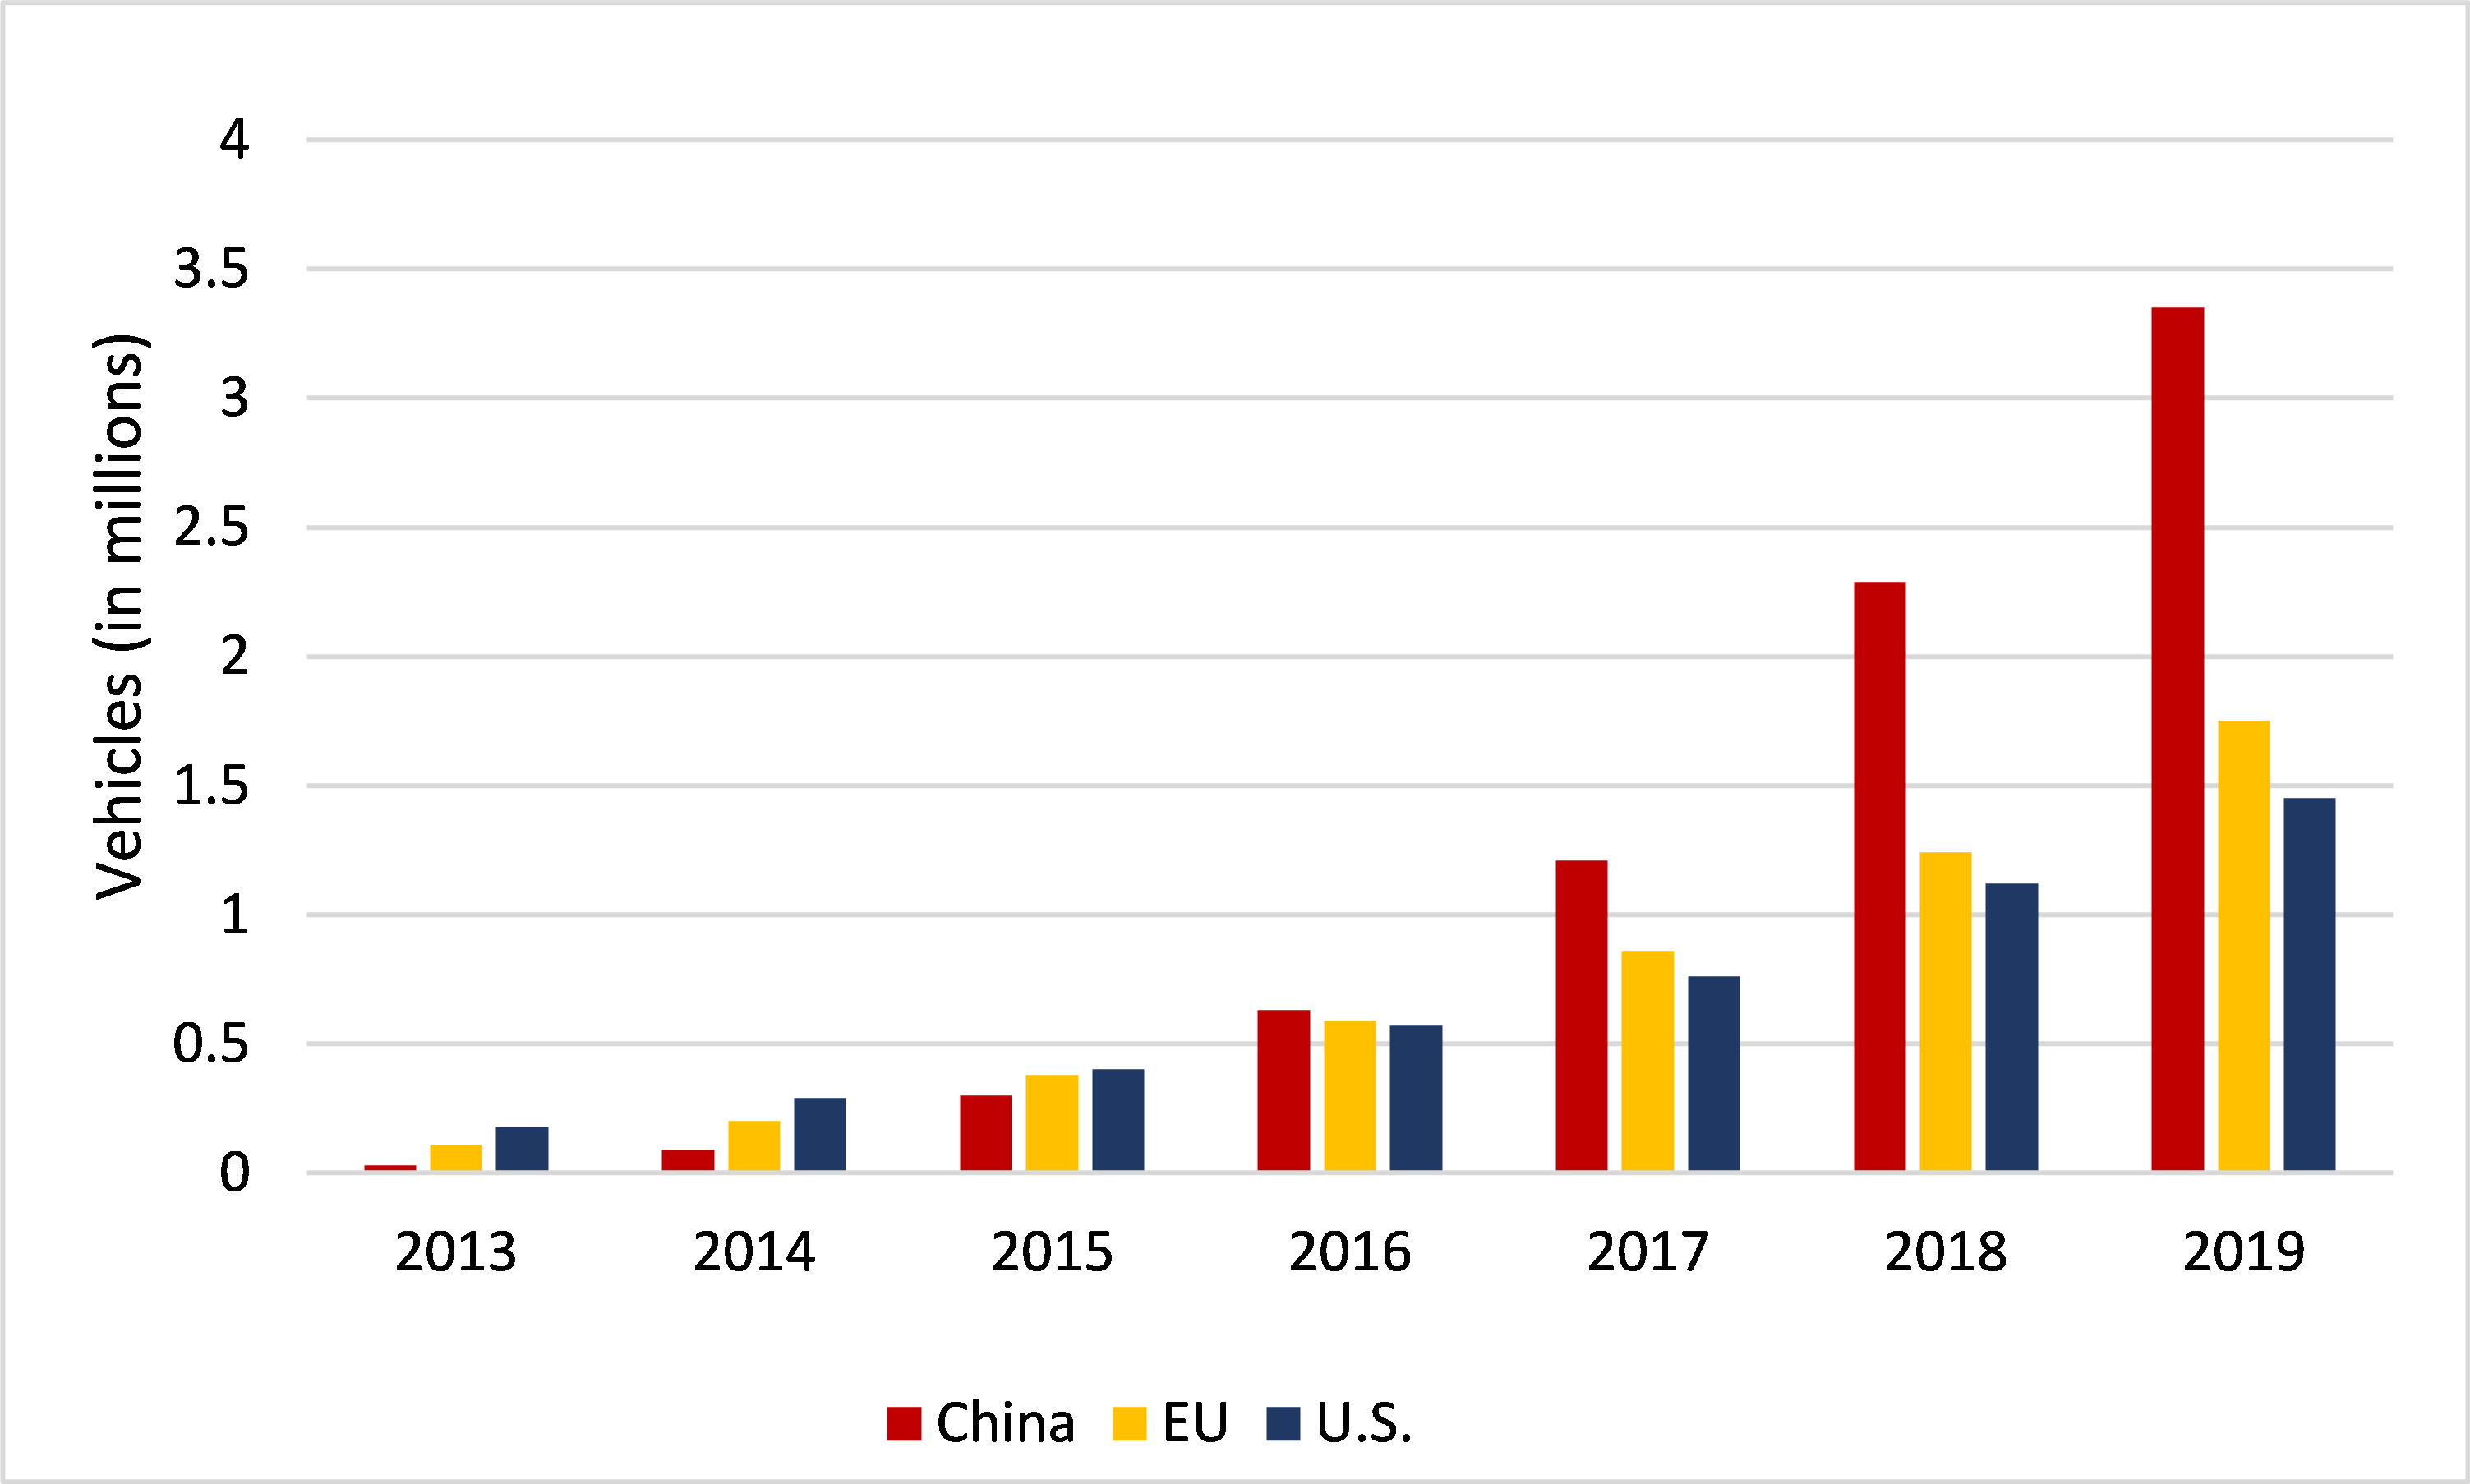
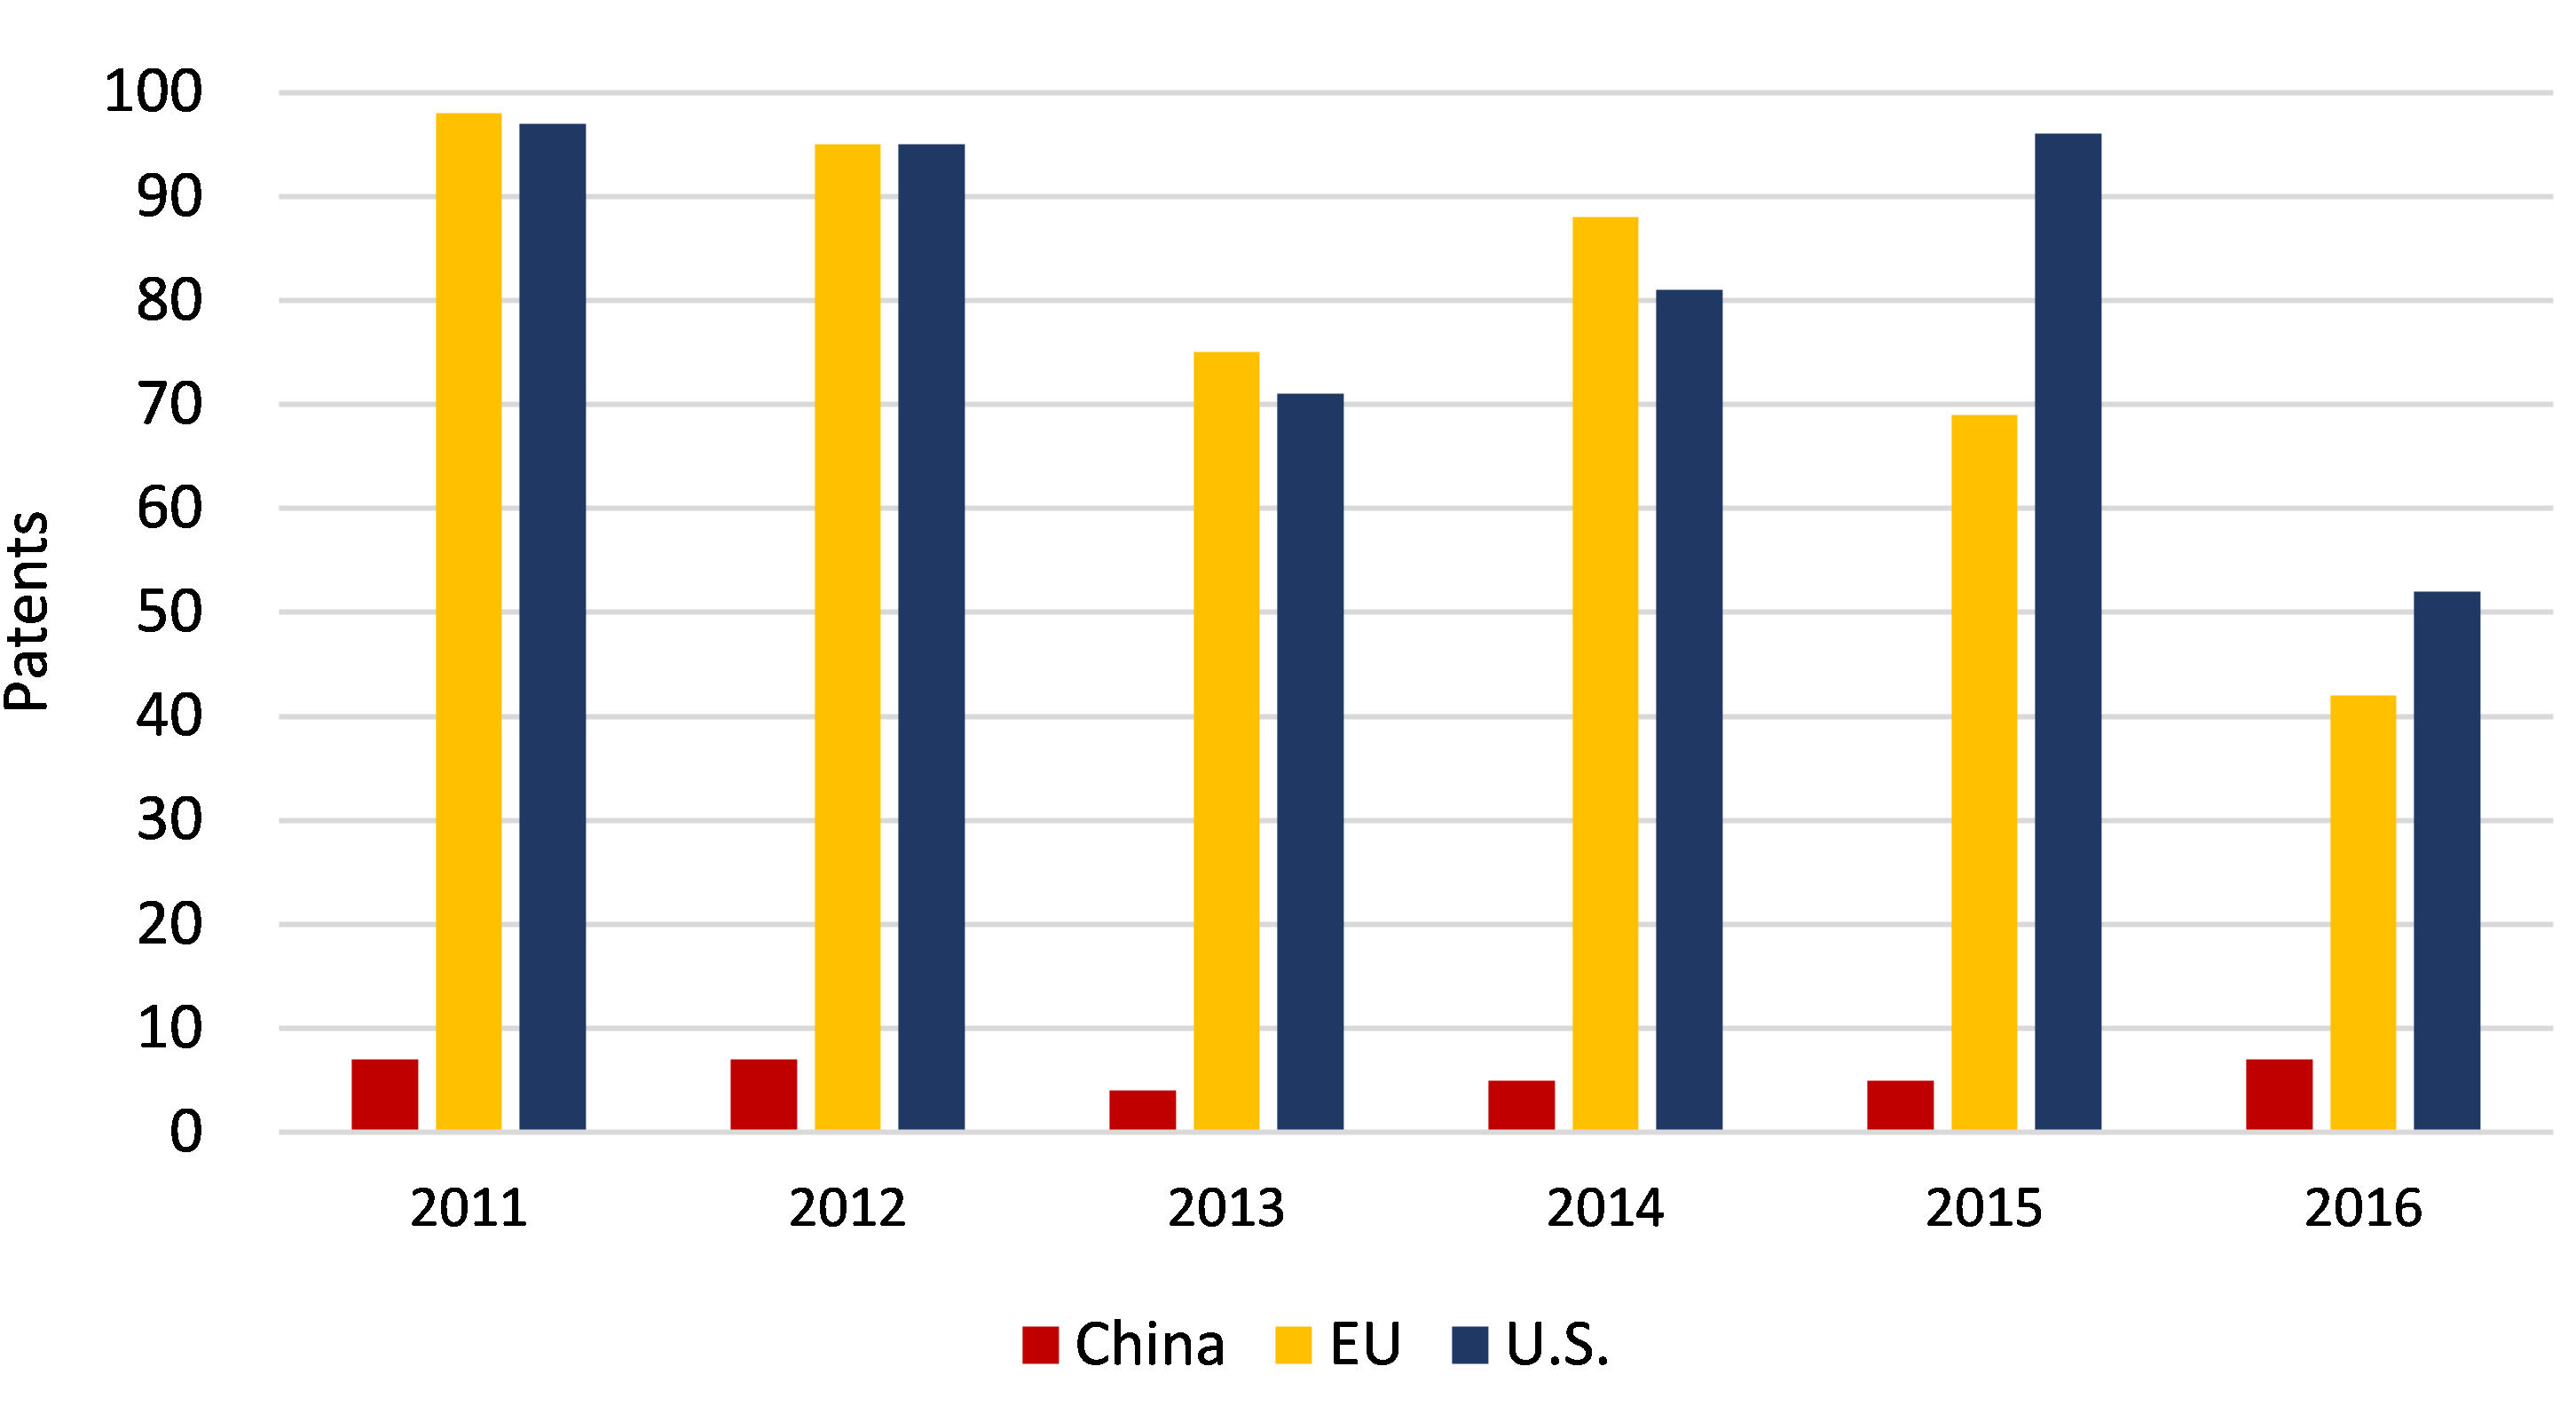
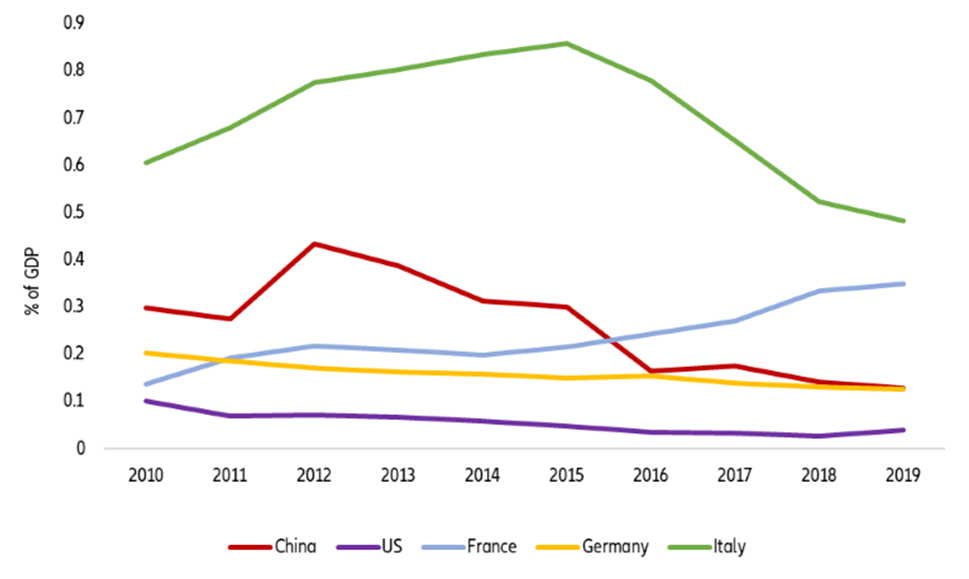
How do the three countries compare in climate policies? China is already leading the pack in renewable energy and electric vehicles, but is lacking in carbon capture and storage (CCS) technology and subsidies for fossil fuels. China’s rise in renewable energy is breath-taking: it has recorded an over 800% increase in installed capacity for renewable energy since 2000, while the EU and the U.S. saw “only” 230% and 160%, respectively. As a result, installed capacity in the U.S. is now around one third of that in China, and the EU stands at two thirds. Back in 2000, all three economies were more or less on the same level. In addition, China’s Electric Vehicles stock is higher than that of the U.S. and the EU combined. The U.S., however, is still leading CCS technologies and has the lowest subsidies for fossil fuel among the three economies.
 
The race for being a climate superpower is open – but it is too early to choose a winner. Our comparative analysis makes it clear that all three economies have to accelerate their climate efforts, materially and quickly. But all face different hurdles. China’s commitment towards climate neutrality lacks visibility. The EU’s Recovery Fund might be stuck or watered down in its Kafkaesque bureaucracy. And the U.S. has to overcome its highly divisive elections. Even after Covid-19, climate policy remains a race full of hurdles. But unlike the wrangle for technological and geopolitical hegemony, this might produce the right winner: the global climate.

U.S., EU, China: not on track to 1.5°C

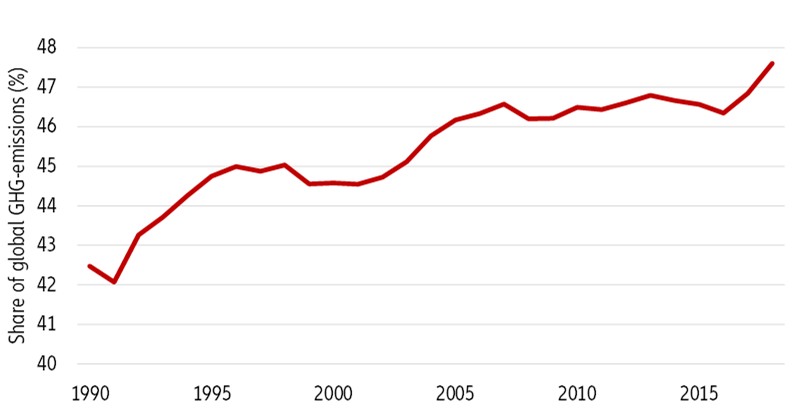
The Paris Climate Agreement, adopted in 2015 and approved in 2016, set a long-term goal to limit an increase in the global average temperature to 1.5°C above pre-industrial levels, compared to the previous less ambitious goal of 2°C. China, the EU (defined to include UK) and the U.S. accounted for almost half of all global greenhouse gas (GHG) emissions in 2018, with a clear upward trend (see Figure 1). So the performance of these three economies will be decisive for reaching the Paris Climate Agreement goals.

Figure 1: Combined greenhouse gas emissions of China, the U.S. and the EU

 Figure 1: Combined greenhouse gas emissions of China, the U.S. and the EU
Source: Allianz Research, Data: Climate Action Tracker
However, at this stage, none of them has even come close to reaching the path required to limit the rise in global temperature to 1.5°C (Figure 2). In fact, the current policy projection paths suggest the global mean temperature could increase by 2.8°C. The divergence from the paths compliant with the Paris Climate Agreement objectives is huge for each economy, signifying a need for more aggressive and progressive climate action policies.  According to current policy projections, Chinese GHG emissions in 2030 will be more than double its Paris Climate compliant level (14,242 mega tonnes vs 6,452). The absolute discrepancy is 40% smaller for the EU: Estimated 3,382 mega tonnes of emissions in 2030 are pitted against Paris compliant negative GHG emissions of -1,262 mega tonnes . For the U.S. the absolute gap lies right in the middle, as it is estimated to emit 5,934 mega tonnes of GHG emissions in 2030, whereas the Paris Climate compliant levels suggest that it should have GHG emissions of only 292 mega tonnes.

However, this is before taking into account the more lenient climate policy of the current Trump Administration. While China and the EU remain among the signatories, the U.S. national government announced to withdraw from the Paris Agreement in November 2020. Its current policy projection path for the period 2025-2050 is derived from Obama administration climate policies and thus might err on the lower side. But given the uncertainty around future U.S. climate policy, these projections remain the best approximation for the time being. More details about the sectoral consequences and required emission reductions are included in the appendix ‘Sectoral decomposition of climate action ambitions’.

Figure 2: Greenhouse gas emission projections: 2.8°C current policies vs. 1.5°C Paris ambitions
Source: Allianz Research, Data: Climate Action Tracker
The good news is that we are already in the midst of a transformation. Although past emission data (e.g. Figure 2) suggest that there was almost no progress over the last decade, a closer look – taking growth dynamics into account – leads to a more optimistic conclusion: All three economies made considerable progress in decoupling economic growth from emission growth.

Figure 3: CLIMATE ACTION OR JUST A NATURAL TREND? Emission intensity: CO2 emissions per unit of GDP (kgCO2/$1,-GDP, logarithmic scale, in constant 2010 $)  
Figure 3: Climate action or just a natural trend? Emission intensity: CO2 emissions per unit of GDP (kgCO2/$1,-GDP, logarithmic scale, in constant 2010 $)
Source: Allianz Research, Data: Climate Action Tracker
Figure 3 shows the CO2 emissions required to generate a dollar of GDP. In all three economies, this metric has been steadily declining. The vertical scale is expressed in logarithmic values, which reveal astonishingly robust trends over the last 50 years. China, while starting higher due to its economic structure being tilted more towards manufacturing, is now below 1 kg of emissions per dollar (in 2010 inflation adjusted value). The decline of China’s emission intensity has been the fastest among the group. The CO2 emissions per dollar have halved every 20 years there, while a 50% reduction of the emission intensity requires almost 30 years, or a generation, in the U.S. and the EU. Keeping all trends constant, China will still need until 2140 to catch up with the U.S. and until 2200 to catch up with the EU, though it would already catch up with the world average in 2050.
It is obvious that relying on these trends alone is not a viable option, as zero emissions would then only be reached… never. Still, the observable progress becomes more evident if the growth dynamics are analyzed (Figure 4). Historically economic and emission growth have been positively correlated which holds true for all countries in Figure 3. Annual point values vary a lot, but observing trends indicates that all countries start with an average increase between 0.6% and 1.6% in CO2 emissions for a 1% increase in GDP, with China, as an emerging country, having the largest increase. But already from the 1980s economic and emission growth seems to have largely decoupled in the EU, with the U.S. following in the late 2000s. The analysis, however, also shows that there has not been much progress since the 1980s. Just decoupling economic and emission growth won’t be enough; future economic growth must rather result in significant reductions in emissions. The EU is already on the right track and shows negative coupling (see Figure 4) although efforts still need to increase.

Figure 4: ‘Coupling index’ percentage change of emissions per one percent growth of GDP (10-year brackets, constant 2010 $)
Source: Allianz Research, Data: Climate Action Tracker

A stocktaking of climate (in)action

Greening the energy supply
Besides the changing structure of the economies – from manufacturing to services – one decisive factor behind decoupling is the greening of energy supply. Over the years, China, the EU and the U.S. have become the significant drivers of renewable energy resources: Their share in the global installed capacity for renewable energy rose from 41% in 2000 to 60% in 2018. However, China is far outpacing the EU and U.S. in this regard.
Figure 5 shows the developments in renewable energy installed capacity over the period of 19 years since 2000. While China has recorded a growth of more than 800% in its installed capacity for renewable energy (from a mere 76GW in 2000 to 695GW at the end of 2018), the EU and the U.S. observed growth of “only” 230% and 160%, respectively. As a result, installed capacity in the U.S. is now around one third of that in China; the EU stands at two thirds. Back in 2000, all three economies were more or less at the same level.

Figure 5: Total renewable energy: installed capacity

 Figure 5: Total renewable energy: installed capacity
Source: Allianz Research, Data: Climate Action Tracker
Again, it is worthwhile to take a closer look as the development trends in installed capacity for subsectors (wind, solar, hydro) vary substantially. Figure 6 shows the trend development of installed wind energy capacity in the three economies. Growth was rapid both in China and the EU, with China overtaking the EU in 2017. In contrast, the progress of the U.S. in wind energy capacity is rather lacklustre.

Figure 6: Wind energy: installed capacity
Source: Allianz Research, Data: Climate Action Tracker
Figure 7 shows the developments of hydro energy installed capacity for the three economies. Thanks to less restrictions for mega projects, China has significantly increased its hydro energy capacity by a whopping 300% since 2000, from 80GW to 352GW. Over the same period, the EU and the U.S. recorded only marginal increases.

Figure 7: Hydro energy: installed capacity
Source: Allianz Research, Data: Climate Action Tracker
Figure 8 shows the trend developments in installed capacity for solar energy for the three economies. All three saw rapid growth in their installed solar power capacity in recent years. But once again, China recorded the largest installed capacity (175GW), whereas the EU and the U.S. lagged behind (117GW and 53GW, respectively).

Figure 8: Solar energy: installed capacity
Source: Allianz Research, Data: Climate Action Tracker
Electrifying the transport sector
As transportation accounts for one fourth to one fifth of all GHG emissions (based on well-to-wheel emissions), the shift to electric vehicles is of utmost importance for reaching Paris climate goals. An all-electric vehicle (EV) has zero direct emissions (tail-pipe emissions) and a hybrid-electric-vehicle is more efficient than a traditional fuel based vehicle. Even if well-to-wheel emissions are considered, electric vehicles emit lower emissions than an internal combustion engine vehicle, provided certain basic conditions are fulfilled (IRENA 2017).
China, the EU and the U.S. are clearly the frontrunners in EVs. In 2013, the three economies had 80% of the global EV stock, which increased to 91% in 2019 (Figure 9). However, while in the early years of this decade the EU and the U.S. had a relatively higher stock of EVs, China has outpaced all other economies in recent years. At the end of 2019, China had an EV stock of 3.35 million – a more than 50% increase from 2018 (2.29 million). In comparison, the EU and the U.S. had EV stock of 1.75 million and 1.45 million in 2019, respectively. Over the years, the EV stock of the EU has outgrown that of the U.S., leaving the latter with the lowest EV stock of the three economies. Looking ahead, we expect the pace of growth of all three EV markets to increase amid dedicated EV policies by major governments, dividends from further development of ancillary infrastructure (EV charging infrastructure) and a shift in consumers’ preferences.

Figure 9: EV Stock 
EV Stock
Source: Allianz Research, Data: Climate Action Tracker
Negative emission technologies
Specific and ambitious policies that explicitly address the removal of carbon dioxide from the atmosphere will play an important role in achieving the Paris Climate goals. Negative emissions technologies and solutions such as afforestation/reforestation and Bioenergy with Carbon Capture and Storage (BECCS) are prominent means to remove carbon emissions from the atmosphere.
China has the lowest forest coverage among the three economies – 22% vs 34% in the U.S. and 40% in the EU (2016) – but by far the most ambitious forest policy: China’s Natural Forest Conservation Program is the largest forest conservation program in the world. It includes massive tree-planting programs, an expansion of forest reserves and a ban on logging in primary forests. The Chinese government spends heavily on these forest programs—more than either the U.S. or the EU and more than three times the global average per hectare . The country has set a 2035 forest coverage target of 26% as well as an intermediate target of 23.04% by 2020.  China already planted more than 7 million hectares of forest per year between 2016-2018 .
Carbon Capture with Storage technology (CCS) will also play a critical role in the reduction of emissions. This process that involves capturing carbon emissions and storing them, rather than releasing them back into the atmosphere. A comparative analysis of the reserve capacity of CCS is rather difficult on account of the lack of adequate data and the lack of a standardised measure for comparison. However, the development of CCS-related patents are suggestive of the potential. Figure 10 shows that the EU and the U.S. have significantly higher CCS patent issuances than China. Thus, CCS seems to be the one field in which the EU and the U.S. appear to lead.

Figure 10: New CCS Patents
Source: Allianz Research, Data: Climate Action Tracker
Ending fossil fuel subsidies
Ending fossil fuel subsidies is the flip side of subsidizing green technologies – and often overlooked. Fossil fuel subsidies can inhibit sustainable economic development and climate action progress by inefficiently allocating resources, distorting relative prices of energy and adversely affecting the price competitiveness of low-carbon energy businesses. A cross-country comparison of fossil fuel subsidies is not straightforward because there is no agreed upon unique definition of subsidies amongst countries. We use the OECD’s definition of fossil fuel subsidies, considering both direct budgetary transfers and tax expenditures based on an inventory approach. Figure 11 shows the development of fossil fuel subsidies as a percentage of annual GDP for China, the U.S. and three big EU countries (Germany, France and Italy).  In the case of both China and the U.S., the magnitude of fossil fuels as a percentage of GDP has been decreasing since 2010. However, at the end of 2019, China’s relative fossil fuel subsidies were still higher than that of the U.S. The development in the EU is less encouraging. Not only is the relative level of subsidies significantly higher, but the trend is also worrying, at least in France, where fossil fuel subsidies have increased threefold as a percentage of GDP.

Figure 11: Fossil fuel subsidies
Source: Allianz Research, Data: Climate Action Tracker

How green is the green recovery?

The economic rebuilding after Covid-19 represents a historic window of opportunity to accelerate the global transition to a net zero emission society. Moving from short-term rescue to longer-term recovery packages, the focus should also shift to long-term climate benefits. China and the EU seem to be ready to prioritize climate-friendly investments that stimulate economic growth.
At the UN General Assembly on 22 September, Chinese President Xi Jinping announced a pledge that China’s CO2 emissions will reach net-zero by 2060. This move may not only help the climate – it could lower the global mean temperature increase by around 0.25°C – and China’s soft power, but may also pay off in pure economic terms. According to an analysis by Cambridge Econometrics , this will have a positive overall net impact on China’s GDP, resulting from a combination of positive spillovers from the investment activities in other sectors, enhanced technological progress and leadership in green technologies, reductions of the fossil-fuel import bill and an increase in self-sufficiency and consequently a strengthening of the domestic market. As a result, in the Cambridge Econometrics analysis, China’s GDP could increase by close to 5% in the net-zero scenario relative to the baseline, as shown in Figure 12. However, at this stage, there is (very) low visibility on the measures under the new climate target. More details about the planned policy action are included in the appendix ‘Overview of climate policies pre-Covid-19’.

Figure 12: Reaching net-zero by 2060 would raise China's GDP (Change in China’s GDP in the net-zero pathway, relative to the baseline)

Figure 12: Reaching net-zero by 2060 would raise China's GDP (Change in China’s GDP in the net-zero pathway, relative to the baseline)
Source: Allianz Research, Data: Climate Action Tracker
The EU is not only equally ambitious but also has a more concrete plan: The European Green Deal (EGD) was already presented in December 2019 (see appendix for full details). Its overarching strategy/goal is the transformation of the EU into a fair and prosperous society, with a modern, resource-efficient and competitive economy, net-zero GHG emissions by 2050  and economic growth decoupled from resource use. While these targets sounded quite lofty when announced, the recent EU Recovery Fund – the EU’s answer to the Covid-19 shock – has put some meat to the bone i.e. underpinned the proposals with real money. A green recovery is within reach for the EU.

And the U.S.?
It seems to be moving in the opposite direction, at least at the federal level. The U.S. initiated the withdrawal process from the Paris Agreement back in 2017 and will finalise its exit in November 2020. Furthermore, the current U.S. administration devised the Affordable Clean Energy Rule (2018) to replace the Clean Power Plan of the previous administration. But the new policy has been subject of litigations in courts.  Thus, a state of stagnation pervades at the federal level in relation to climate policy. However, once the fog of the elections has settled, the U.S. might also join the other two economies in pushing for a green recovery. Thus, it is still too early to identify a clear winner in the race of climate predominance.  
Markus Zimmer
Senior Expert, ESG
Arne Holzhausen
Head of Wealth, Insurance and Trend Research
Anqi Dang
Allianz Investment Management
Dhruv Patel
Research Assistant