What to watch:
In focus – A slow landing for China
- The Chinese consumer is at the heart of public support measures but rebuilding confidence will take time. More support measures are likely by year-end to stimulate employment (e.g. corporate rate cuts, notably for SMEs). Cash handouts or VAT rate cuts are not yet the preferred option but they remain likely.
- The housing market should stabilize at low levels. Further regulatory easing measures are expected to allow second-home buyers to become first-home buyers in more Tier-1 cities. Together with further rate cuts and the reduction in minimum down payment ratios for first- and second-home buyers, this should help reduce the housing glut and improve confidence. On the infrastructure side, annual quotas are expected to be fully utilized by end-September and additional spending should be announced to avoid a fiscal cliff in Q4 (0.5% of GDP from 2022 unused quotas).
- China will continue to export deflation as overcapacities in the manufacturing sector remain. This has pushed Chinese companies into an export-price deflationary cycle and cut -1pp on average from y/y inflation in the US and Eurozone since June.
- Despite recent easing measures, the monetary policy stance is still too restrictive. Recent cuts in rates on existing loans and deposit rates could free up around +0.3pp of growth through additional consumer spending, but the negative credit impulse is costing -0.8pp in terms of annual GDP growth. Hence, we expect two more broad-based rate cuts (incl. FX deposit RRR) before year-end.
- While activity and capital markets have probably bottomed out, we expect sluggish growth ahead on the back of long-lasting structural adjustments. We cut our GDP growth forecast to +5.3% in 2023. Major economies reduced exposure since the pandemic (on average -0.1pp for -1pp on import growth) against more than -0.5pp for Chile, Indonesia, Thailand and Malaysia. We expect the USDCNY around 7.2 until year-end, 10Y sovereign yields at 2.7% this year and 3% next year and around +5% in equities until year-end, followed by mild performance in 2024.
ECB Governing Council meeting – not much higher but for longer
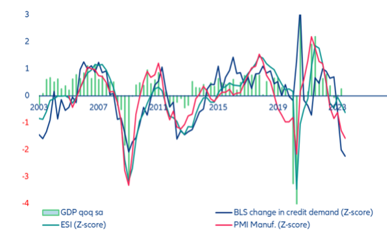
With the next Governing Council meeting coming up on 14 September, ECB policymakers are grappling with an increasingly complex economic landscape. While inflation is still unacceptably high, a slew of leading indicators point to a rising likelihood of a sharper economic downturn (Figure 1). The Economic Sentiment Indicator (ESI) recorded its weakest performance since the Eurozone crisis, barring the pandemic period. Meanwhile, the Purchasing Managers' Index (PMI) printed at levels below the expansionary threshold of 50 both for the manufacturing and services sectors. On the financial side, the Bank Lending Survey (BLS) indicates the fastest contraction in credit demand since records began in 2003 – a picture matched by a stark drop in monetary aggregates and bank lending figures (M1: -9.5% y/y). Isabel Schnabel, an influential und usually very hawkish member of the ECB executive board, last week admitted that “new lending has declined sharply” amid higher interest rates and that “activity and the volume of order books in the manufacturing sector have fallen sharply to levels typically only seen in deep recessions.” While the labor market still stands as a puzzling contrast, with the unemployment rate remaining at historic lows, like inflation the figures serve as lagging indicators and could easily swing into less favorable territories. Another unsettling dimension is the "real income squeeze" that European households are experiencing. Inflation has significantly outpaced nominal wage growth, causing a real income loss of around 4%. This suggests that household consumption, the largest component of GDP, could take a significant hit in the near term if consumers adjust their spending behaviors.
Figure 1:Eurozone leading economic indicators (Z-scores) and GDP
Sources: Refinitiv, Allianz Research. Note: Extreme GDP growth rates during the pandemic in 2020 not displayed due to scale limits.
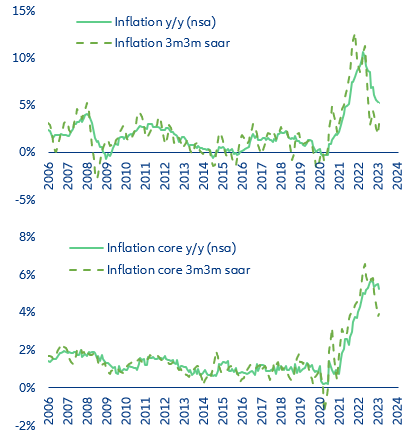
A sequential analysis of inflation data, as opposed to year-over-year comparisons, reveals a somewhat faster downward trajectory. Despite an unwelcome re-acceleration in the energy component in August, the latest 3m/3m annualized and seasonally adjusted inflation rate stood at 3.0% (core: 3.9%) compared to the official rate of 5.3% y/y (core: 5.3%, Figure 2). Services inflation has also retreated from its July peak, bringing relief to policymakers. Ongoing disinflation coincides with a significant shift in the ECB's communications strategy. Whereas in June the focus was still on the risks of persistent and high inflation, the tone has since pivoted toward the risks of an economic contraction. In her speech at the Jackson Hole Economic Symposium, ECB president Christine Lagarde emphasized the current economic uncertainty. She also highlighted the challenge for central bankers to address with supply-side shocks such as the Covid-19 pandemic, the war in Ukraine and climate change. Nevertheless, she reiterated the necessity of maintaining "interest rates at sufficiently restrictive levels" to achieve the 2% medium-term inflation target, without however giving any hint as to where this level is.
Figure 2: Eurozone (core) inflation on an annual and a sequential basis
Sources: Refinitiv, Allianz Research.
Although we continue to expect the ECB to implement a final 25bps hike to arrive at a peak rate of 4% (deposit rate), there is a growing risk that policymakers might opt for a hawkish pause next week. Back in June, Lagarde kept options open, stating that future decisions would hinge on incoming data and new macroeconomic projections. Given the disappointing trajectory of leading economic growth indicators and slow but ongoing disinflation, there is now a high chance that the Governing Council might opt for a hawkish pause. In this case, the communication is likely to underscore the need to keep interest rates at elevated levels for an extended period, while preserving the option for additional rate increases as warranted. Regardless of the decision, the meeting promises to be a pivotal event as it will also unveil new staff projections, offering insights into the medium-term economic and monetary policy outlook
Energy outlook – no looming crisis but higher prices for longer
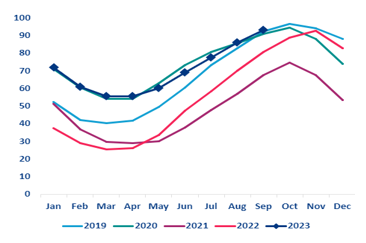
With the 90% target already reached – well ahead of the 01 November deadline – Europe is likely to go into the 2023-2024 winter with full gas storage. The EU has managed to significantly reduce its reliance on Russian gas, which accounts for less than 20% of total imports today (vs. 41% before the war). Liquefied Natural Gas (LNG) imports from alternative suppliers (especially the US) saw a marked increase, with Europe importing over 20% more LNG than the previous year. Beyond these shifts in supply, a combination of factors worked in Europe's favor. Milder winter temperatures in 2022-2023, which were notably lower than the decade average, played a significant role in reducing the continent's energy consumption. This coupled with widespread energy-saving initiatives meant that Europe consumed substantially less than anticipated: Gas demand was 13% below average during the first quarter of 2023.
Figure 3: EU Gas storage level (%)
Sources: AGSI, Allianz Research
However, the European energy landscape remains fraught with uncertainties. While the savings achieved by corporates should be sustainable, most of the household savings were due to weather effects, which could pose a risk going forward. A harsher winter could still strain the continent's energy reserves. If a severe winter is accompanied by poor performances of renewable energy sources (solar and wind), demand could outstrip supply, leading to depleted storage levels next spring and potential tensions on energy prices for European households and corporates. Indeed, natural gas prices, which have enjoyed relative stability over most of 2023, are susceptible to volatility. We forecast natural gas prices to average 45 EUR/MWh in Q4 2023 (vs. close to 35 EUR/MWh currently).
Another source of uncertainty for European gas is the potential impact of the Chinese recovery. In 2022, as the country was under a strict zero-Covid policy, demand for energy and for LNG from China remained subdued. In this context, the softer-than-expected rebound of Chinese growth is a relief for gas prices. However, in the longer run, Europe will face heightened competition with China. With the country’s push to transition from coal to cleaner energy sources, LNG is positioned as a preferred alternative. As a result, Europe will find itself not just competing on prices but also on supply availability with China. This intensified competition could potentially strain Europe's energy security, especially during periods of supply tensions, underscoring the urgency to diversify energy sources and eventually reduce dependency on LNG imports as well.
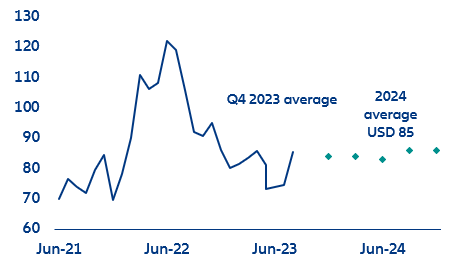
OPEC+’s strong grip means oil will remain expensive. Recent developments in the global oil market have signaled a tightening of supply, with the two major players Saudi Arabia and Russia extending their voluntary output cuts. Saudi Arabia announced on Tuesday that it has prolonged its cut of 1mn barrels per day (bpd) until the end of 2023, a move that underlines the country’s determination to increase prices. Russia also decided to extend its oil export cuts by 300,000bpd until the year's end. These decisions made against the backdrop of volatile markets pushed Brent prices above the 90 USD/bbl threshold for the first time since November 2022. We expect Brent prices to average at 84 USD/bbl in Q4 2023 because of the soft macroeconomic backdrop, and we forecast an average price of 85 USD/bbl in 2024 as supply should remain tight next year.
Figure 4: Oil price forecasts
Sources: Refinitiv, Allianz Research
Back to school for corporates– slowing demand is biting quicker than tightening financing conditions in both the US and the EU
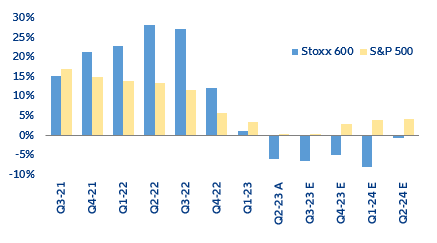
The Q2 earnings season confirmed that companies are feeling the pinch from waning demand and still-high production costs: Global revenues fell by -1.9% y/y on average, with all regions recording contractions for the first time since 2020. Revenues in the US fell by -0.3% y/y, although it is worth noting that S&P 500 companies avoided the recession, with sales growing by +0.5% y/y, thanks to a positive contribution from the financial sector (+11.3% y/y). Conversely, after showing resilience in the Q1 earnings season, European companies have finally entered negative territory. Although not all Stoxx 600 companies have published their results, sales of companies in the index are expected to fall -6.0% y/y, largely burdened by the energy sector. Excluding energy, revenues are expected to increase +0.6%. Meanwhile, global earnings fell by -1.2% y/y on average, with companies on both sides of the Atlantic recording declines in earnings per share (-2.9% y/y for the S&P 500 and -5.0% y/y for the Stoxx 600). Marine transportation (-77% y/y), paper & forest (-52% y/y), chemicals (-51% y/y) and metals & mining (-45% y/y) saw the largest contractions, hit by waning demand, declining prices and still-high production costs.
Figure 5: Quarterly revenue growth (y/y) for companies in Europe and the US
Sources: Refinitiv IBES, Allianz Research
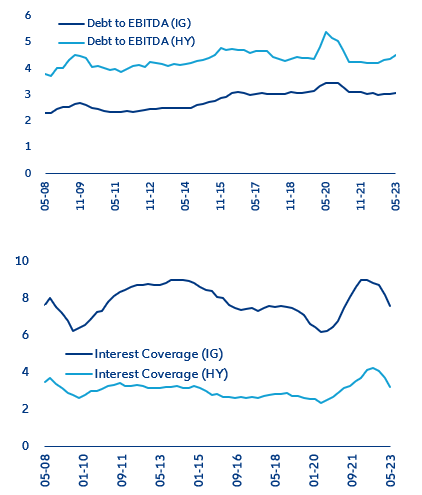
The full effect of higher interest rates is still looming over the coming quarters. This will particularly affect high-yield companies that have increased leverage since Q4 2022 (Figure 6) and could trigger potential ratings downgrades ahead. This will further increase pressure as lower ratings lead to even higher funding and refinancing costs. Companies still have an interest-coverage capacity above pre-pandemic levels (2017-2019) but the ratio has been visibly diminishing for both high-yield and investment-grade segments. Given the gloomy economic outlook that threatens profit generation in H2 2023, we do not expect this downward trend to reverse in the short term.
Figure 6: Debt to EBITDA (first) and interest coverage (second) average ratios
Sources: Bloomberg, Allianz Research.
Looking ahead, Q3 is expected to be mixed and particularly negative for Europe. Over the past 30 days, Q3 earnings expectations have changed by -1.0% globally, with the Eurozone seeing the largest downward revision (-8.0%), followed by Europe as a whole
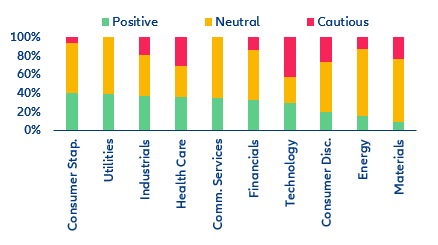
(-6.0%) and emerging markets (-2.6%). In contrast, the US has seen a slight upward revision (+3.5%), suggesting that the worst is perhaps past for American corporates. Around 52% of European companies have provided neutral guidance for the second half of 2023 but this represents a step down from the optimism of previous quarters. The sectors with the highest downgrade vs. upgrade guidance ratios are materials (2.6), technology (1.5) and consumer discretionary (1.4), which is no surprise in a context of economic uncertainty.
Figure 7: Europe - Company guidance (2023 FY) distribution by sector, shared over the Q2 earnings season
Sources: Bloomberg, Allianz Research
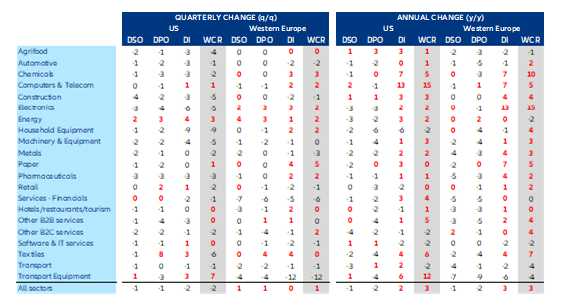
At the same time, elevated inventories and high working capital requirements (WCR) could force companies to deprioritize debt reduction, investment, new business development or research & development. According to balance sheets published for Q2 2023*, the drop-in inventories traditionally seen in the second quarter of the year either failed to compensate for trends in previous quarters (US) or did not occur (Europe), a sign of overstocking that at least partly reflects sales that were less buoyant than anticipated. Overall, inventories remain above the previous year’s levels in the US (+2 days y/y as of Q2) and Europe (+3 days y/y). In the US, despite the second-quarter decline (-2 days q/q, compared with -2 days for the 2008-2022 average), most sectors (16 out of 21) reported higher inventories than last year, particularly computers/telecom, chemicals and transport equipment. In Europe, flat inventories in quarterly and global terms (+0.4 days q/q against a decline of 1 day q/q for the 2008-2022 average) masked a majority of sectors (15 out of 21) posting higher inventories in a yearly comparison, with the strongest increases in electronics, chemicals and paper. At the same time, average payment delays shortened in the US and Europe for most sectors on a year-over-year and sequential basis. However, this acceleration in payments was more marked on the suppliers’ side than on the customers side, so that the net effect remained positive (+1.8 days y/y and +0.3 in the US and Western Europe, respectively). As a result, it contributed to increase the WCR, especially for household equipment in the US and Europe, as well as B2B services and transport equipment (US) and B2C services and automotive (Western Europe).
Figure 8: Change in DSO, DPO, inventories and WCR, by sector, Q2 2023
(*) based on Q2 2023 financials of firms that have released an extended and detailed version (i.e. operating/financial results + balance sheets) as of 01 September (1,560 firms in the US and 990 in Western Europe, out of 12,700 firms globally) and using cylindrical samples for each period comparison
Sources: Eikon/Refinitv, Allianz Research
Overall, nearly three out of four sectors still record higher WCR at the start of Q3 compared to last year. The US (+3 days y/y at national level) is leading the global rebound in WCR for computers/telecoms, energy, B2B services and transport equipment, while B2C services, software/IT services and household equipment are registering smaller WCRs. In Europe (+3 days y/y), where the UK (+8) is leading the regional increase in WCR, ahead of Spain (+7) and Germany (+4), eight sectors stand out: electronics, chemicals, construction, household equipment, metals, paper, B2C services and textiles. In the short term, we do not expect a large reduction in WCR since some of the higher inventory levels is explained by structural factors resulting from recent geopolitical developments and supply-chain shocks that prompted companies to switch from the “just-in-time” inventory-management strategy to the costlier “just-in-case” (near/friend shoring) one.
China – Slow landing
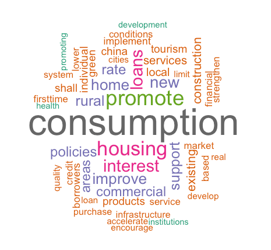
The Chinese consumer is at the heart of the recently announced public support measures that should tackle but not entirely solve the confidence crisis. Employment prospects stand at their lowest levels since early 2023 and one out of five youth are unemployed as key sectors such as IT, real estate and finance reduce hiring prospects. The real estate market has been hit by real interest rates at close to 5%, which has restrained prospects for new buyers but also kept the debt burden elevated for existing ones. As a result, the recent measures announced by the authorities focus on consumption, housing and financing, though they are incremental and far from the fiscal bazookas seen in the past years (Figure 9). They should prevent economic activity from worsening further but will not result in any solid and long-lasting rebound in growth. Hence, we believe more support measures are likely to be announced in order to stimulate employment. Some of the measures could take the form of corporate rate cuts, notably for SMEs. Cash handouts are not a preferred option for now but given the increase of deflationary pressures and low prospects for consumption, they might be implemented at the turn of the year should data remain below expectations. The authorities still need to deliver a growth target of “around 5%” while the growth carryover as of the first half of the year stands at 4.3%.
Figure 9: 50 most used words within the recent plans from the authorities
Sources: official documents, Allianz Research
The authorities moved relatively fast to tackle the housing market slump through further regulatory easing measures to allow second-home buyers to become first-tier home-buyers and reduce the housing glut. While construction activity will be supported by the acceleration in infrastructure spending – local-government bond issuance has jumped on the back of directives in early August telling local governments to fully utilize annual quotas for special bonds by the end of September – prospects in the residential sector remain weak. Good news comes from the fact that more Tier-1/2 cities can further ease minimum down-payment requirements beyond the official reduction (for the first home to 20%, vs. 20% to 35% previously on average, and the second home to 30%, vs. 30% to 70% previously, which will allow a reduction in the housing glut. We expect additional infrastructure investment to be announced in September-October to avoid a fiscal cliff as local governments are expected to have spent all special bond proceeds. Around 0.5% of GDP remains from 2022 unused quotas.
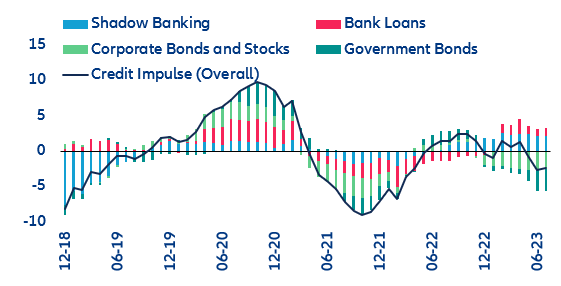
The monetary stance is still far from restrictive, with a net negative effect of -0.5pp on growth. Back in June we argued that further rate cuts would be likely in August. The PBoC cut its one-year medium-term lending facility by 15bps, the most since the start of the pandemic, which should support overall liquidity. The one-year loan prime rate (LPR) was lowered by only 10bps, which should support credit. Indeed, the credit impulse is still costing -0.8pp in terms of annual GDP growth as it has been negative since May 2023 (Figure 10). All tools have been used: At the end of August, the PBoC reduced the FX RRR rate from 6% to 4% in an attempt to support the currency. Furthermore, state banks will be able to reduce rates on existing loans as well as deposits, which should free-up around +0.3pp of growth through consumer spending.
Figure 10: Credit Impulse, % y/y
Sources: Official sources, Refinitiv, Allianz Research
Economic woes pressure Chinese capital markets. As a result of the disappointing economic data, low inflation and persistent vulnerabilities for real estate developers, Chinese sovereign bonds have witnessed some of their lowest yields in the last 20 years, with the 10Y currently trading below 2.7%. Although we do not see yields falling below 2.5% this year, downside risks remain. We anticipate yields rebounding to 3% in 2024 as inflation nears 2%.
This relatively low-yield environment is likewise contributing to the downward pressure on the Chinese yuan (CNY), especially as major economies such as the US swiftly hiked interest rates in the last 18 months. We expect the CNY to avoid what we call a “confidence crisis” threshold (above 7.32). Indeed, a lower CNY can help support the reduction in Chinese overcapacities in the manufacturing sector, but a too strong one could increase G7 fears of China embarking on a sort-of currency war. Hence, we believe the authorities will want to keep a CNY “low enough” to avoid a deeper real estate crisis, notably in the context of housing market issues, but “high enough” to prevent the intensification of the US-China rivalry and the increase in protectionist measures. Moreover, rate cuts in the FX RRR rate from 4% to 2% after the -2pps cut at the end of August remain on the table in order to increase FX liquidity onshore, as well as a further easing of regulatory measures to access capital markets, in particular the equity market after the series of measures announced in August (including the cut in the stamp duty on securities transactions). Our expectation of further bond issuances in Q4 in order to avoid a fiscal cliff will also allow the CNY to remain around 7.2/USD by year-end.
For the third consecutive year, Chinese equity markets are lagging other major emerging markets. But they are starting to welcome the multiple support packages – in particular those aimed at improving access and transparency – after the mid-August lows and after recording net foreign portfolio outflows of USD12.7bn in the last four weeks of August, according to the IIF. We expect a positive performance for the MSCI China benchmark (around +5% from now until year-end) as markets also reassess with a more measured analysis of the latest data – indeed both on-shore and off-shore benchmarks have rebounded, showing some signs of a change in sentiment, which in any case will need to be substantiated with the measures’ effectiveness. However, the medium-term outlook remains subdued due to declining structural growth and global political instability.
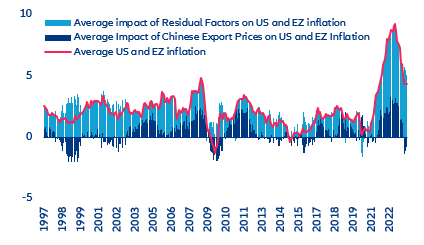
Rather than slowing the global economy, China is exporting deflation. Consumer and producer prices have been on a deflationary trend since the beginning of 2023. China’s producer price index fell by -4.4% y/y in July while inflation turned negative for the first time since the beginning of 2021. We expect inflation in China to average +0.4% in 2023 and +1.7% in 2024. While these developments can be a cause for domestic concern, it may bring some relief to advanced economies. For China, we find that in y/y terms, a -1pp decrease in PPI drives a -0.9pp decrease in export prices two months later. A -1pp decrease in export prices decelerates inflation in the US and Eurozone by -0.2pp in the same month. Hence, China will continue to be a negative contributor to US and Eurozone inflation. Since June, it has subtracted around -1pp on average from y/y inflation against a peak of +3pps in mid-2022 (Figure 11).
Figure 11: Average impact of Chinese export prices on US and Eurozone inflation, pp
Sources: National sources, Refinitiv, Allianz Research
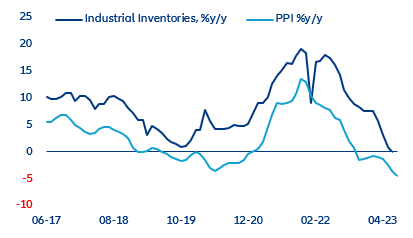
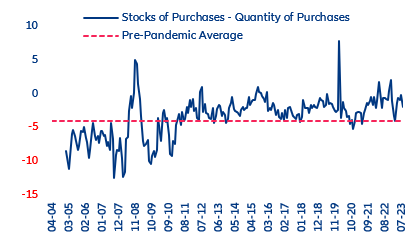
With the massive destocking process in the manufacturing sector behind us, we expect a (moderate) pick-up in production and new orders in the fall. Overcapacities in the manufacturing sector are currently being reduced (Figure 12) but we believe a further adjustment is needed (Figure 13). In addition, prospects for external demand are less deteriorated as real wage growth is turning positive in advanced economies. However, industrial goods will continue to be impacted by low investment prospects abroad. Hence, absorbing excess capacities will take time.
Figure 12: Industrial inventories vs PPI, y/y
Sources: National sources, Bloomberg, Allianz Research
Figure 13: Over-capacity in the manufacturing sector
Sources: Official sources, Refinitiv, Allianz Research
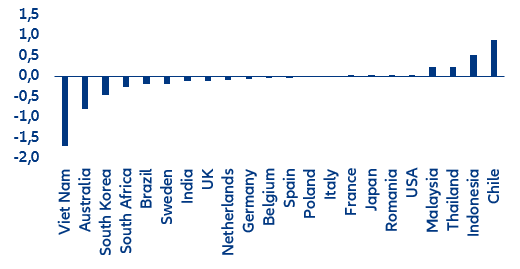
Overall, we expect GDP growth at +5.3% in 2023 (-0.5pp revision) and +4.7% in 2024. In 2023, most of the downside revision comes from lower private consumption growth, lower investment growth as well as slower import growth. Since the pandemic, major economies have reduced their dependency on the Chinese consumer. Looking at the evolution of the average annual contribution to GDP growth from Chinese imports, we find that most economies (notably Vietnam, Australia, South Korea, South Africa and Brazil) have reduced their annual average exposure to Chinese demand. However, Chile, Indonesia, Thailand and Malaysia are now more dependent (Figure 14).
Figure 14: Average annual contribution to GDP growth from Chinese imports, change 2022 vs 2019, pp (top 20 import markets for China & selected markets)
Sources: ITC, Allianz Research
Authors
Ludovic Subran
Allianz Investment Management SE
Roberta Fortes
Allianz Trade
Maria Latorre
Allianz Trade
Bjoern Griesbach
Allianz Investment Management SE
Maxime Lemerle
Allianz Trade
Pablo Espinosa-Uriel
Allianz SE
Ano Kuhanathan
Allianz Trade
Nikhil Sebastian
Allianz Trade