In focus – Commercial real estate concerns for US banks

  • Some US banks remain under pressure, especially those with large exposure to commercial real estate (CRE). The office sector in particular has come under market stress. While CRE credit risk has remained stable so far, declining market valuations have resulted in more stringent lending standards, especially for smaller US banks, which hold a disproportionately large share of CRE loans. In parallel, credit demand has noticeably weakened.
  • Potential risks from CRE extend beyond the banking sector. CRE-related fixed-income public markets have already corrected by about 20-30%, with increasing differentiation depending on credit quality. Similarly, CRE-related equities have declined in value and Real Estate Investment Trusts, despite being more liquid, have sold off after redemption pressures from investors.
  • The impact of CRE losses call for increased scrutiny. Rising impairments of CRE exposures weighing on solvency would further constrain lending activity and complicate the Federal Reserve’s job in keeping a restrictive monetary stance; such an adverse scenario is also likely to further test the resolve of policymakers to shore up investor confidence if more banks book rising unrealized losses from fixed-income holdings.

The collapse of Silicon Valley Bank and Signature Bank in the US, as well as UBS’s takeover of Credit Suisse, have raised the specter of increasing vulnerabilities in the financial sector to rising interest rates amid slowing growth. While most attention has focused on advanced economies, we take a closer look at the implications of restrictive monetary policy on banks in emerging markets (and potential spillover effects). Such banks tend to be more vulnerable due their stronger focus on domestic markets and closer linkage to fiscal conditions (due to high government debt exposures and political influence), which tends to result in highly pro-cyclical credit-growth dynamics.

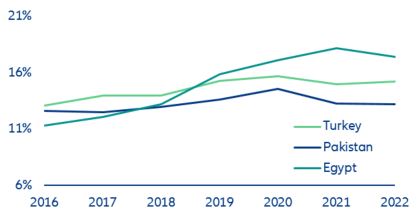
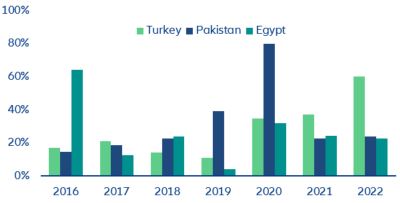
Over the recent months, strong credit growth in several EMs with high internal and external imbalances – Türkiye, Pakistan , and Egypt – raise alarm bells (Figure 1). Banks from Türkiye, Pakistan and Egypt have close ties to their local governments due to financial repression. As a result, credit growth was mainly politically driven as local governments had higher demands for additional money. The government of President Erdogan in Türkiye has been trying to stimulate economic growth using unorthodox measures of boosting credit. Consequently, the key interest rate was lowered several times. In Pakistan, strong credit growth was due to more sovereign borrowing (with sovereign debt accounting for around 40% of total banking assets in June 2022) as well as additional support programs for SMEs. Similarly, lending to the state or state-related companies has significantly increased in Egypt.

Figure 1: Credit Growth

Figure 1: Credit Growth
Sources: Refinitiv Datastream, Allianz Research

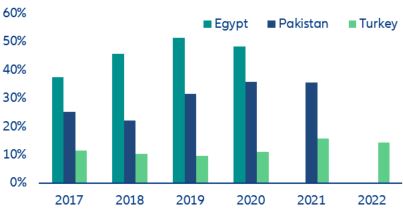
In these countries, banks are particularly vulnerable to interest rate and sovereign risks. Banks in all three countries have sufficient liquidity and capital buffers – for now (Figures 2 and 3).

Figure 2: Tier 1 capital ratio

Figure 2: Tier 1 Ratio
Sources: Refinitiv Datastream, Allianz Research
Figure 3: Liquid asset ratio
Figures 3: Liquid Asset Ratio
Sources: Refinitiv Datastream, Allianz Research

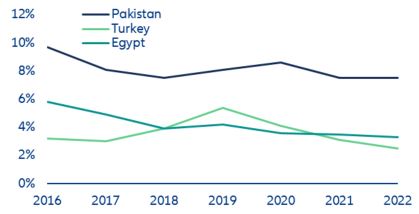
Banks in both Türkiye and Egypt also show relatively low non-performing-loan (NPL) ratios, although these are upward biased due to strong credit growth, which inflates the denominator of the ratio. Pandemic-related forbearance measures have also kept recorded impairments at bay. In Pakistan, such measures are still in place for SMEs, while the set-up for Türkiye has already been withdrawn (Figure 4). Banks have large holdings of government bonds, which exposes them to high counterparty risk (from payment arrears of sovereign debtors) but also interest rate risk (as central banks keep fighting inflation).

Figure 4: Non-performing loan (NPL)

Figure 4: Non-performing loan (NPL)
Sources: Refinitiv, Allianz Research.

Rising FX risk could become a challenge for Turkish banks. In Türkiye, 57% of deposits are dominated in foreign currency. In this context, banks could come under increasing pressure if the domestic lira deteriorates further, especially as the Turkish government is unlikely to be able to support even state-owned banks. Furthermore, there is the potential, albeit unlikely under Erdogan's government, risk of an increase in key interest rates, which in turn could lead to significant write-downs in the securities portfolio.

In both Egypt and Pakistan, sovereign risk has now become more acute. Given the large holdings of government bonds by domestic banks, sovereign defaults would have a catastrophic impact. Both Egypt and Pakistan have some of the highest government-debt ratios (Egypt: 98.4%; Pakistan: 89.6%). Credit-rating agencies recently lowered Egypt's sovereign rating, citing the country's reduced external buffers and shock-absorption capacity. In the case of Pakistan, the latest external rating was CCC- by Fitch, which is just one notch above default grade. In the absence of a sovereign default, even a further rise in interest rate risks could lead to massive write-downs in securities portfolios, which in addition to liquidity could also put a strain on the capitalization of banks.

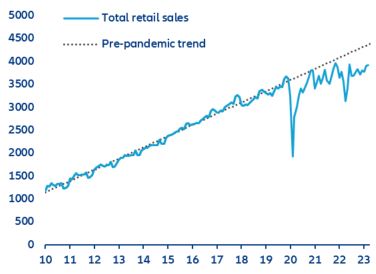
China’s post-Covid recovery: stronger-than-expected so far, but mostly domestic and hiding some uneven developments. China’s real GDP exceeded expectations in Q1 2023, growing by +2.2% q/q and +4.5% y/y, after +0.6% q/q and +2.9% y/y in Q4 2022. The sectoral breakdown suggests that higher growth was mainly driven by the services sector, while activity in agriculture, manufacturing and construction moderated in Q1 2023. Other monthly indicators also suggest a stronger-than-expected trade balance (i.e. resilient exports but still weak imports). There now seems even clearer room for an upside revision to our +5.0% real GDP growth forecast for 2023. The recovery story remains focused on consumption, though it is likely to be mostly domestic (i.e. firms operating in China benefiting more than those exporting to China) and the largest impulse from pent-up demand is likely to be felt in the first half of the year. We continue to think that structural issues (e.g. concerning the real estate sector and youth unemployment) mean that consumer spending will take longer to approach its pre-pandemic trend than in 2021 (Figure 4).

Figure 5: Retail sales (RMB bn)

Figure 5: Retail sales (RMB bn)
Sources: National Bureau of Statistics of China, Allianz Research

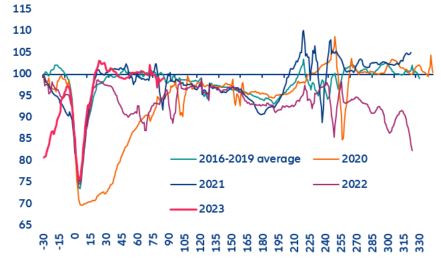
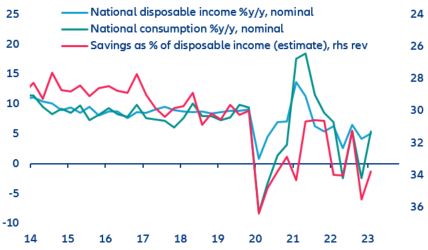
Chinese consumers: a quick return to the streets in Q1, but spending and saving behaviors not back to normal. The post-Covid reopening has been quick, with particular exuberance in February before a return-to-normal more recently. Mobility in the top 100 cities was +10% higher than the pre-pandemic average in February (after -11% in Q4 2022 and -13% in January 2023), before normalizing to -1% in March and -1.4% in the first half of April (Figure 5). Data show that this return to the streets was accompanied by improving consumer spending: +5.4% y/y in Q1 2023 after -2.4% in Q4 2022 (and +1.8% for the full year). This was slightly higher than the rate of growth of disposable income. We estimate that Chinese households’ saving rate declined to 33.8% in Q1 2023 from 35.5% in Q4 2022 (Figure 6). That said, it still remains above the pre-pandemic average of 29.1%, and we doubt that Chinese households will dig into the relatively small stash of excess savings accumulated during lockdown periods to fund consumption. Indeed, we estimate that excess savings accumulated in 2020 and 2022 amount to only 2.7% of 2023 nominal GDP. Furthermore, in 2021, the year of the post-Covid consumer rebound, we estimate that the decline in savings amounted to just 3.6% of 2020’s excess savings.

Figure 6: Traffic-congestion index (population-weighted average of 100 cities, 100 = 30 days before Chinese New Year)

Figure 6: Traffic-congestion index (population-weighted average of 100 cities, 100 = 30 days before Chinese New Year)
Sources: Macrobond, Allianz Research.
Figure 7: Household income, consumption and savings
Sources: : National Bureau of Statistics of China, Allianz Research.

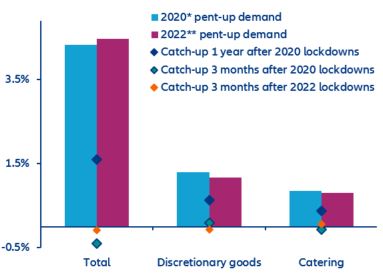
Pent-up demand amounts to 4.5% of GDP, but less than 40% is likely to be released and the largest impulse will be felt in the first half of 2023. Looking at the retail sales data, we find that under the zero-Covid policies of 2022, RMB5.6trn (4.5% of 2023E nominal GDP) of pent-up demand was accumulated. RMB1.5trn (1.2% of 2023E nominal GDP) was in discretionary goods and RMB1trn (0.8% of 2023E nominal GDP) in catering. These amounts of pent-up demand (as a percentage of nominal GDP) are very close to those we estimate for the 2020 lockdowns (see Figure 7). Back then, in the year that followed, 37% of total pent-up demand was released. The ratio is 49% for discretionary goods and 44% for catering. Furthermore, three-quarters of the catch-up was done in the first six months. Based on this experience, the largest impulse from pent-up demand this time around is likely to be felt in the first half of this year. The boost to consumer spending could ultimately prove to be smaller than in the post-2020 experience, given the current less favorable domestic and external macroeconomic conditions. We note already that consumer spending this time around seems so far supported by revenge spending in catering, while spending on discretionary goods is not performing as well as it did in the post-2020 period.

Figure 8: Pent-up demand and catch-ups (% of following year’s nominal GDP)

Figure 8: Pent-up demand and catch-ups (% of following year’s nominal GDP)
Sources: National Bureau of Statistics of China, Allianz Research. Note: */ We take the period in 2020 when total retail sales performed the worst, i.e. between January and August 2020. **/ We take the period in 2022 when total retail sales performed the worst, i.e. between March and December 2022.

President Macron’s roadmap for new reforms falls well short of tackling France’s long-standing structural issues. In a televised speech broadcast on Monday, Macron committed to tackling long-standing structural gaps, such as the deterioration of educational attainment, but also to address growing social discontent over the cost-of-living crisis. He called for renewed social negotiation between trade unions and corporates over wages, careers, better sharing of wealth and senior employment. Prime Minister Elisabeth Borne is expected to reveal a precise reform roadmap as early as next week. However, we doubt it will seriously address France’s structural economic bottlenecks, including the high level of taxation, the elevated yet deteriorating quality of public spending, the low employment rate and low and deteriorating education and skills attainment. Tackling these issues has become even more politically difficult since the passing of the pension reform, which has heightened political and social tensions. In particular, the usage of Article 49.3 of the Constitution – which allows the Government to pass (mostly finance) bills without the backing of Parliament – has become highly sensitive, crystallizing tensions during the passing of the pension reform.

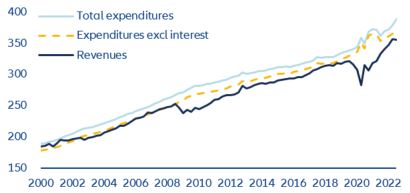
The benefits of the post-pandemic rebound and higher inflation to public finances are fading fast. The French public deficit narrowed relatively rapidly in the aftermath of the pandemic from -9% of GDP in 2020 to -4.7% in 2022. However, the bulk of the improvement was cyclical, owing to the economy’s post-Covid rebound and high inflation, which boosted revenue receipts (Figure 8). Elevated inflation instantly bolsters revenue intakes such as VAT collections, which are collected on a nominal base. The very robust pace of job creation also boosted social-contribution collections. On the other hand, expenditures typically take longer to increase since the indexation of transfers (such as pensions) to inflation is implemented with a lag (and often times only partially indexed), owing to legislative and calendar constraints.

Figure 9: Quarterly public expenditures and revenues (EUR bn)

Figure 9: Quarterly public expenditures and revenues (EUR bn)
Sources: Refinitiv Datastream, Allianz Research

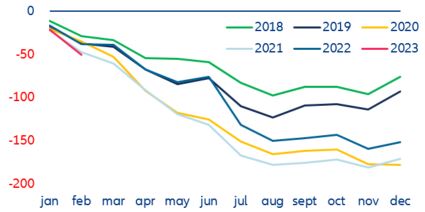
With the corrosive impact of inflation on growth increasing over time, and the government stepping in to mitigate the effect of inflation on household and corporate incomes, high price pressures will inevitably lead to a deterioration of public finances. France’s economy has been losing momentum since the second half of last year, while the government has been stepping up its response to the energy crisis through lower taxes, cost-of-living adjustments and higher fiscal transfers to households and corporates. Expenditures are increasing at a faster pace while revenue collection is flattening (Figure 8, latest data only available through Q3 2022). The more recent monthly data published by the French Budget Office in the Ministry of Finance show that through February the cumulative government finances shortfall hit more than EUR50bn (Figure 9) – a level comparable to 2021 when the public deficit ended at -6.5% of GDP. Corporation tax and VAT receipts are falling rapidly on a year-on-year basis, though income-tax collections are holding up thus far.

Figure 10: Monthly cumulated public finances shortfall (EUR bn)

Figure 10: Monthly cumulated public finances shortfall (EUR bn)
Sources: Refinitiv Datastream, Allianz Research

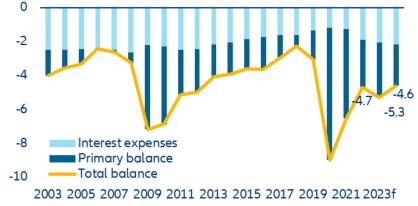
We expect the public deficit to widen to -5.3% of GDP in 2023, before narrowing to -4.6% in 2024. The higher deficit from last year is consistent with (i) an economy that is decelerating rapidly (we expect real GDP to nudge up by a meagre +0.4% this year, after +2.6% in 2022) and (ii) stepped-up government intervention to alleviate the effects of the energy crisis on incomes. Discretionary budget cuts and the exceptional levy on utilities’ profits (estimated to bring in EUR5bn-EUR7bn) should limit the widening of the primary deficit to -3.2% (from an estimated -2.8% in 2022). Net interest payments should increase from around 1.9% of GDP in 2022 (EUR50bn) to 2.1% in 2023 (EUR57.5bn) as higher funding costs continue to feed through. However, while increasing from a trough of 1.1% in 2020 to 1.8% at the end of 2022 (and 2.0% expected in 2023), the effective interest rate that the French state pays to its creditors is still very low. This is because only a fraction of the public debt is rolled over every year, with the average duration of French government bonds at 8.5 years.

In 2024, we expect the headline deficit to narrow to -4.6% (Figure 10). We think the French government will deliver a sizeable consolidation of its finances (about 1% of GDP) as EU fiscal rules should kick back in and interest payments continue to increase. The government will probably cut back on the various aids to businesses rolled out during the energy crisis, and could also seek new sources of revenues, such as a temporary levy on ‘super profits’ as hinted by President Macron a few weeks ago. Fiscal tightening will weigh on the French economy’s short-term recovery prospects. We expect real GDP growth to step up in 2024 but by an underwhelming +0.8%.

Figure 11: Public deficit forecast (% GDP)

Figure 11: Public deficit forecast (% GDP)
Sources: Refinitiv Datastream, Allianz Research

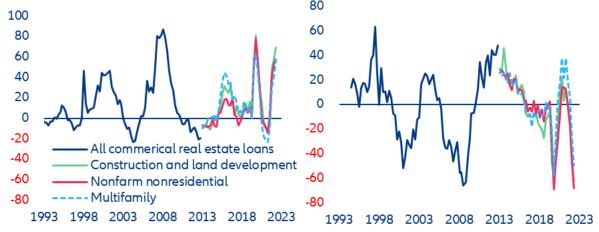
While the recent turbulence in the US banking sector turbulence seems contained for now, restrictive monetary policy could still create dislocations in funding markets and raise pressure on banks with widening asset-liabilities mismatches and large exposures to illiquid assets, such as commercial real estate (CRE). Smaller US banks in particular hold a disproportionately large share of CRE, which is highly sensitive to cyclical pressures. Higher borrowing costs and persistent economic uncertainty have been a drag on the real estate market, notably the commercial segment. While CRE credit risk has remained stable so far, market valuations have deteriorated sharply, which has resulted in more stringent lending standards for all types of real estate loans (Figure 12, left). Credit demand has also noticeably weakened (Figure 12, right).

Figure 12: Federal Reserve Senior Loan Officer Opinion Survey (SLOOS) - share of banks tightening standards for commercial real estate loans (left) and domestic respondents reporting stronger demand for CRE loans (right) (%)

Figure 12: Federal Reserve Senior Loan Officer Opinion Survey (SLOOS) - share of banks tightening standards for commercial real estate loans (left) and domestic respondents reporting stronger demand for CRE loans (right) (%)
Sources: US Federal Reserve, Allianz Research. Note: shared legend.

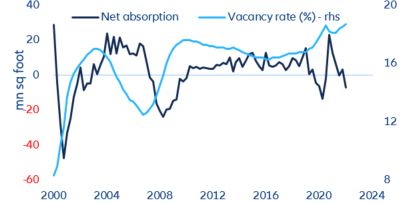
The office sector in particular, which never fully-recovered from the pandemic shock, has come under market stress. As part of general cost-cutting measures, many companies have not only frozen hiring (or laid off staff in some sectors) but also reduced their office footprint to lower fixed costs. With a higher share of the workforce working remotely, the vacancy rate of available office space has increased from 16.8% at the beginning of 2020 to 18.7% at the beginning of 2023. The net absorption is already negative (Figure 13), and office properties have lost value due to declining rental income; this trend is likely to continue.

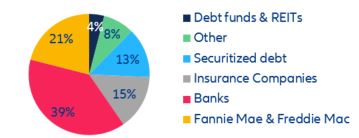
Banks are most exposed to the recent valuation changes in CRE (Figure 14). Despite the painful lessons learnt from the fallout of the US subprime mortgage crisis (and the more stringent regulatory requirements associated with the Dodd-Frank Act), real-estate-related credit growth has far outstripped nominal GDP growth in the US. The outstanding stock of mortgage loans increased from USD3,480bn in mid-2011 to USD5,390bn at end-2022 (+55%), of which more than half is for CRE, which also accounts for the  rapid expansion of real estate-related credit.

Figure 13: US – office market developments

Figure 13: US – office market developments
Sources: REIS Inc, Refinitiv, Allianz Research
Figure 14: US – commercial property debt (USD4.5trn, by owner)
Sources: Mortgage Bankers Association, Bloomberg, Allianz Research

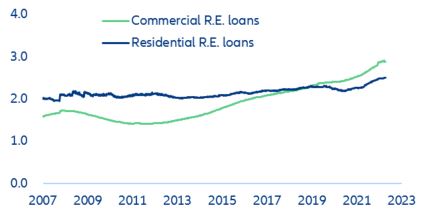
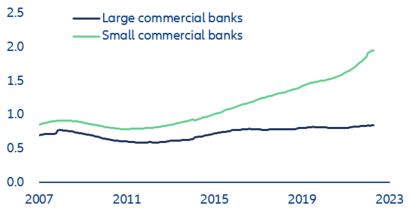
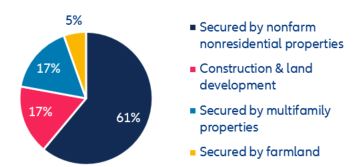
Small and regional banks have become relatively more exposed to CRE (Figures 15-17). Small, often state-chartered banks account for 70% of total CRE lending (USD2,897bn). More than half of CRE loans are secured by non-farm, non-residential properties, which tend to be riskier. Conversely, multi-family properties (17% of market share) are generally safer and have a historical credit performance similar to that of residential real estate (which has also not suffered from the post-pandemic trend of offices closing).

Figure 15: US – real estate lending (in USD trn, all commercial banks, by destination of funds)

Figure 15: US – real estate lending (in USD trn, all commercial banks, by destination of funds)
Sources: US Federal Reserve, Allianz Research. RRE: Residential Real Estate.
Figure 16: US – commercial real estate loans (in USD trn, by size of lender)
Sources: US Federal Reserve, Allianz Research. RRE: Residential Real Estate.
Figure 17: US – composition of commercial [real estate loans by small banks (April 2023)
Figure 17: United States—composition of commercial real estate loans by small banks (April 2023)
Sources: US Federal Reserve, Allianz Research.

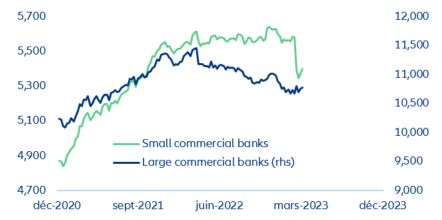
Deposit outflows have recently amplified the adverse impact of interest-rate hikes on banks with high CRE exposures. In early 2022, the CRE market was optimistic about the “back to office” policy of many companies, and many investors refinanced their CRE debt at low interest rates. However, as rates began to rise in the wake of Russia’s invasion of Ukraine, many smaller banks with fixed rate exposures were stuck with rising interest-rate losses, which did not go unnoticed. Long before Silicon Valley Bank and Signature Bank failed, smaller banks recorded steady deposit outflows, which picked up in early 2023. At the end of March, small US banks had lost a total of USD230bn of deposits (Figure 17). As economic activity continues to cool, banks are now facing a double whammy of a higher default risk of CRE loans and a sharp adjustment in valuations of CRE, while the cost of funding keeps rising and squeezes net interest margins.

Figure 18: Deposits (USD bn) at small and large US commercial banks

Figure 18: Deposits ($USD billions) at small and large US commercial banks
Sources: US Federal Reserve, Allianz Research.

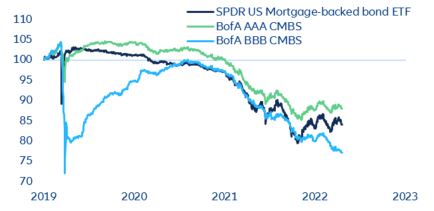
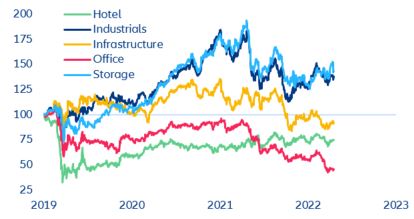
However, potential risks from CRE extend beyond the banking sector. CRE-related fixed-income (FI) public markets have already corrected by about 20-30% since interest rates began to rise (Figure 18), with increasing differentiation depending on credit quality. Similarly, CRE-related equities have declined in value and Real Estate Investment Trusts, despite being more liquid, have sold off after redemption pressures from investors. The storage and industrial sub-sectors have performed somewhat better (Figure 19).

Figure 19: US – CMBS bond indices (indexed, 31/12/2019 = 100)

Figure 19: US – CMBS bond indices (indexed, 31/12/2019 = 100)
Sources: Refinitiv Datastream, Allianz Research. Notes: Price return indexes, US law prevents many public funds from investing in CMBS below certain grades.
Figure 20: US – commercial REIT indices (indexed, 31/12/2019 = 100)
Figure 20: United States—commercial REIT indices (indexed, 31/12/2019 = 100)
Sources: Refinitiv Datastream, Allianz Research

Going forward, we expect gradually rising pressures on CRE amid tighter financing conditions and still high economic uncertainty. So far, the low liquidity of some CRE assets has delayed – but not prevented – a deeper correction. More CRE loans are likely to become impaired but this process is bound to be gradual due to the longer duration and bank incentives to delay loss recognition by ever-greening loans. While CRE loan impairments stand at pre-pandemic lows, the asset quality is likely to deteriorate if the US economy slips into recession during the second half of the year (based on our recent growth forecast); however, the rise of default rates will depend on the severity of the economic downturn and vary across CRE segments.

The impact of CRE losses could spill over to the wider economy via the bank channel. Less than a month ago, we warned of the impending credit crunch in the US[1]. Since smaller banks are particularly vulnerable to losses coming from their CRE portfolios, more conservative lending practices, including tighter underwriting standards, would limit the credit availability to the broader economy. Rising impairments of CRE exposures weighing on solvency would further constrain lending activity and complicate the Federal Reserve’s job in keeping a restrictive monetary stance; such an adverse scenario is also likely to further test the resolve of policymakers to shore up investor confidence if more banks book rising unrealized losses from fixed-income holdings.