The container shipping industry is benefiting from record-high freight rates

Shipping: liners swimming in money but supply chains sinking

20 September 2022

EXECUTIVE SUMMARY

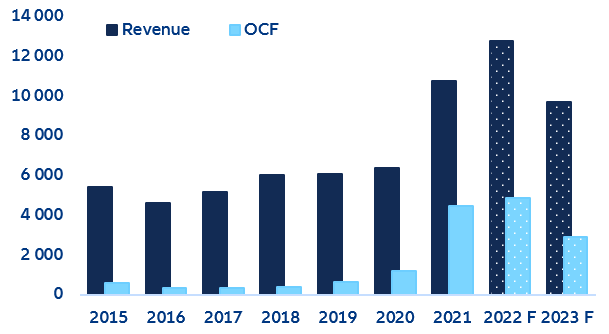
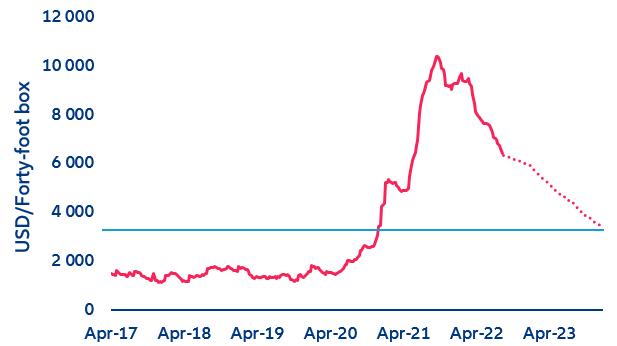
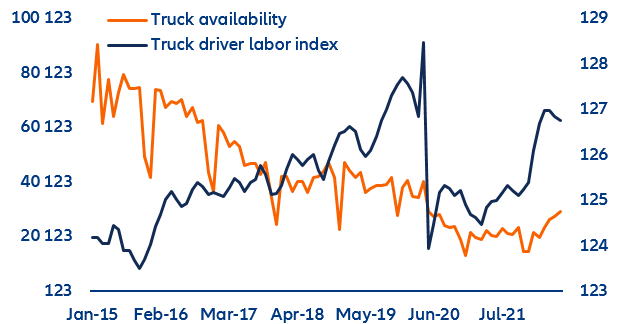
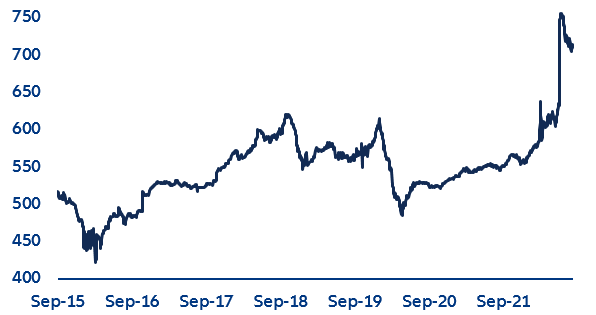
  • 2022 will be a record year for container shipping companies. We expect the sector’s revenue to jump by +19% y/y and its operating cash flow to grow by +8% y/y. While freight rates have fallen -32% year-to-date, they are still well above the pre-pandemic average (USD6,400/forty-ft box vs. USD1,450/forty-foot box). Freight rates are likely to remain elevated in 2023 (USD 4,550/forty-foot box), given the delayed delivery of new vessels, new regulations on CO2 emissions, continued truck-driver shortages and higher prices for fuel, containers and vessels.
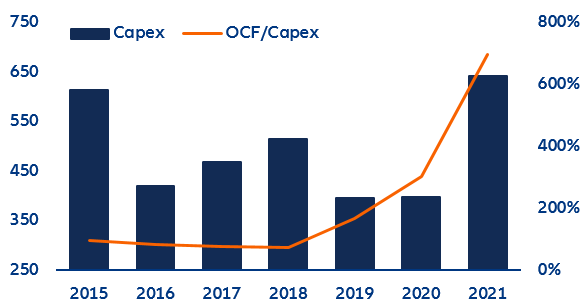
  • Higher-than-expected cash generation has helped liners comply with new ESG standards (with investments growing by +61% y/y in 2021). In addition, gross debt fell -5% y/y in 2021 and we expect companies to deleverage further in 2022 and 2023 (-16% and -11% y/y, respectively), which will be crucial in a context of increasing interest rates.
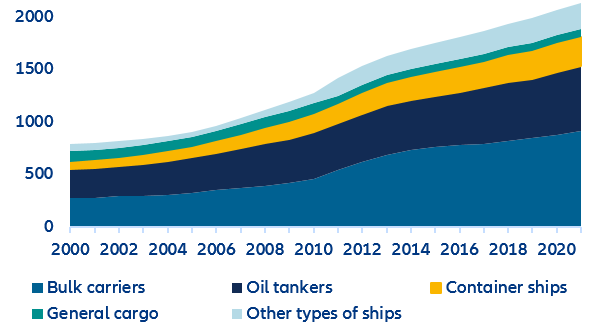
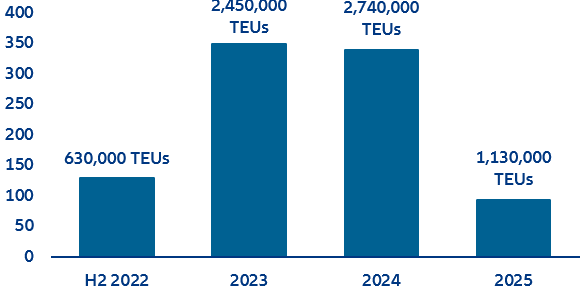
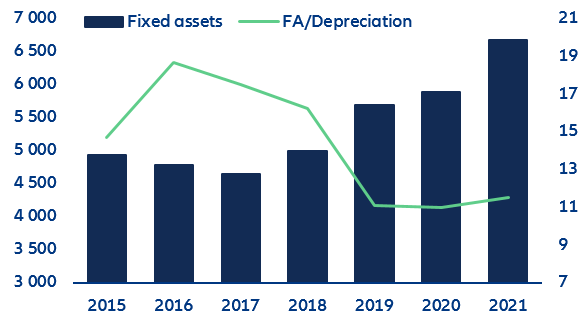
  • However, despite increased capital expenditures (capex), shipping capacity will not increase as much as expected nor as fast as desired. The recent investment efforts, although huge, have not been in line with the sector’s capability (cash from operations grew by +274% in 2021 on average) and most of the capex increase is explained by the fact that the price of new vessels doubled last year, not because of larger new orders. In addition, while 35% of orders should be delivered in 2023 and 39% in 2024, these ships are likely to modernize the fleet instead of fully expanding it as IMO 2023 regulations force companies to retire older ships.

Freight rates will not return to pre-pandemic levels in the short-term.

After almost doubling its revenues in 2021, the global container shipping sector is heading for another record year as freight rates show no sign of returning to pre-pandemic levels in the short term. Considering a sample of 30 global shipping companies, the sector’s average revenue growth rate was +70% y/y in 2021, totaling around USD11bn per company. The average net profit came to USD3.5bn, particularly high for a sector that barely reached breakeven during the past five years.

Figure 1: Average revenue and operating cash flow (OCF) of the global industry (USD mn)

Figure 1: Average revenue and operating cash flow (OCF) of the global industry (USD mn)
Sources: Bloomberg, Allianz Research

Both volume and prices played a role in these record results, but freights rate were and continue to be the growth engine. In terms of volume, the global trade of merchandise grew by +9.8% y/y in 2021 (vs a contraction of -5.0% in 2020 and a pre-pandemic average pace of +1.6%); in the last 12 months, volume has grown by +5.0%. In terms of prices, the quicker-than-expected recovery of economic activity triggered a record increase in shipping demand that pushed freight rates up a staggering +113% by December 2021. In September 2021, they hit a never-before-seen peak of USD10,377/forty-foot box (the pre-pandemic average was around USD1,450 USD/forty-foot box).

Figure 2: World container index composite (eight routes) freight benchmark rate

Figure 2: World container index composite (eight routes) freight benchmark rate
Sources: Bloomberg, Allianz Research
At the same time, the global port congestion that began from the end of 2020 also contributed to drive up freight rates: The time spent at ports in the first half of 2021 was +11% higher compared to the pre-pandemic average, reducing the number of ships in circulation.

Figure 3: Number of ships (greater than 5,000 DWT) seen at a location on a daily basis
Sources: Bloomberg, Allianz Research

In parallel, the price of many commodities began to rise, including the steel used to make containers. As a result, the price of containers also jumped, moving from an average of USD80/TEU  before the pandemic to USD180/TEU. Today, even if steel prices have been plunging towards “normal” levels, containers remain expensive, which suggests that demand for maritime transportation is still high and logistics bottlenecks still persist.

Figure 4: China* domestic steel price (CNY/MT, lhs) vs container price (USD/TEU, rhs)

Figure 4: China* domestic steel price (CNY/MT, lhs) vs container price (USD/TEU, rhs)

Sources: Bloomberg, Allianz Research.

*China is the home of the world’s top 10 largest container manufacturers, accounting for 85% of the world’s total shipping-container production.

To a lesser extent, the increase in freight rates can also be explained by other factors such as the shortage of HGV  drivers, especially in Europe and the US, and the higher bunker oil prices.

1.    Even before 2020, truck drivers were leaving their jobs worldwide due to unfair pay and poor work conditions. The “great resignation” phenomenon was so exacerbated by the Covid-19 pandemic that North America reported being short of around 80,000 truck drivers. Europe needs 400,000 . This shortage means goods cannot be fluidly transported from ports to warehouses/plants, creating an accumulation of inventories in the ports that makes logistics even more difficult.

Figure 5: Truck availability (lhs) and truck driver labor index* (rhs) in the US

Figure 5: Truck availability (lhs) and truck driver labor index* (rhs) in the US

Sources: Bloomberg, Allianz Research.

*The index measures the pool of people available to be hired as drivers. This is not the number of truck drivers but rather the estimated pool of possible drivers.

2.    Bunker fuel or heavy fuel oil (HFO), a derivative residue from crude oil distillation and the most used fuel in shipping has become more expensive, with prices soaring +45% in 2021. The price of marine gas oil, another commonly used fuel in the industry, has jumped by +27% year to date, while the price of greener fuels such as LSMGO  and VLSFO  have jumped by +56% and +26%, respectively. These increasing prices will continue to influence freight rates as fueling represents around 16% of shipping companies’ operating costs.

Figure 6: Average* price of marine gas oil (USD/MT)

Sources: Bloomberg, Allianz Research.

*Average includes: Singapore, Houston, Rotterdam, Mumbai, Shanghai, Los Angeles, South Korea, Istanbul and Las Palmas.

In 2022, profits are likely to be even better as freight rates remained very high at the start of the year (around USD9,500/forty-foot box between January to March) because of persisting supply-chain pressures. The rates started to decline in April (average pace of -1.4% weekly), and should fall further in the coming months. Yet, we estimate they will still remain above the historical average (USD1,450/forty-foot box) in the second half of 2022 and even throughout 2023: an average of USD7,350/forty-foot box for the full-year 2022 and USD4,550/forty-foot box for 2023.

Figure 7: Global supply-chain pressure index

Figure 7: Global supply-chain pressure index
Sources: Refinitiv Eikon Datastream, Allianz Research

Despite more orders for new ships, maritime congestion isn’t going anywhere.

Flush with cash, the sector has stepped up orders of new ships: Average capex grew by +61% y/y in 2021 and fixed assets grew by +13% y/y to around USD6.7bn, albeit due in part to the soaring prices of new vessels (a brand-new Panamax, for instance, became +200% more expensive in 2021 and +43% in 2022). However, these new orders will not dramatically increase global shipping capacity as the green transition forces companies to retire old vessels that do not comply with current and upcoming international regulations for sulphur (IMO 2020) and carbon (IMO 2023) emissions (see annex). As a result, we expect that the sector’s increasing capital investments will modernize fleets rather than fully expanding them.

Figure 8: World fleet size (millions of DWT) by vessel type

Figure 8: World fleet size (millions of DWT) by vessel type
Sources: UNCTAD, Allianz Research

In addition, most of the ships recently ordered (which should be delivered between 2023 and 2024) are vessels with relatively low capacity, ranging between 1,000-3,000 TEUs (in comparison, a New-Panamax has a capacity of 12,500 TEU). We should also keep in mind that nearly 60% of the fleet in use today is chartered and 40% is owned, so we can expect companies to play with this proportion in order to keep capacity and prices at a level that allows them to maintain relatively high margins.

Figure 9: Number of container ships on order by year of delivery

Figure 9: Number of container ships on order by year of delivery
Sources: American Shipper, Clarksons, Allianz Research
In fact, shipping companies do have a lot more room to invest in renewing and/or expanding their fleets. The capex ratio (OCF over capex) used to be close to 100% before the pandemic, meaning that companies were keen to invest as much as possible in new assets. This ratio soared to 300% in 2020 and to almost 700% in 2021, which means companies had huge headroom for potential additional investments that could have been made, especially given that depreciation has been on the rise (+4.6% y/y in 2020 and +12.1% y/y in 2021) as the global fleet ages. Today, the trading container fleet has an average age of 21.4 years ; for reference, the technical lifetime of this kind of ship usually ranges from 25 to 30 years. Old vessels are not only less valuable but also represent an extra expense since they are less fuel-efficient and adapting them for the use of greener fuels or for scrubber  installments is more expensive (or even impossible) than retrofitting a newer vessel (see annex).

Figure 10: Average capex (USD mn, lhs) and operating cash flow over capex ratio (rhs)
Sources: Bloomberg, Allianz Research
Figure 11: Fixed-assets (USD mn, lhs) vs fixed assets over depreciation expenses ratio (rhs)
Sources: Bloomberg, Allianz Research

At the same time, companies are facing increasing pressure to switch to more expensive greener fuels (such as LNG , methanol, LSFO /VLSFO or LSMGO), which will raise their fuel bills further (container vessels consumer the most energy).
And as interest rates rise, cash outflows are also expected in the short-term for debt repayment. As a capital-intensive industry, shipping relies heavily on financial debt (debt-to-EBITDA ratio of 6.6x on average between 2015 and 2019). Unexpectedly, despite having collected huge amounts of cash in 2020 (+16% y/y) and 2021 (+162% y/y), the sector’s average gross debt was reduced only by -3% y/y in 2020 and -5% y/y in 2021. This will surely lead companies to allocate a considerable part of the extra cash generated from high freight rates for deleveraging: We estimate shipping companies will reduce their debt by around -16% y/y this year and by -11% in 2023. Put together, these two factors will reduce the cash available for business expansion.

Figure 12: Shipping sector average level of debt (USD mn)

Figure 12: Shipping sector average level of debt (USD mn)
Sources: Bloomberg, Allianz Research. *As the sector relies widely on leased vessels, 2019 debt was enlarged due to the introduction of IFRS-16 accounting rules, under which leases have to be recognized in the balance sheet in the form of a right-of-use asset and offset with a lease liability.