Executive summary

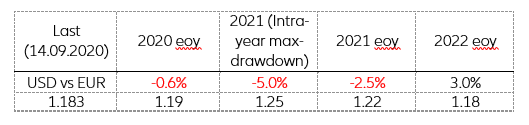
After its peak on 20 March 2020, the USD has depreciated 10% against the EUR (1.174 as of 21 September 2020), going back to levels last seen in mid-2018. This rapid depreciation has raised many questions about the future of the dollar. Though forecasting exchange rates is a form of Holy Grail for forecasters, we decided stick our neck out and present our methodology that separates short- and long-term factors affecting the price determination of the EUR/USD exchange rate, and our results:

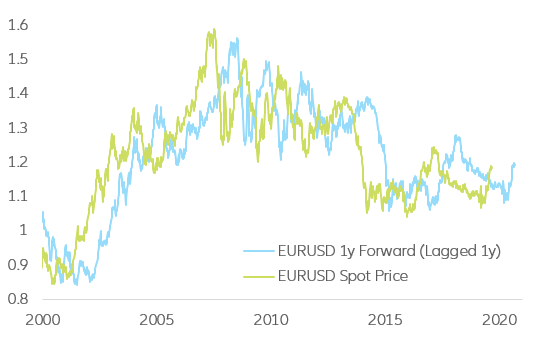
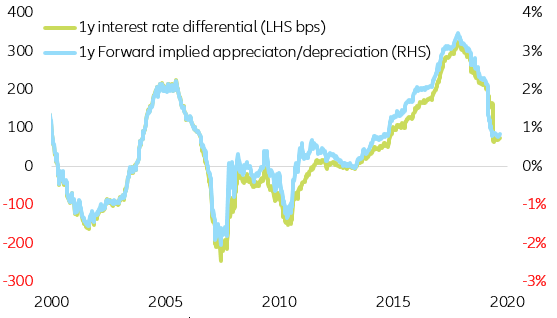
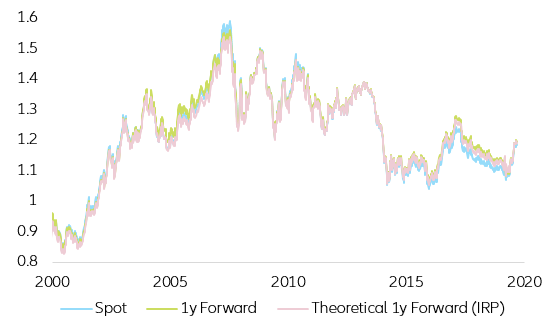
  • Due to the recent anchoring of both USD and EUR short-end of the curves, by their respective central banks, Forward EUR/USD rates contain no relevant information about the future path of the EUR/USD exchange rate.
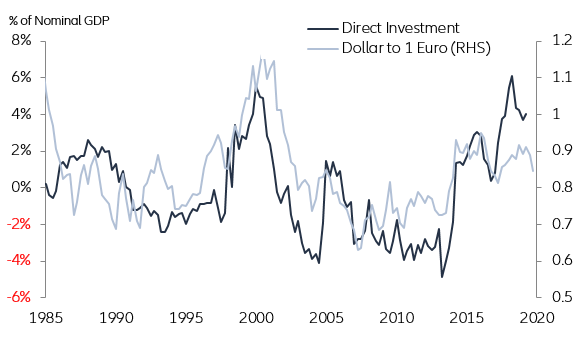
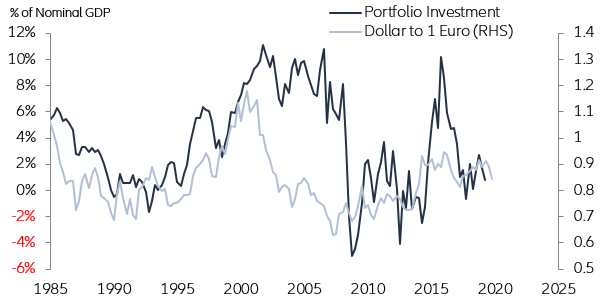
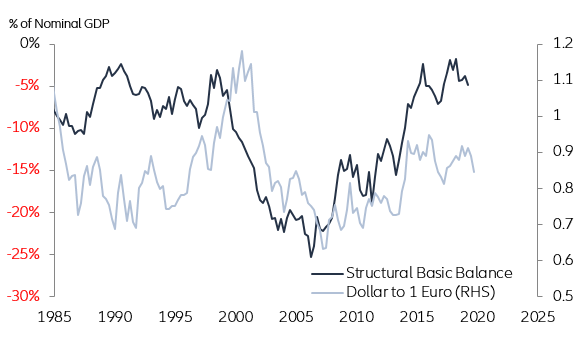
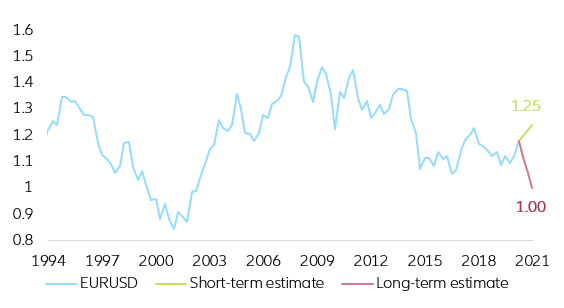
  • Our modeling approach based on the U.S. balance of payments hints at a mild appreciation of the USD vs. the EUR in the mid- to long-term (converging towards parity in the long-run). Nevertheless, this methodology does not reveal much information about short-term developments.
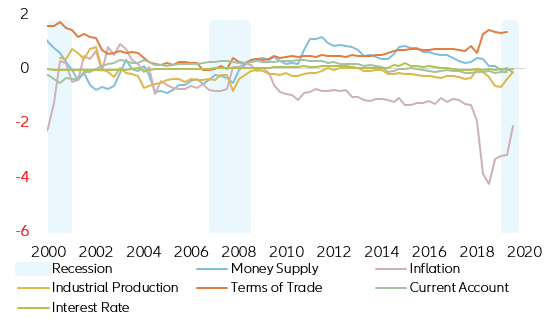
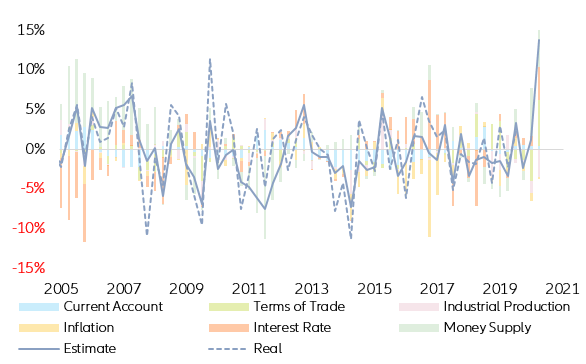
  • Our monetary model suggests that if current economic and financial dynamics do not suddenly change, the dollar is set to depreciate versus the EUR by up to 5% (~1.25) within the next 12 months. Yet, it also suggests that if the U.S. would start reverting to pre-Covid-19 dynamics, the EUR/USD would start a slow but steady climb towards parity.
  • Overall, by combining both balance of payments and monetary approaches, and under the assumptions that the Covid-19 economic shock is set to fade away in 2021-2022 and that U.S. funding dynamics are set to slowly converge to pre-Covid-19 trends, we conclude that the USD can depreciate by as much as 5% (~1.25) in the next 12 months. Thereafter, it could resume its upward trajectory, slowly converging at a 2 to 3% annual rate towards parity.

Market forwards

When trying to forecast currencies, a traditional and widely used approach is to look at FX forward markets. Theoretically this approach makes a lot of sense, as it shows at what price you can hedge your future EUR/USD exposure over different time horizons. However, does the forward price contain relevant information about the future path of the EUR/USD? Does the overused sentence “The forward market is pricing ….” bring anything to the table?

Historically the forecasting power of the EUR/USD forward market, especially in short-term horizons, is very limited (Figure 1). One just has to compare the forward implied spot rate with the realized spot rate to see that the estimate is inaccurate not only in terms of level but also, most of the time, in terms of direction.

Figure 1. EUR/USD 1y Forward

Figure 1. EUR/USD 1y Forward
Sources: Allianz Research, Refinitiv


Why is this the case? Do forward market traders not have any view on the outlook of the currency pair? The answer to that question is relatively simple: most market makers use the non-arbitrage interest rate parity approach  (or similar) to price forwards. (Example: 1y EUR/USD forward rate)

EURUSD 1y Forwardt = EURUSD Spott* (1+1y EMU yield/1+1y UST yield)

From the formula above, it can be derived that when using such a methodology, the right-hand side of the equation (in blue) is the one expected to include the 1y ahead expected economic outlooks of both the U.S. and the EMU. This holds true as it is a representation of the interest rate differential between two countries/regions (Figure 2).  

Figure 2. EMU – UST 1y interest rate differential vs EUR/USD 1y FWD  

Figure 2. EMU – UST 1y interest rate differential vs EUR/USD 1y FWD
Sources: Allianz Research, Refinitiv
However, as shown in Figure 3, the right-hand side equation value tends to vary extremely slowly when dealing with developed market currencies (e.g. EUR, USD). Nevertheless, it is warranted to mention that this value can become extremely relevant when dealing with Emerging Market currencies as their interest rate differentials can be extremely volatile (e.g. Turkey).

Figure 3. Right-hand side of the 1y Forward Formula (vs UST)
Sources: Allianz Research, Refinitiv
Nevertheless, in the case of the EUR/USD, and in the current context of lower-for-longer short-term rates, the right hand side of the Forward equation is likely to remain anchored and follow a pseudo-constant type of behavior in the near future.

In this context, the above-mentioned Forward pricing formula is likely to remain:

EURUSD 1y Forwardt=EURUSD Spott*(~1.015)

Consequently, the 1y Forward price is and will only be determined by the current Spot price, meaning that there is no relevant information embedded in the 1y Forward price of the EUR/USD as long as the 1y interest rate differential remains locked by both the U.S. Federal Reserve and the ECB. So, let us forget EUR/USD Forwards for the time being!

Figure 4: 1y EUR/USD Forward and Theoretical 1y Forward  
Figure 4: 1y EUR/USD Forward and Theoretical 1y Forward
Sources: Allianz Research, Refinitiv

The balance of payments approach

Another strategy is to take a funding approach to the EUR/USD forecasting problematic. More specifically, to look at the Balance of Payments and how its components affect the EUR/USD.

Why the balance of payments? By taking this supply and demand approach, we are able to see how many dollars the U.S. offers to the rest of the world and who is buying them. At a basic balance level , whenever the Balance of Payments registers a purchase of a foreign asset or a sale of a domestic commodity abroad, this implicitly indicates that there is a change in the demand for or in the supply of the foreign currency. In other words, the international transaction cannot be completed unless one of the parties of the transaction is willing to exchange his/her domestic currency for foreign currency.

Taking the above into account, and according to our proprietary modeling, the most relevant components of the Balance of payments that directly influence the price discovery of the EUR/USD exchange rate are direct investment, portfolio investment and the structural basic balance because they influence the supply of dollar-denominated cash balances and fluctuate more than the current account.

Following the direct investment relationship with the EUR/USD, it can be asserted that current EUR/USD levels are not fully consistent (i.e. too low) with the direct investment influx that the U.S. has been experiencing over the past four years. From this long-term relationship it can be inferred (subject to changes in Q2 2020 data) that unless we experience a massive structural decline in inflows for a prolonged period of time, the persistent direct investment inflows into the U.S. should support the dollar in the mid- to long-run.

Figure 5. Direct Investment Balance

Figure 5. Direct Investment Balance
Sources: Allianz Research, U.S. Department of Congress
Similarly, but with less accuracy, portfolio investment flows tend to coincide with EUR/USD movements. In this context, and under the premise that the U.S. economy will accelerate faster than its neighbors in the mid- to long-term, it can be inferred that this expected influx of investment capital may prove supportive of a stronger dollar. Nevertheless, it needs to be stressed that although these portfolio transactions are reputed to be of a long-term nature, they are potentially very unstable as there is nothing easier to trade than an American Treasury bond. In this context, if there was to be a structural change in the way the economic situation was perceived in the U.S. compared to rest of the world, this source of funds would undoubtedly decelerate.

Figure 6. Portfolio Investment Balance
Sources: Allianz Research, U.S. Department of Congress
Lastly, the structural basic balance metric, which takes into account the current account, the direct investment and the statistical discrepancy, has proved to be a good leading indicator of EUR/USD changes in the mid- to long-term trend as it tends to herald peaks and troughs in the exchange rate (partly because it reflects changes in the direct investment balance).

Structural Basic Balance = Current Account + Direct Investment + Statistical Discrepancy

Figure 7. Structural Basic Balance
Sources: Allianz Research, U.S. Department of Congress

Overall, by combining the three afore-mentioned measures, the Balance of Payments approach hints towards a mild appreciation of the USD versus the EUR in the mid- to long-term (2 to 3% appreciation per year vs the EUR) but it does not speak much about the short-term developments of the currency pair.

The multivariate approach 

In order to tackle the short-term fluctuations of the EUR/USD exchange rate, a traditional multivariate approach is necessary. With this stratagem, we manage to unveil the short-term determinants of the EUR/USD exchange rate, while, as in the case of the Balance of Payments approach, getting some vague idea about the long-term developments.  

In order to do that, we have developed a proprietary Adapted Monetary Model . This monetary model includes six variables in differential terms (U.S. value minus EMU value) and is lagged 12 months (forecasts are computed using data from 12 months ago). The set of variables comprises money supply (M2), 3m interest rate, the inflation rate, industrial production, terms of trade and the current account as a percentage of GDP.

However, before digging into the multivariate approach it is worth performing a short-term one-by-one analysis (Figure 8) as it gives some insights about the structural relationships between those single variables and the EUR/USD exchange rate.

Figure 8: 3y rolling one-by-one coefficients vs EUR/USD

Figure 8: 3y rolling one-by-one coefficients vs EUR/USD
Sources: Allianz Research, Refinitiv
From this short-term one-by-one regression analysis, it is revealing that most variables are not able to remain stable over the whole length of the stimation window. Some of those variables even switch signs depending on the nature of the underlying financial cycle. (e.g.  Inflation coefficient went from being positive (+1) in 2002 to extremely negative (-4) in 2018).

Due to this persistent coefficient volatility, and in order to separate the short from the long-term drivers, we estimate the multivariate model using two different estimation windows (3y and 10y). This way, we are able to separate short- from long-term determinants, irrespective of the embedded volatility of the single estimators.

Figure 9. 3y rolling multivariate regression (QoQ changes)
Sources: Allianz Research, Refinitiv
At first glance it appears that, once again, the short-term determinants of the EUR/USD exchange rate may switch through time and a structural model may be out of reach (multivariate coefficients vary through time especially within the 3y estimation window). However, we believe that this approach contains sensitive information as per the underlying drivers of short-term movements and its direct effect on the EUR/USD exchange rate (Figure 9). According to our model, both interest rates and money supply components are behind the recent dollar depreciation (Quantitative Easing), while current account and inflation components have yet to contribute.

Figure 10. Short- and Long-term EUR/USD estimates*
Sources: Allianz Research, Refinitiv. *Short-term refers to a 3y rolling window while long-term refers to a 10y rolling window.
The model suggests that if current economic and financial dynamics do not suddenly change, the USD is set to depreciate against the EUR by up to 5% (~1.24) within the next 12 months (as shown by the 3y rolling / short-term estimate).

On the other hand, the rather unstable long-term “structural” estimate (10y rolling or long-term estimate) suggests that if the U.S. was to revert towards its pre-Covid-19 trajectory in the mid- to long-term, the USD could appreciate as far as parity (Figure 10). This last long-term forecast, although extreme, is consistent with the Balance of Payments approach.

Overall, by combining both balance of payments and monetary approaches, and under the assumptions that the Covid-19 economic shock is set to fade away in 2021-2022 and that U.S. funding dynamics are set to slowly converge to pre-Covid-19 trends, we conclude that the USD can depreciate by as much as 5% (~1.25) in the next 12 months. Thereafter, it could resume its upward trajectory, slowly converging at a 2 to 3% annual rate towards parity.

Table 1. EUR/USD Forecasts
Source: Allianz Research
Jordi Basco Carrera
Fixed Income Strategist