Executive Summary

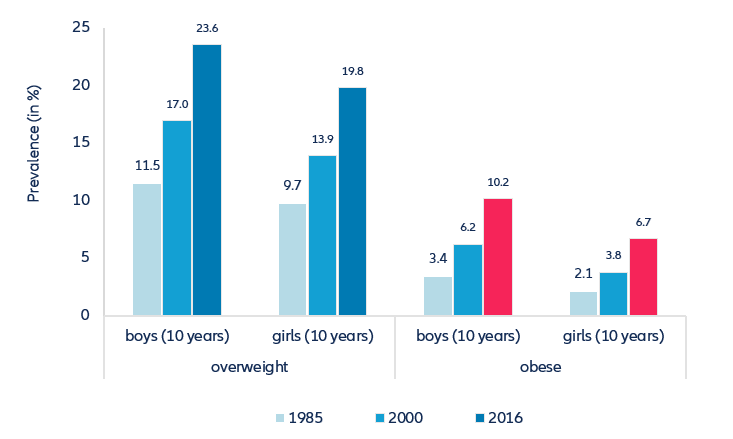
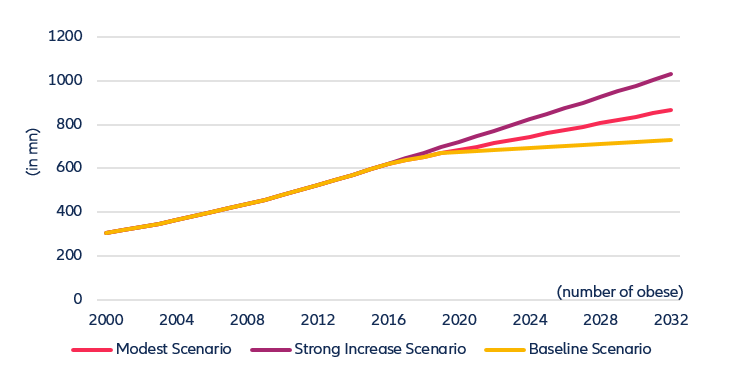
  • The share of people who are overweight and obese has been increasing markedly, even in poorer countries, a trend that was likely amplified by the lockdowns imposed during the Covid-19 pandemic. Furthermore, rising prices for fruits and vegetables make a healthy diet unaffordable for an increasing share of the population. In 2032, more than 1bn people worldwide could be obese, up from 650mn in 2016.
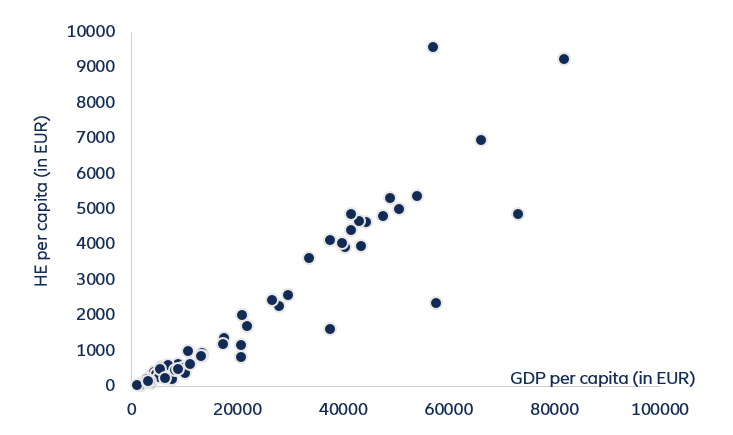
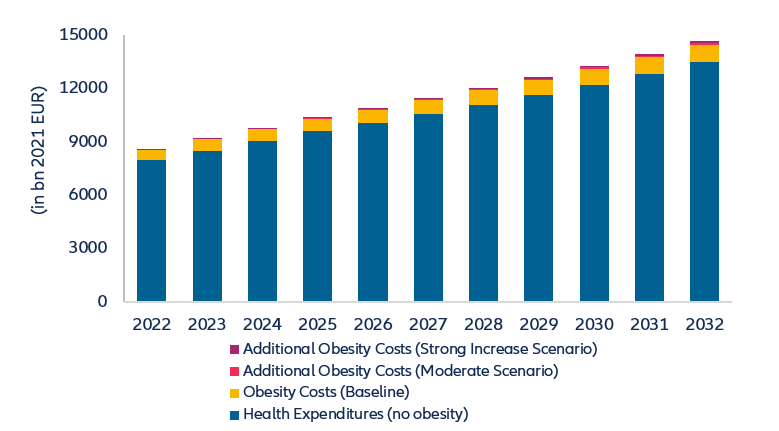
  • Obesity already accounts for an estimated 6.8% of total health expenditures as it is a major risk factor for type 2 diabetes, strokes and cardiovascular diseases. Based on our health expenditure projections, we estimate that obesity-related health expenditures could reach EUR1.2trn corresponding to 8.1% of total health expenditures in 2032, driving the accumulated additional health expenditures for the 10-year period up to EUR9.0trn.
  • Combined efforts are needed to support healthier lifestyles. The recommendations to achieve this goal range from taxing sugary beverages to the use of health apps, insurance tariffs rewarding a healthy lifestyle and changes in investor behavior, who could take a leaf out of the climate action book, encouraging food producers and processors to disclose their “sugar footprint”, too, with the clear intention to lower it over time.

The unfolding of an epidemic

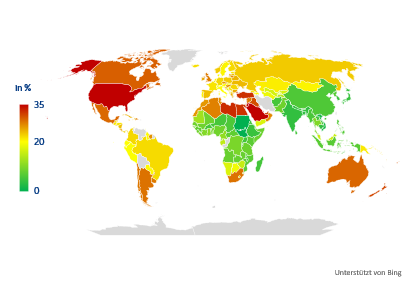
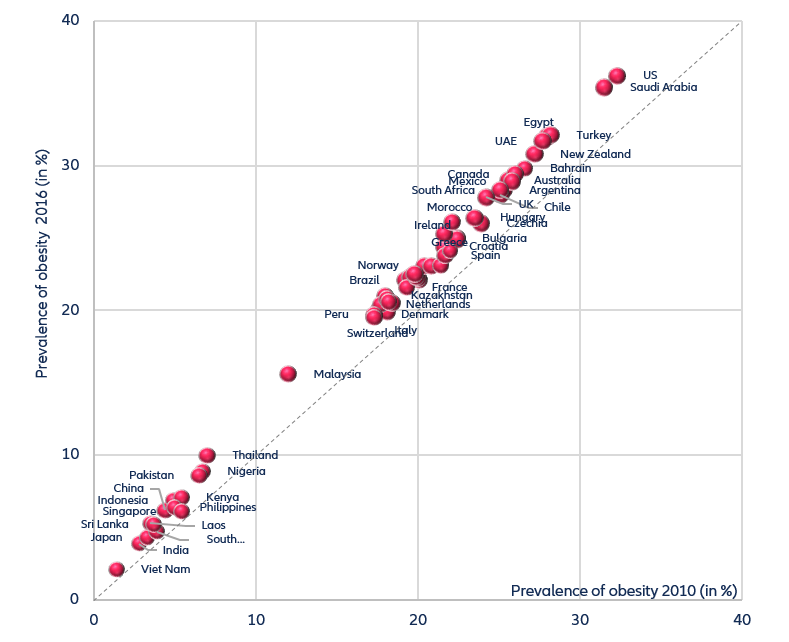
The combination of increasingly sedentary lifestyles and the increased consumption of high-calorie food has led to a rising share of overweight and obese  people worldwide. The World Health Organization (WHO) estimates that more than 650mn adults  are obese. The differences between and within the regions are, however, very pronounced. In North America, North Africa and the Middle East, as well as in Mexico, Argentina, Australia and New Zealand, between 30% and 40% of the population are obese. In Western Europe, the shares range between 20% and 25%, while in most Asian and African countries they are still below 10% (see Figure 1).

Figure 1: Marked differences in the prevalence of obesity

Figure 1: Marked differences in the prevalence of obesity
Sources: World Health Organization, Allianz Research

Current trends in the prevalence of obesity point towards a rising trend. The available data suggest that the Covid-19 pandemic amplified the trend as the lockdowns reduced the possibilities for physical activity, leading to an increase in the average weight and thus the average BMI in most countries. The highest weight gain was reported among people younger than 40 years. In Germany, for example, an average weight gain of 1kg was reported, implying an increase of the average BMI from 25.9 to 26.4.

Climate change and urbanization could also drive up the prevalence of obesity in the future, as higher outside temperatures caused by climate change tend to prevent outdoor physical activities, while extreme weather conditions could lead to higher prices of fruits and vegetables, making a healthy diet unaffordable for an increasing share of the population. The current food price inflation gives a foretaste of the expected future developments. The urbanization trend could amplify the epidemic, as the average BMI of populations living in urban areas is in general higher than that of the rural population, likely due to lower physical activity levels and less healthy diets due to the availability of take-away food for example.

Social factors and traditions might add to the prevalence of obesity as well since there are also striking differences by gender between regions. While in most western societies the prevalence of obesity is higher in the male population than in the female population, the opposite pattern in is observed in most African and Muslim countries, where physical activity for girls could be limited by social traditions.

However, the most alarming factor is the increasing prevalence of obesity among children and adolescents. In 2016, 10% of all 10-year-old boys were obese, up from 6% in 2000, and 7% of all girls, compared to 4% at the turn of the century. The prevalence of children who are overweight has also increased markedly: 24% of all 10-year-old boys and 20% of the girls in this age were overweight, compared to 17% and 14% in the year 2000. In our analyzed countries, the number of overweight children and adolescents increased from 42.8mn to 100.4mn in this time period (see Figure 2).

Figure 2: Marked increase in the prevalence of overweight and obesity among children and adolescents

Figure 2: Marked increase in the prevalence of overweight and obesity among children and adolescents
Source: NCD Risk Factor Collaboration Database 

Obesity is related to severe health risks. Obese people have an up to 80 times higher risk of developing type 2 diabetes and a markedly higher risk for suffering from coronary heart disease, strokes, certain forms of cancer and osteoarthritis compared to normal-weight peers for example. The Covid-19 pandemic put this fact into the spotlight as patients with a Body Mass Index of 30 and higher had a markedly higher risk of hospitalization, serious illness and death than normal-weight Covid-19 patients.

This implies not only a restriction of the quality of life of people suffering from obesity, but also higher direct health expenditures and indirect costs due to losses in economic productivity due to related illnesses. It is estimated that these costs add up to EUR1.8trn per year or 2.8% of global GDP. If there is no reversal of the obesity trend, health systems will not only have to cope with additional costs due to aging societies but also with a heavy additional financial burden stemming from obesity.

Obesity could account for 8.1% of total health expenditure by 2032, equivalent to EUR1.2trn

To calculate the additional health costs caused by obesity we added an obesity factor in our health expenditure model by assuming the average health costs for an obese person are 30% higher than for a non-obese  and by developing three scenarios about the future development of the prevalence of obesity based on WHO, NCD and UN data as well as our GDP forecasts.

According to the latest available WHO data, even before the outbreak of pandemic, global health expenditures had reached a record high EUR7.6trn, corresponding to almost 10% of global GDP. In the 58 countries that we cover in our analysis, health expenditures added up to EUR7.2trn or 95% of the global health expenditures. However, the largest share of this expenditure (44%) was spent in the US alone, 23% in Western Europe and 21% in Asia , with health expenditures per capita ranging from EUR34 in Pakistan to EUR9,580 in the US.

To calculate the future trajectory of health expenditure, we make two major assumptions: First, we assume that health costs per capita are driven by nominal GDP per capita, reflecting the close correlation of both factors (see Figure 3).

Figure 3: Health expenditure per capita and GDP per capita are positively correlated

Figure 3: Health expenditure per capita and GDP per capita are positively correlated
Source: WHO, IMF, UN Population Division, Refinitiv Eikon, Allianz Research

Second, we assume that the distribution of health costs by age groups remains constant over the next ten years. In general, health costs increase with age. In Switzerland, for example, health costs in the age group 80 and older were twice the average costs and seven times the costs in the youngest age group. Hence, the aging of societies will be another driver of future health costs.

By 2032, over 1bn people worldwide could be obese, up from 650mn in 2016.

With respect to the future development of the number of people suffering from obesity we developed three scenarios: in our baseline scenario we assumed that the 2016 prevalence of obesity in the different age groups remains constant and the future development of the number of obese reflects only population growth and the shifts in the age structure.

In our modest scenario we assumed that until 2032, the prevalence of obesity in the single age groups develop like between 2011 and 2016 in the respective country. The growth rates of the overall prevalence of obesity ranged from 7.9% in Russia, where the prevalence of obesity increased from 21.4% to 23.1% between 2010 and 2016, and 51.4% in Laos, where the share of obese people rose from 3.5% to 5.3% in this time span (see Figure 4). In our strong increase scenario, we assumed that the prevalence rates in the single age groups developed according to the growth rates over the ten-year period from 2006 to 2016.

Figure 4: Marked differences in the development of the prevalence of obesity

Figure 4: Marked differences in the development of the prevalence of obesity
Sources: WHO, NCD Risk Factor Collaboration, Allianz Research

Based on these assumptions in our baseline scenario the number of obese would increase to 730mn, lifting the overall prevalence of obesity from 10.6% in 2016 to 11.2% in 2032. In the modest scenario their number would increase to 866mn, corresponding to an overall prevalence of 13.3%, and in the strong increase scenario the total number would surpass the 1bn mark by reaching 1,029mn, lifting the prevalence to 15.8% (see Figure 5).

Figure 5: Obesity scenarios

Figure 5: Obesity scenarios
Source: Allianz Research.

Total health expenditures would increase from EUR7.2bn in 2019 to EUR14.2trn in our baseline scenario. Thereof EUR949bn or 6.7% would be costs caused by obesity, up from an estimated EUR485mn in 2019. Over the 10-year period these additional costs would add up to EUR7.8trn. In our modest scenario total health expenditures would increase to EUR14.3trn, with obesity costs amounting to EUR1.1trn or 7.4% of total health expenditures in 2032. Which would lift the accumulated additional obesity-related costs between 2022 and 2032 to EUR8.3trn. And in our strong increase scenario total health expenditures are set to increase to rounded EUR14.4trn, with obesity-caused expenditures amounting to EUR1.2trn or 8.1% of total health expenditures. The accumulated sum would reach EUR9.0trn (see Figure 6).

Figure 6: Health expenditure scenarios

Figure 6: Health expenditure scenarios
Sources: WHO, NCD Risk Factor Collaboration, UN Population Division, IMF, Refinitiv, Allianz Research
Of course, like in the case of the distribution of total health expenditures, there are also marked differences with regard to the distribution of the additional obesity driven health costs given the prevalence of obesity and the overall health expenditures in the different countries. In fact, in all scenarios 10 countries account for 83% of total obesity caused health expenditures. The bulk of these expenditures would incur in the US, were the obesity caused health costs would range between EUR564bn in the baseline scenario and EUR669bn in the strong increase scenario, corresponding to 59.4% and 57.7% of total obesity caused health expenditures (see Figure 7).

Figure 7: Split of additional obesity-driven health expenditures by country (modest scenario)
Sources: WHO, NCD Risk Factor Collaboration, UN Population Division, IMF, Refinitiv, Allianz Research

What does this mean for policymakers?

Against this background, combined efforts are needed to support healthier lifestyles, create lasting behavioral change in diets and encourage regular exercise. The recommendations range from the taxation of sugary beverages and snacks to the use of health apps, insurance tariffs rewarding healthy behavior and changes in investor behavior.

In fact, more than 30 countries have already imposed taxes to reduce the consumption of sugary drinks, including Australia, Canada, Chile, Colombia, France, India, Italy, Malaysia, Mexico, Saudi Arabia, South Africa, Thailand, the UAE, UK, some regions in the US, French Polynesia and Nauru. However, according to the latest available data, these measures have had only a limited effect. In Mexico, for example, not only has the average BMI of adults increased but also the share of obese and overweight children and adults.

Considering that many households simply cannot afford to buy healthier food, the reduction of taxes on vegetables, legumes and fruit might be more promising, especially against the background of the current food price inflation and expected price increases due to climate change. Subsidies for canteen food in schools, kindergartens or nursing homes to provide higher quality food could have the same effect, taking into account that for many children these facilities provide their main meal of the day. 

However, nutrition is only one side of the story; more exercise is the other. Many companies already encourage their employees to be more active by offering subsidies for fitness studios, bikes, yoga classes etc., however, it is not enough to offer these measures; employees also have to take them up without feeling forced to do so. Another challenge is to encourage children and already overweight or obese adults to exercise more. Health apps and health insurance tariffs that reward a healthy lifestyle are also a means of choice to support a healthier lifestyle. However, recent studies suggest that mHealth is not yet a stand-alone solution and cannot fully replace personal medical advice and support. This holds especially true, with respect to lasting changes in dietary habits. Furthermore, they still appeal especially to younger age groups and to people who already tend to have an active and health-conscious lifestyle.

So far, all these efforts have had only modest success, to put it mildly. The fight against obesity should therefore take a leaf out of the climate action book, harnessing the power of investors in driving change. In the future, alongside carbon footprints, food producers and processors might be encouraged to disclose their “sugar footprint”, too, with the clear intention to lower it over time. Investors could require such “sugar pathways to net-zero” and steer their investments accordingly. In the end, there is nothing else more sustainable and socially relevant than healthy food.