New government, old challenge. With the debt-to-GDP ratio likely to approach 100% of GDP by 2026, fiscal consolidation is top of the agenda for Brazil’s new government. Last week, the Ministry of Finance announced a new fiscal framework to replace the spending cap in place since 2017. The proposal limits the variation in expenditure to 70% of the variation in revenue observed over the previous 12 months (up to July). It also sets a floor and ceiling for real expenditure growth, which cannot be less than 0.6% or more than 2.5% per year. In addition, the framework provides for a primary surplus target (plus or minus 0.25%) and a mechanism to block expenditures in case of non-compliance. Thus, if the surplus crosses the upper limit of the band, it is used for investment in the following year. If it is below the floor, spending increases less in the following year: 50% of the increase in revenue. With the new rules, the government estimates that it can achieve a surplus by 2025.
The framework has several positives, but the devil is in the details. The limit on overheads, trigger for course correction and commitment to even save some revenue are all steps in the right direction. However, one of the main problems is the link between expenditure and revenue because it is very difficult to cut expenditure, much of which is fixed. Even discretionary spending is very difficult to cut, especially in times when tax revenues are growing less or even falling. The government has not yet laid out how exactly spending cuts will be made. For the new fiscal framework to be credible at a time of no GDP growth, it needs to be accompanied by expenditure reform.
As a result, the government will need to significantly increase its revenues. In recent years, Brazil’s government benefited from substantial revenues amid higher inflation, the commodity prices boom and the reopening of the economy after Covid-19 lockdowns. With these conditions unlikely to be repeated, the government will have to find new sources of revenue to meet the ambitious primary outcome targets that are important for stabilizing the public debt-to-GDP ratio.
According to Minister of Finance, revenue needs to increase by between R$100 billion and R$150 billion to make the plan credible and balance the public accounts. To achieve this goal, the government's strategy would be to tax those who don't pay taxes. Indeed, new measures are expected to be announced soon that will, among other things, increase taxation in new segments (e.g. electronic sports betting), tax investment funds and even try to reduce tax exemptions, although the latter is likely to be politically difficult to implement. For now, a tax increase is not being considered but cannot be completely ruled out in the medium term as the government will still have to contend with Congress and political lobbies over the other tax changes. It will also most likely try address the income tax framework in a second phase of the ongoing tax reform.
Overall, the framework could lead to very slow debt convergence. Success depends on a significant increase in revenues and/or an increase in real GDP growth, which we do not expect to exceed +2.5 % by 2026. Therefore, we think the government has been rather optimistic in setting the parameters for interest rates and real GDP growth, which suggests a likely adjustment in the primary surplus targets.
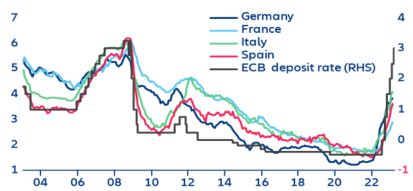
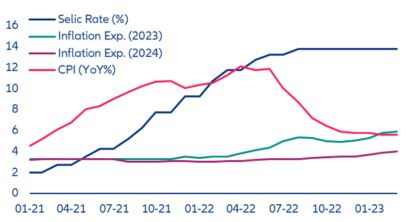
While markets reacted positively to the announcement – the BRL appreciated by 1.2% – it is too early to declare victory. As further clarifications are needed, we expect volatility in the short term. Meanwhile, despite government pressure on the central bank, we do not expect an immediate interest rate cut until a sound and credible fiscal framework is released and inflation expectations come down.
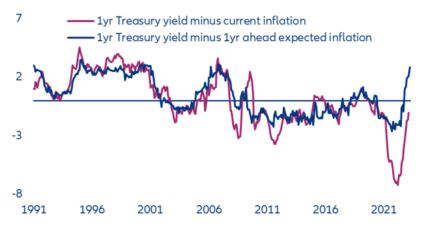
Figure 10: Brazil Interest rate and Inflation