Executive Summary

The US equity market rally since 23 March has surprised and wrong-footed more than one professional investor. We see four valid explanations for the current decoupling between the U.S. equity market and economic fundamentals.

  • Diverging expectations in the shape of economic recovery and economists’ consensus.
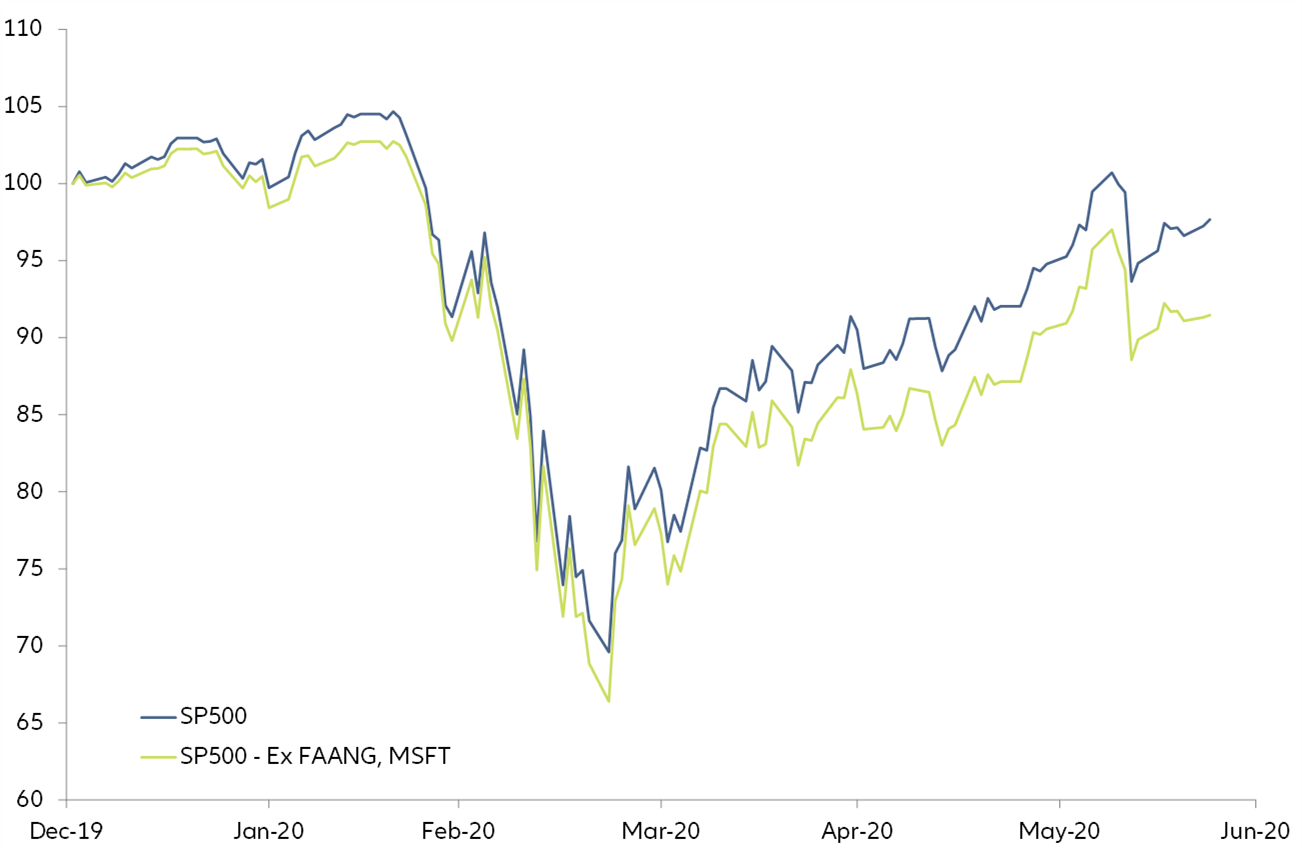
  • Diverging earnings expectations among sectors (technology) or stocks (FAANG).
  • “Pavlovian markets” only reacting to announcements of expansionary monetary and/or fiscal policy.
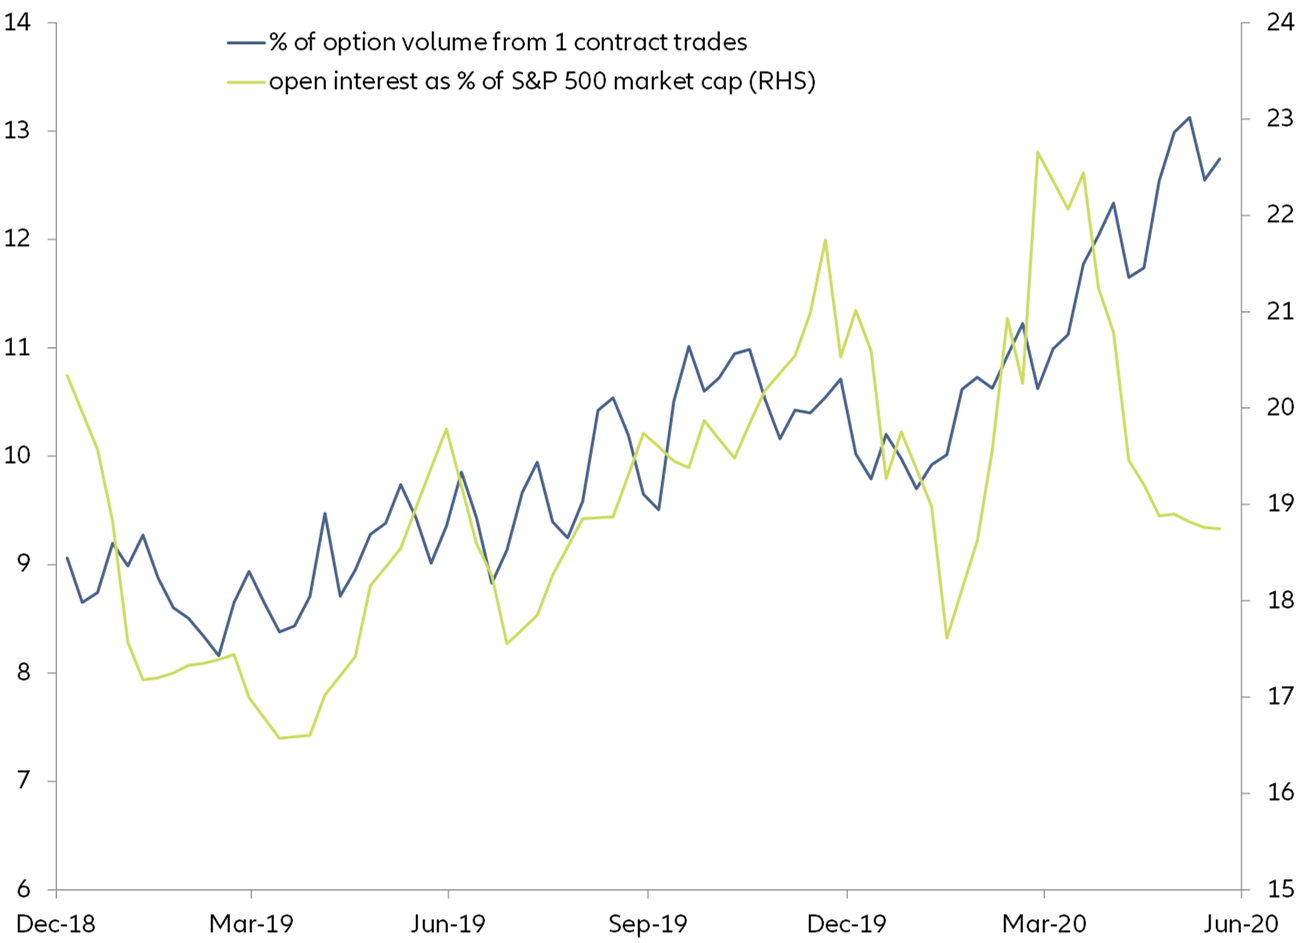
  • A technical rally, the momentum of which comes from the “new retailers” and is reinforced by systematic investment strategies.

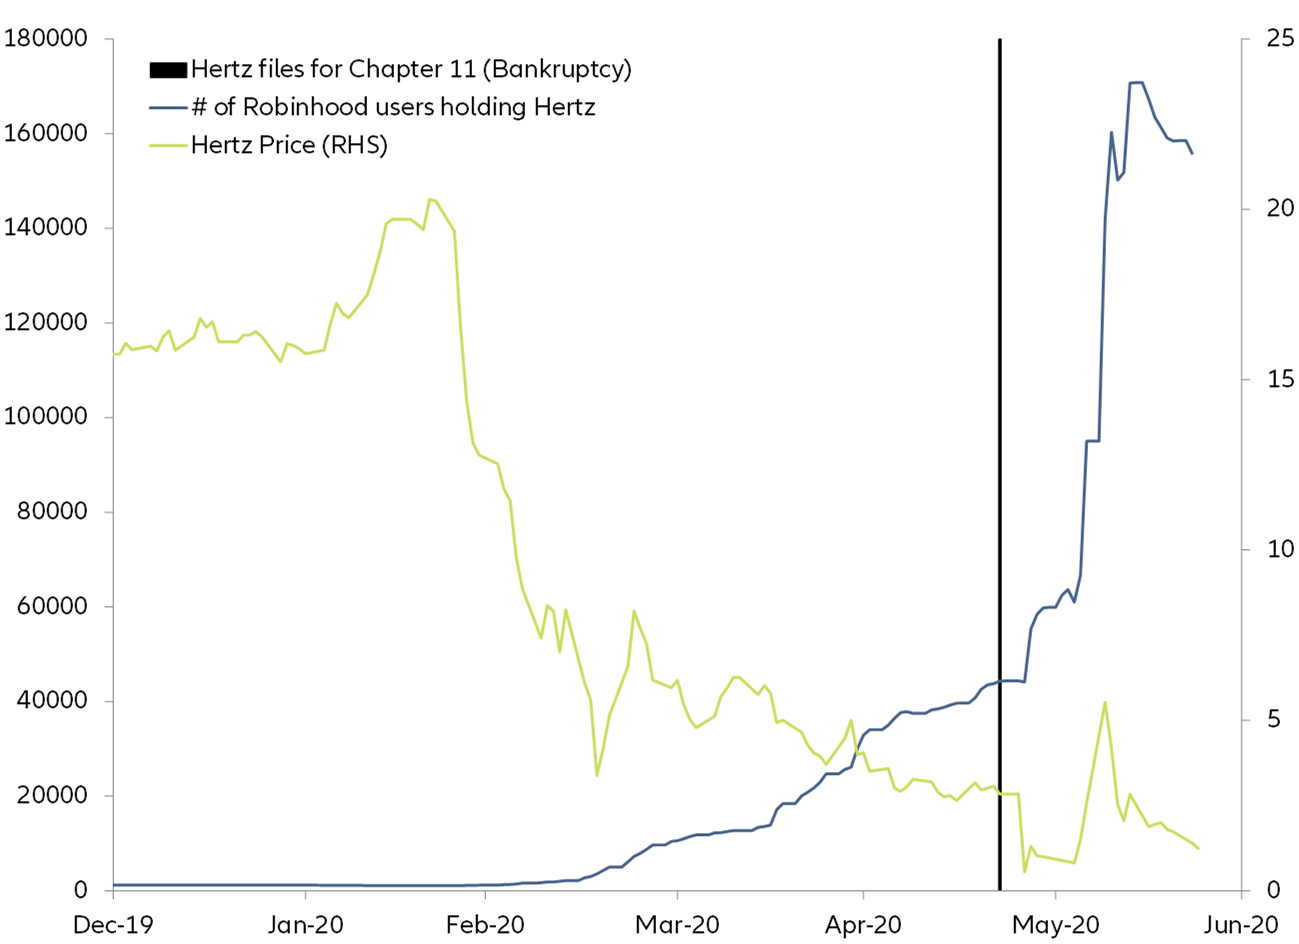
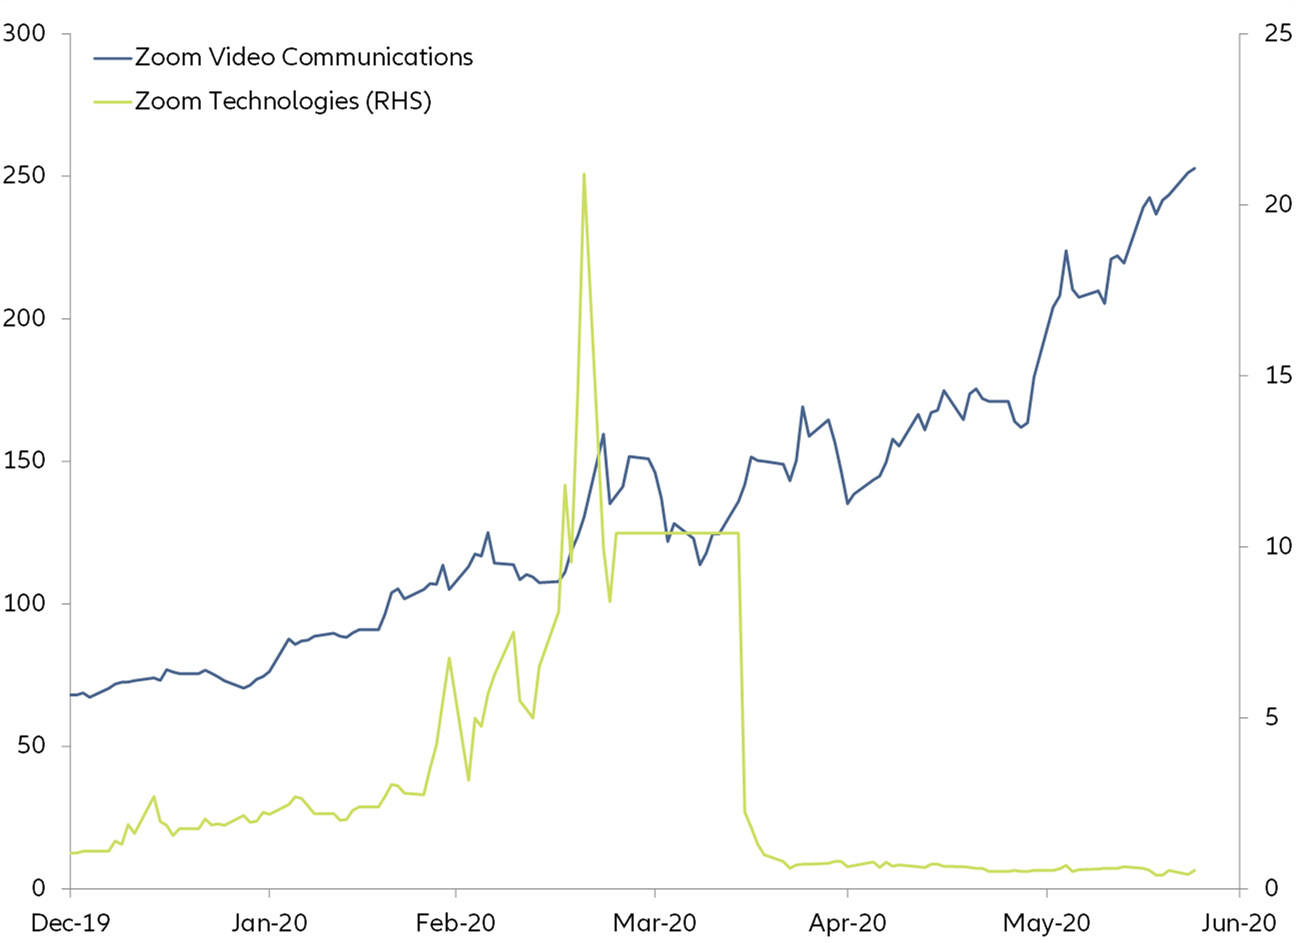
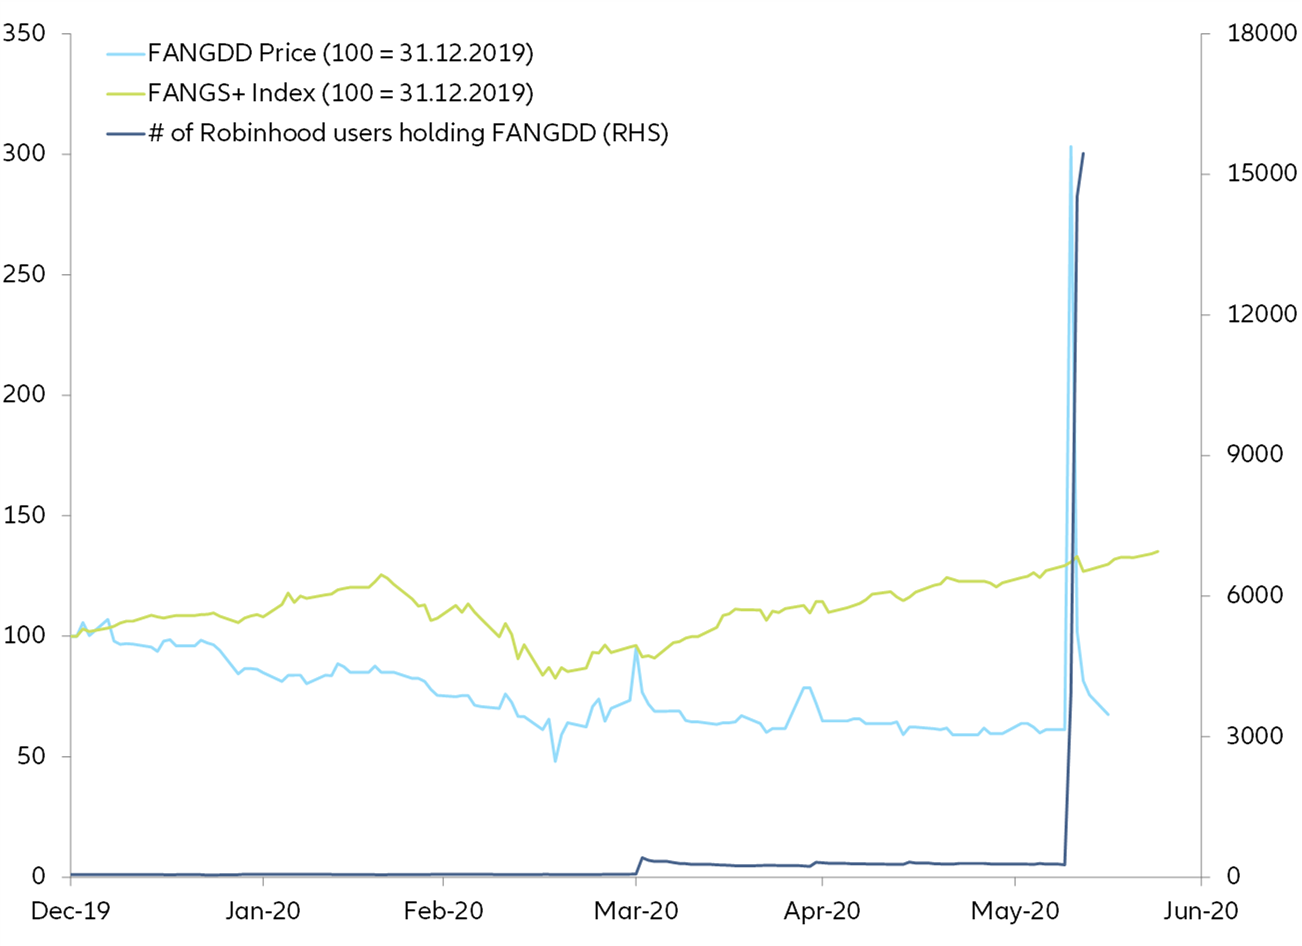
We consider the last two arguments are the most convincing. New retail investors’ expectations are formed in different peer groups than those of professional or experienced retail investors: it is not financial media that prevails but social (lifestyle networks). The investment behavior of the "new retailers" shows an alarming extent of risk-taking (consciously or by lack of financial literacy) not least by the extensive use of derivatives. In certain market segments, "new retailers" have already become very significant (distressed equity, penny stocks). The current U.S. equity market conditions seem fragile to us due to the decoupling from fundamentals and the highly speculative investment rationale, as well as the regulatory and operational risks.

Four explanations for the disconnect between the equity market and the real economy

The U.S. equity market rally starting 23 March has surprised and wrong-footed more than one professional investor. While the real economy is heading for the worst recession since WWII, equity markets seem to have already left behind this wall of worries. How can this puzzle be solved?
 
We consider four explanations as being potentially valid to explain the decoupling between the real economy and equity market performance. The first three are based on expectations theory, which means that the current state of the market embodies aggregate rational expectations of market participants for the real economy, monetary policy or single stocks. The difference between the three explanations lies in the interpretation of which expectation element is dominant in the current market.

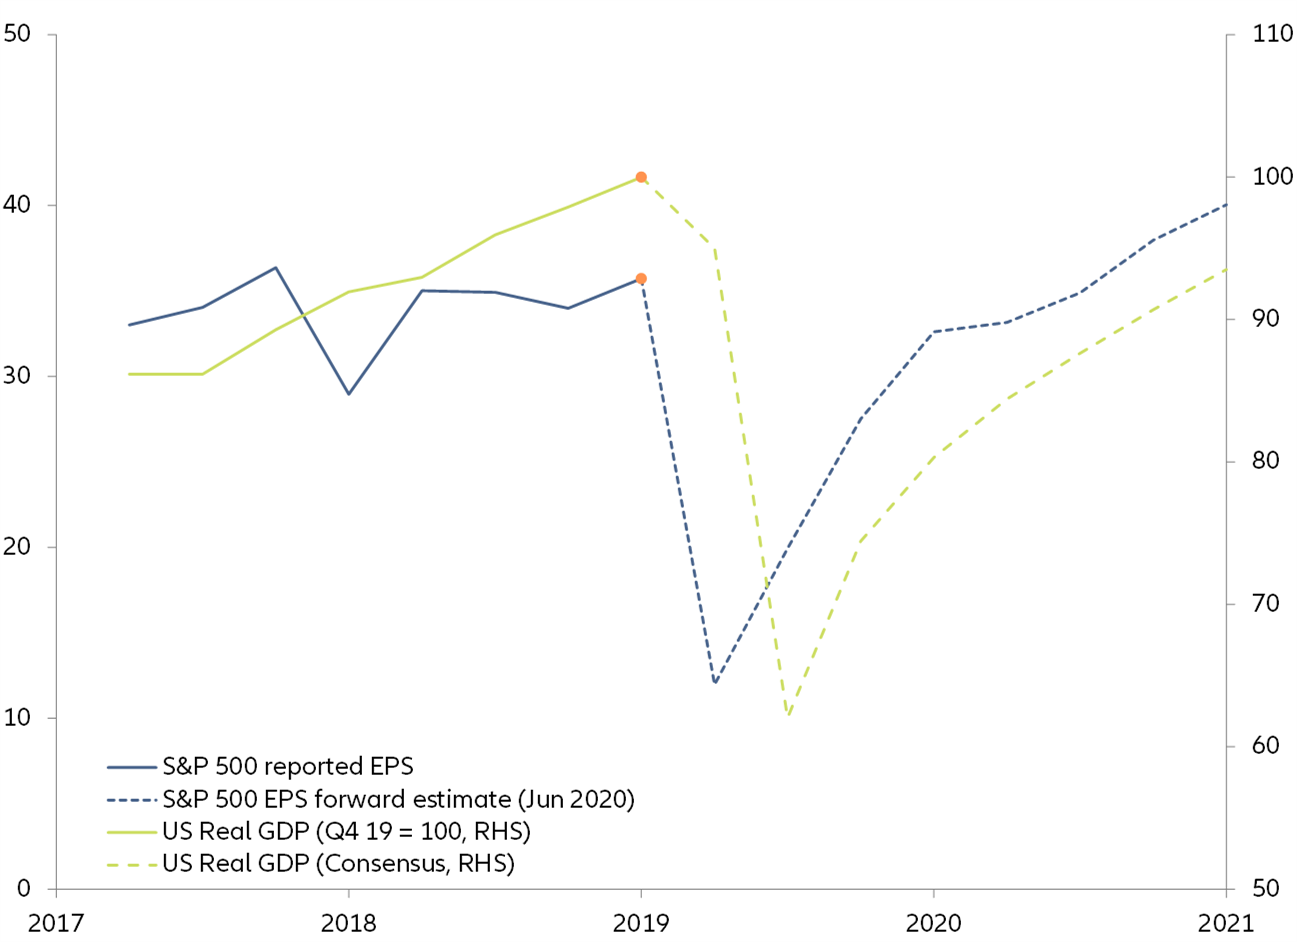
V-shape vs consensus. The first explanation is based on diverging expectations between equity market investors and policymakers, bond markets and international organizations as to the shape of the U.S. economic recovery. As of today, the equity market is pricing in a rapid recovery of the entire U.S. economy, with the S&P 500 expected to return to pre-crisis EPS (Earnings per Share) in H1 2021 (Figure 1). Meanwhile, international organizations (IMF, OECD) and the economists’ consensus expect the economic recovery to be much slower, with pre-crisis levels only being reached one year later in H1 2022. This means that equity markets don’t see any long-term scars on the U.S. economy from the Covid-19 crisis or that they expect the large listed U.S. companies to decouple from the rest of the U.S. economy strongly, consequently driving U.S. equity indices higher.

Figure 1: EPS vs. growth consensus, are we on the same page?

Figure 1: EPS vs. growth consensus, are we on the same page?
Sources: Refinitiv, Bloomberg, Allianz Research
Sector dispersion. The second plausible explanation is that U.S. equity markets do not reflect expectations on the development of the entire economy, but only embody very high earnings expectations for some sectors, especially the technology-related stocks (FAANG ). Due to their important weights in the major U.S. equity indices, following this explanation, the whole market has been pulled upwards by this pro-technology sector rotation. Year-to-date the S&P 500 outperformed the S&P 5000 ex FAANG + Microsoft by 6% (Figure 2). Currently, a high level of sector dispersion can be observed in the U.S. stock market (Figure 3). However, periods of high dispersion have historically been associated with fragile market conditions. They have indeed been a rather reliable leading indicator for future corrections. That means for this tech-driven rally to be sustainable, the sector's earnings must have become largely independent of the real economy or built on sustainable economic rent.

Figure 2: A tech-sector driven rally?
Sources: Refinitiv, Allianz Research
Figure 3: U.S. Sector Dispersion Index (51 sectors) vs S&P 500 Price Index
Figure 2: A tech-sector driven rally?
Sources: Refinitv, Allianz Research
* Historically, a decreasing sector dispersion metric went in line with the recovery of the S&P 500.

Pavlovian markets. The third explanation is that market movement is no longer based on fundamental valuation metrics, but only reacts to announcements of expansionary monetary and/or fiscal policy measures, whereby the response time between the announcement and the stock market rally has become shorter and shorter. In the Covid-19 crisis, the reaction to the massive fiscal and monetary stimulus package was almost instantaneous and even precocious. As a direct consequence, the equity market has integrated the effectiveness of these policy measures and no longer requires any hard proof (e.g. the Fed really buying what it claims it will buy). One could say that policymakers have become so credible in the mind of equity markets that they can trigger a conditioned Pavlovian “Buy” response through mere announcements. Paradoxically, this credibility of policymaking may have become a new source of vulnerability as policymakers now have to fully meet market expectations that may have become excessive (Figure 4).

Figure 4: Have markets turned Pavlovian? – S&P 500 vs Fiscal policy stance

Figure 4: Have markets turned Pavlovian? – S&P 500 vs Fiscal policy stance
Sources: Refinitiv, Allianz Research
*ratio US public debt / tax receipts

More evidence of this market overreliance can be observed in the corporate credit space as initial rumors about the Fed taking some non-investment grade credit risk onto its balance sheet triggered an instantaneous spread compression (after an extreme initial Covid-19-driven spread widening). Nevertheless, this rapid spread compression has been solely based on the Fed’s capability to convince markets. Up to now, the central bank has only bought $37bn worth of corporate bonds (Figure 5), which in absolute terms is a negligible amount (the size of the U.S. corporate bond market is ~ $8tn).

Figure 5: U.S. Federal Reserve balance sheet - corporate securities

Figure 5: U.S. Federal Reserve balance sheet - corporate securities
Sources: U.S. Federal Reserve, Refinitiv, Allianz Research

Additionally, this early rotation from cash and government bonds into riskier assets has taken diverging directions depending on the nature of the investor. While institutional investors have been rotating towards corporate bonds, be it investment or non-investment grade (See charts in the Appendix), retail seems to have been focusing on equity markets. This diverging pattern probably hints towards a plausible explanation for the slight divergence between equity and corporate bond performance. As of today, corporate bond markets are pricing in a minor Covid-19-driven structural economic impact, while equities seem to be unaware of the deteriorating economic outlook. This minor performance difference unveils the diverging market perceptions between institutional and retail investors about the future economic outlook.

Figure 6: U.S. corporate securities

Figure 6: U.S. corporate securities
Sources: BofA, Refinitiv, Allianz Research
The retail momentum. The fourth explanation is that this is a technical rally, the momentum of which comes from the retail trading sector, and is reinforced by systematic strategies like risk parity and trend CTA.

One thing is for sure: institutional investors have not been not driving the latest rally. On the contrary, their holdings in money market funds have strongly increased since the beginning of the year (Figure 7). Also, on a large scale, the lower liquidity in the futures market shows that there are few active institutional investors participating in this market.

Figure 7: Institutional money market funds (assets under management)
Sources: ICI Fund Flows, Allianz Research

With 34% of domestic equity holdings, U.S. households have the critical mass to move the market. However, in the past, they have tended to follow a buy-and-hold strategy. And as far as timing is concerned, their arrival in the market was often a sign that a rally was about to end. How could they change from laggards to precursors? Neo-brokers like Robinhood and Citadel Securities have lowered the entry barrier to access the equity market. They have also expanded the range of available products (split stocks, options, leveraged certificates) and reduced the transaction cost to close to zero. This may explain the strong increase in trades per day on U.S. online brokerage platforms (Figure 8).

Figure 8: While markets crashed, retail trading increased significantly

Figure 8: While markets crashed, retail trading increased significantly
Sources: Company data, Bloomberg, Allianz Research
One could say that neo-brokers have brought the toolbox of Wall Street to Main Street. So even if only a small proportion of retail investors has become active on these new platforms, and only a small part of the massive additional savings (saving rate from 8.2% in February to 33% in April) and government stimulus was channeled towards these platforms, there is a good chance that in connection with the high turnover, retail investors now exert a significant price-setting power on equity markets.

However, some analysts argue that the retail story is too “easy” and the rebound has more to do with the rise of volatility-sensitive (risk-parity) or momentum-sensitive (trend following) investors and the increasing influence of derivatives. We do not think that these two explanations are mutually exclusive. On the contrary, retail investors recently seem to be using more and more derivatives to carry out their transactions. Retail options trading has strongly increased since March, with 13% of the S&P options volume now being traded in retail size (1 contract trades) (Figure 9).

Figure 9: Rising importance of retail size option trading
Sources: Bloomberg, Allianz Research

For some stocks, the 1-contract options account for 20% to 30% of the relative options market (e.g. Chipotle, Alphabet, Amazon, Tesla). In Q1 2020, Robinhood's order flow payments were 66% from options trading. We therefore believe retail investors currently provide a momentum impulse in the U.S. equity market, which is then picked up and reinforced by systematic strategies. They thus help the trend to feed on itself.

Once we have accepted this, the question arises as to the “new retailers’” investment rationale as it influences the sustainability and robustness of current market conditions. We have gathered some evidence that the “new retailers’” investment behavior contributes to fragile market conditions as does, in our view, the operational setup of neo-brokers.

It can be inferred that these newly baked investors have little prior experience in trading nor a sound understanding of the capital markets. They ignore the fundamentals and seem to be provoked by the FOMO (Fear of Missing Out) phenomenon as well as gambling incentives promoted on social (lifestyle) networks. A market driven by these erratic investors lacks structural stability, which could ensure the profound durability.

Additionally, this urge to generate quick money has turned bankruptcy into an outright investment opportunity. The anticipation of the Fed’s “at any cost” put protection is seen by retail investors as chance for exuberant returns should the Fed prevent the imminent bankruptcy. This ultra-risky strategy became evident in the case of Hertz, as Robinhood users ramped up their long positions after the company had filed for Chapter 11 (Figure 10).

Figure 10: Hertz vs Robinhood Users

Figure 10: Hertz vs Robinhood Users
Sources: Robintrack, Refinitiv, Allianz Research

The market participation of this new wave of retail investors has also led to some ludicrous market situations that can only be explained by the financial illiteracy and risk perception of the “new retailers”.

For example, at the beginning of the pandemic and following the global switch to remote working, the “free” Zoom platform became the gathering place for online video communications. As a direct consequence, investors rushed into the stock: unfortunately, some of them mistook the ticker of Zoom Technologies, a small online services company, for the video conferencing company, leading to a massive intra-day uptick in the former’s share price (Figure 11).

Figure 11: An unfortunate confusion (Zoom)

Figure 11: An unfortunate confusion (Zoom)
Sources: Bloomberg, Allianz Research

A similar situation unfolded involving a relatively small China-based real estate firm that trades in the U.S. under the name of FANGDD Network Group Ltd, whose stock quintupled within a day, reaching intra-day highs of +1200% from the day before. It’s believed that fresh U.S. retail investors may have mistaken the positive outlook for the FAANGs equity basket (Facebook, Apple, Amazon, Netflix & Google) for the FANGDD stock (Figure 12). Following this unfortunate confusion, the stock experienced a massive price rally, obliging the China-based company to issue a statement warning investors that the price of its shares “could be subject to significant volatility for various reasons that are out of the company’s control”.

Figure 12: FANGDD vs FAANGs

Figure 12: FANGDD vs FAANGs
Sources: Robintrack, Refinitiv, Allianz Research
Despite being isolated events, one only has to spend some time on popular Reddit communities to get a broad idea of the current market hysteria and the risks that “new retailers” are taking.

It also turns out that the operational setup of these new financial intermediaries (neo-brokers and neo-banks) is prone to compliance weaknesses. In addition, liquidity risk is elevated as redemptions are paid out up to five days later. This may spur market runs and intensify downward movements. We also see that the complexity and structure of many of the products sold by neo-brokers (high leverage products, split equity) could trigger regulatory action, at least when a significant number of retail investors get burned. This could lead to “new retailers” wanting to liquidate their holdings as soon as possible and create a downward momentum in the market.

But does this market euphoria warrant re-entering the market? According to our proprietary market re-entry framework, many indicators remain inconsistent with a sustained equity market recovery. Additionally, our framework shows a clear divergence between mid-term to long-term indicators (showing deteriorating patterns) and short-term indicators (showing that the worst is already in the past) (Figure 13). In this context, a structural redeployment of risky assets in the portfolio may look premature as the market timing and the possibility of a second market correction are set to have a determinant role in future performance.

Figure 13: Re-risking framework summary
Source: Allianz Research
Jordi Basco-Carrera
Fixed Income Strategist
Patrick Krizan
Senior Economist
Lina Manthey
Equities Strategist