Trade Credit Insurance
Our market-leading credit insurance protects B2B trade credit, enabling businesses to grow with confidence.


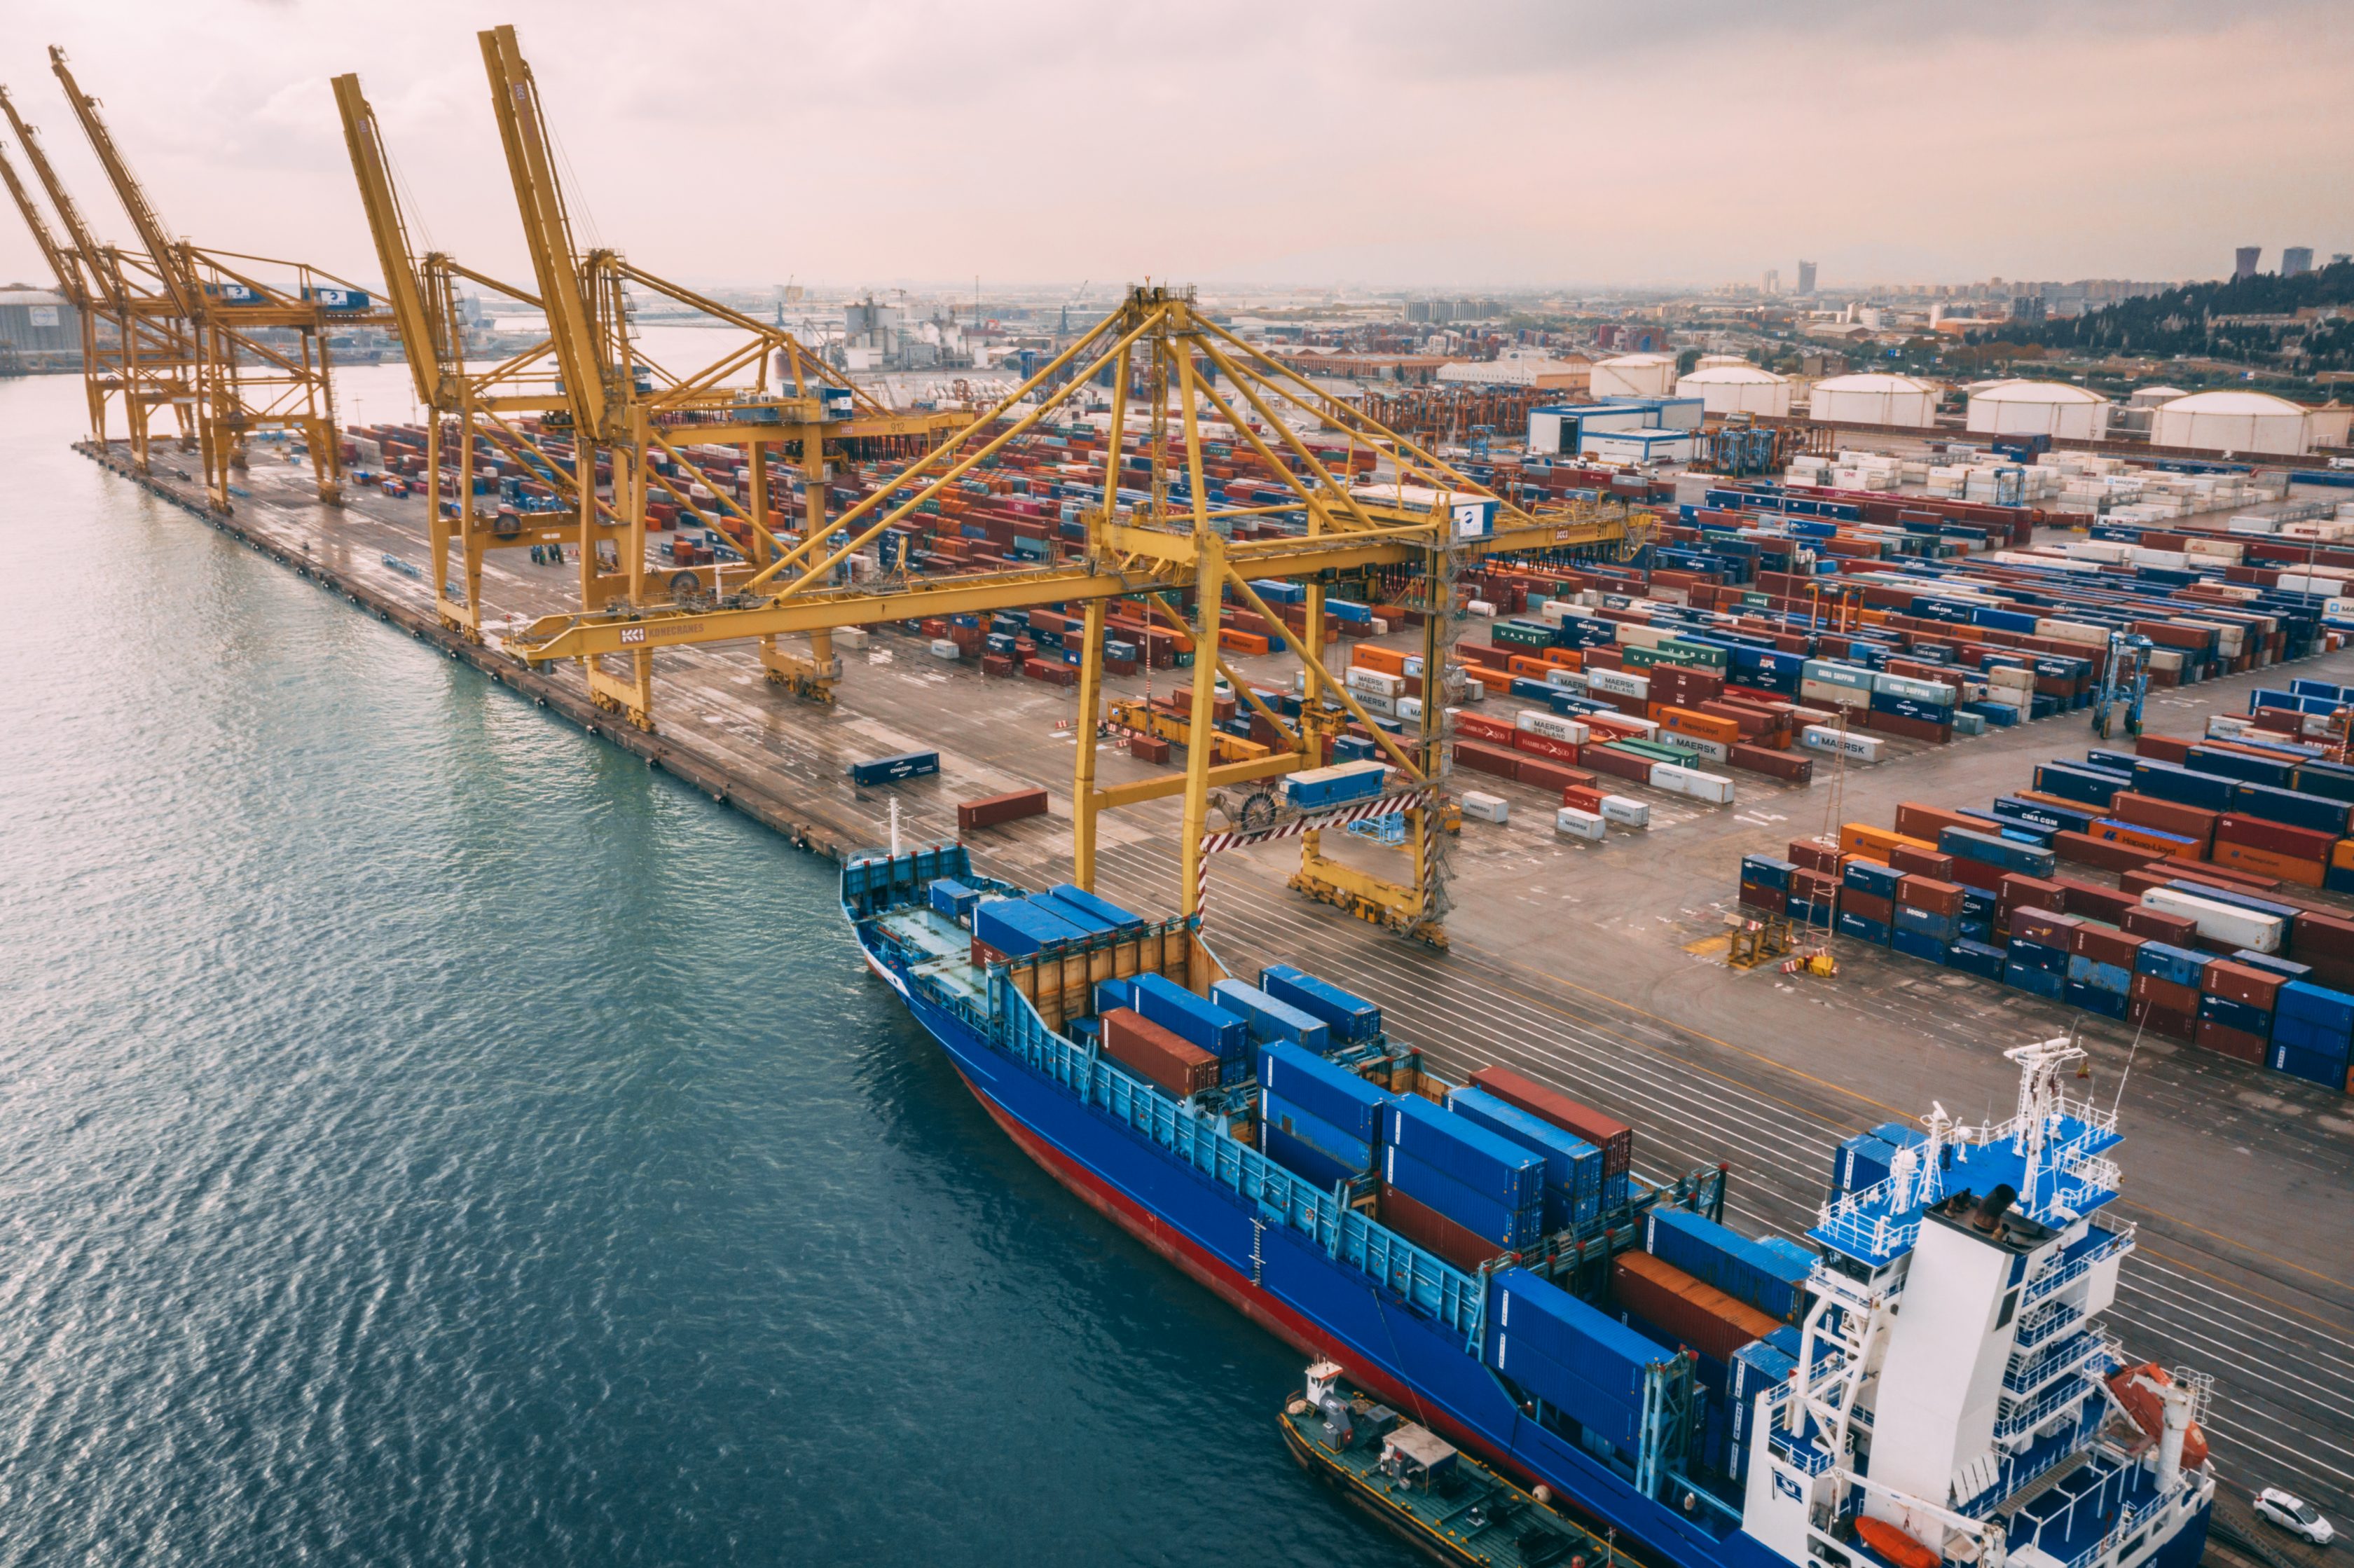
Our market-leading credit insurance protects B2B trade credit, enabling businesses to grow with confidence.

You can protect your organization from payment issues with trade credit insurance from Allianz Trade.

Get in touch to tell us about your customers, and we'll tell you about the trade risks... and opportunities.
Grow your business domestically and abroad with trade credit insurance by protecting your cash flow from economic, commercial and political risks.
Learn about Trade Credit Insurance
You can also find credit insurance solutions by business size:
Provide security with commercial surety bonds and contract surety bonds for your upcoming construction or manufacturing project.
Our unrivaled energy sector expertise in the credit insurance market has yielded tailored solutions to help your company manage receivables risk.
Help your clients strengthen their business and achieve their growth potential by offering trade credit insurance solutions from Allianz Trade.
Learn about our Credit Insurance Solutions for Brokers
We're committed to helping customers and partners make the most of our financial health insights through innovative, simple APIs and digital tools.


– Mike Libasci, President of International Fleet Sales
Allianz Trade, has united with the Olympic & Paralympic Movements through Allianz’s Worldwide Insurance Partnership. To help athletes and their teams gain confidence to achieve their goals, Allianz is offering them mentorship, career opportunities, health activities, and insurance solutions & services.
Allianz officially began its eight-year worldwide partnership with the Olympic & Paralympic Movements in 2021, building on a collaboration with the Paralympic Movement since 2006. We’ve brought athletes, teams, volunteers, and fans together in more than 200 countries.
Together with Allianz, we will continue to support the Movements with tailored insurance solutions and services for athletes as well as sport-related businesses and organizations.
What do you get when you combine invaluable business insights, actionable intelligence, and a pinch of irreverent fun? Season three of America’s premiere podcast about risk and reward, of course!
Wheel of Risk, proudly presented by Allianz Trade, is coming back — featuring a whole new series of thought-provoking and informative conversations about timely, big-picture topics in the world of business. Join host Alix McCabe and her team of experts as they explore everything from the importance of DEIB initiatives and the economic impact of elections, to women in leadership, how artificial intelligence will change eCommerce, and much, much more.
So go ahead, give the wheel a spin! Season three of Wheel of Risk is now everywhere you listen to podcasts.