China’s rapid economic development and dominant role in global trade has spurred a rapidly evolving financial system with an increasingly diverse and accessible capital market. The gradual removal of capital controls has already attracted a growing share of foreign investment, especially in the form of portfolio flows in equity and debt securities (Figure 1). Long-term institutional investors, such as insurance companies, have also expanded their presence in China amid rising exposures in high-growth emerging market economies, albeit with limited direct exposure in local currency (Figure 2). In this context, three asset classes are most attractive for foreign investors: local currency sovereign debt, highly-rated corporates, and equities. These asset classes typically represent the lion’s share of insurers’ investment portfolios and also drive current exposures to China.
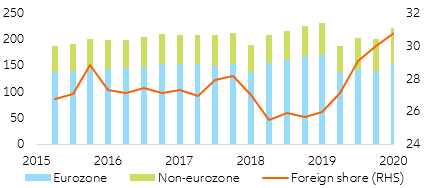
Figure 1: China: domestic financial assets held by overseas entities (CNY bn)
Sources: PBoC, Refinitiv, Allianz Research. Latest data point Sept. 2021.
Figure 2: Eurozone: insurance company asset holdingslisted shares and debt instruments (EUR bn / %)
Sources: ECB Statistical Warehouse, European Insurance and Occupational Pensions Authority (EIOPA), Allianz Research
China’s economic outlook remains favorable on account of strong policy support. China has experienced little economic scarring and has swiftly restored pre-pandemic output this year. We expect the current slowdown to peter out during the second half of next year and growth to remain solid relative to
the US and Eurozone (+7.9% and +5.2% expected in 2021 and 2022, respectively; Figure 3). A greater fiscal impulse at the regional level funded by the issuance of special bonds should help local governments boost public investment. In addition, financing costs should remain low due to high system-wide liquidity and window-guidance by the central bank. These policy actions, along with the temporary easing of certain regulations, are likely to steer the economy towards a soft landing.
Figure 3: US and Eurozone vs China real GDP growth differential (in %)
Sources: Refinitiv, Allianz Research
The countries’ revised growth strategy represents a significant upside risk to the current outlook, but near-term risks are tilted to the downside. The increased regulatory oversight that has rattled markets over the past year should be viewed through the lens of an evolving long-term sustainable growth model. Rising geopolitical tensions and domestic challenges have recently weighed on investor sentiment amid uncertain virus dynamics and related policy measures. Continued government restrictions and the risk of a renewed trade conflict with the United States, along with the potential for this to spread to their trading partners could have adverse confidence effects. However, over the long run, Chinese authorities’ policies under President Xi Jinping's banner program of promoting “common prosperity,” suggest slower but more sustainable and better distributed growth. Among other things, targets include reducing financial risks (e.g., in the real estate sector), narrowing socio-economic gaps between rural and urban areas and income classes, and stepping efforts towards climate targets.
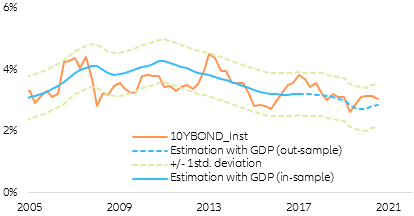
What does this mean for sovereign yields? Low volatility, strong fundamentals and FX rate stability have made Chinese sovereign debt increasingly attractive for both local and foreign investors. China is by far the largest supplier of emerging market sovereign bonds in terms of outstanding amounts, even though nearly all issues are CNY-denominated (Figure 4) and market access for foreigners is limited. The more open USD-denominated market for sovereign debt remains very small (even though China has recently issued more than USD8bn in foreign currency (USD4bn in October and EUR4bn in November)). The controlled market environment for local currency issues has resulted in very stable price dynamics and a gradual narrowing of spreads vis-a-vis developed markets, with close fluctuations around the 3% mark, consistent with our GDP-based Chinese 10-year yield valuation model (Figure 5). This simple model is based on the grounds that nominal yields are closely anchored to expected nominal growth. The model is based on the grounds that nominal yields are closely anchored to expected nominal growth, with expected nominal growth being computed as a dynamic self-optimizing exponential average of past nominal growth rates.
Going forward, we expect sovereign yields to remain close to current levels in the context of the Chinese government’s recent policy shift. Although long-term CNY yields’ share-pricing characteristics are similar to those of sovereign debt in advanced economies, they come with significant political and currency risks. Low overall inflation and the incipient normalization of monetary policy in the US should lengthen the odds for a structural decline over the near term.
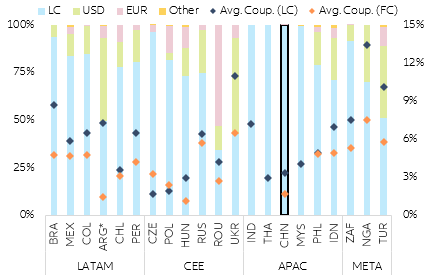
Figure 4: Emerging markets: composition of sovereign debt by currency and average coupon rate
Sources: Refinitiv, Allianz Research
Note: LC=local currency, FC=foreign currency. The reference for the foreign currency coupon is USD for all countries in Latin America (LATAM) and Emerging Asia (APAC), as wells as for Russia and Ukraine in Central and Eastern Europe (CEE). For other CEE countries, the currency denomiation is euros
Figure 5: China government bond 10-year yields (local currency)
Sources: Refinitiv, Allianz Research
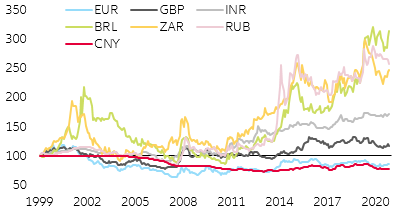
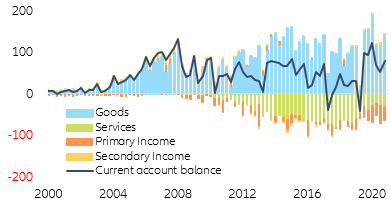
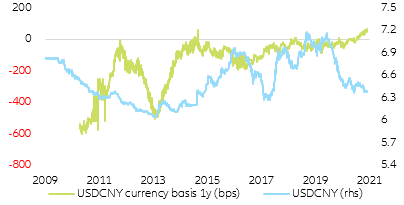
During the Covid-19 crisis, the CNY appreciated vis-à-vis most developed market currencies, which also resulted in positive spillover effects to China’s neighboring countries whose currencies outperformed the currencies of other EMs (Figure 6). Historically, maintaining a stable currency has been a political priority for developing an accessible and predictable exchange rate regime as the CNY evolves into a global currency. Since 1994, when China unified its dual exchange rates, the currency has not suffered any large shocks that have been common in other EMs. On the back of China’s improving external position (Figure 7), our fair value analysis suggests continued structural appreciation of the CNY next year, albeit at a slower pace due to persistent headwinds to global trade and a looser monetary stance. However, over the last year, it has become increasingly expensive for foreign investors to hedge CNY exposure, with cross-currency swaps spreads turning positive for the first time (Figure 8). Overall, significant government intervention and capital controls still impede the full convertibility of the CNY, which implies structurally higher FX risk compared to other EM countries with flexible exchange rate regimes. However, it is worth bearing in mind that a structural devaluation (rather than temporary depreciation) seems unlikely since it would run counter to the policy objective of globalizing the CNY and Chinese exports have become less dependent on a “cheap” exchange rate.
Figure 6: Foreign exchange rates (vis-à-vis USD): development since 2000 (indexed, 100=Dec. 2019)
Sources: Refinitiv, Allianz Research
Figure 7: China current account (USD billion)
Sources: Refinitiv, Allianz Research
Figure 8: USDCNY cross-currency basis
Sources: Refinitiv, Allianz Research
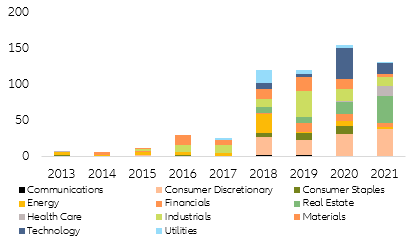
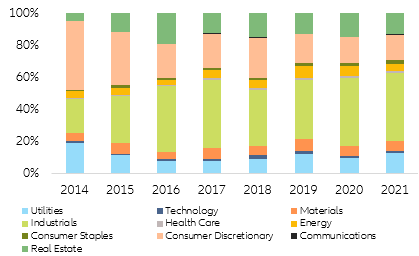
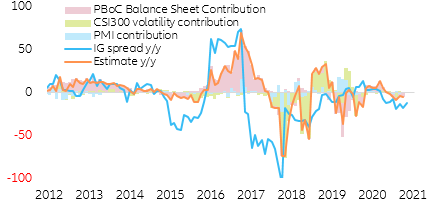
Corporate credit has been in the center of the recent market turbulence surrounding the ongoing challenges in the real estate sector. The combined effect of China’s regulatory crackdown and excessive leverage in the real estate sector and related industries has accelerated defaults in both the Chinese dollar credit market and the onshore CNY markets (Figure 9). However, pricing in both markets have been resilient (also due to the lower real estate weight), which can be partially explained by a stable investor base comprising largely local institutional investors. In addition, since the onshore credit market is not fully accessible to foreign investors, local onshore investors tend to buy and hold to maturity (Figure 10). Notwithstanding the current uncertainty and liquidity stress affecting corporate performance in affected sectors, we are credit positive on investment grade corporates in high-growth sectors. Our investment grade corporate spread decomposition methodology shows that the weight of the PBOC actions in corporate spread determination has been relatively high. In this context the expected somewhat looser monetary policy, especially in 2022, should act as a backstop for high grade credit both in the onshore and offshore markets (Figure 11). We expect investment grade corporate credit spreads to range trade close to current levels in 2022. However, the picture looks less benign for low-rated issuers from both a tactical and strategic perspective. Wrong timing and poor asset selection could lead to substantial losses in a short period of time.
Figure 9: China: onshore and offshore corporate bond defaults
Sources: Bloomberg, Allianz Research
Figure 10: China: onshore corporate credit market (by sector)
Sources: Bloomberg, Allianz Research
Figure 11: China: investment grade corporate spread decomposition (in y/y %)
Sources: Refinitiv, Allianz Research
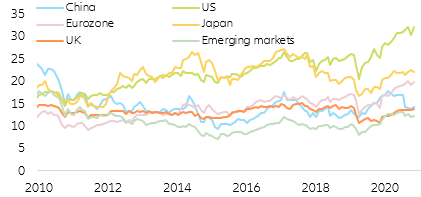
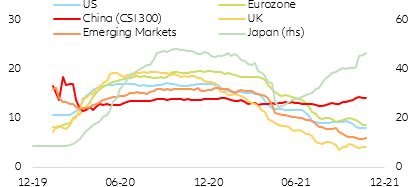
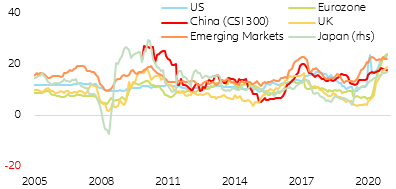
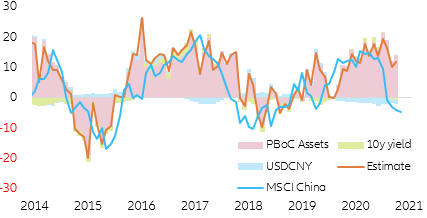
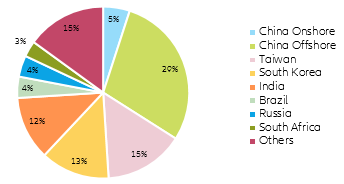
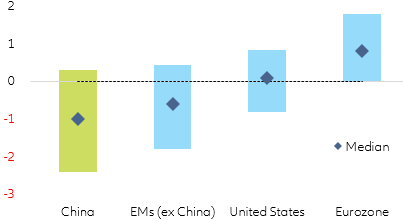
Equities have been a clear underperformer in the Chinese capital market during the Covid-19 crisis. Especially in the offshore market, equities have come under significant pressure due to the correction in the real estate sector and the regulatory crackdown. However, the market correction has not been accompanied by a structural deterioration in fundamentals, making Chinese equities look fairly attractive at current valuations. Thus, price-to-earnings (P/E) ratios seem low compared to other international markets, suggesting that Chinese equities might have been oversold amid fears of further market corrections and exogenous market volatility (Figure 12). In addition, earnings expectations have not followed the price correction path and still indicate a solid earnings recovery in both 2022 and 2023 (Figure 13), which is confirmed by the positive long-term EPS growth forecasts (Figure 14). The accommodative stance of the central bank (proxied by the size of the PBOC’s balance sheet) seems to explain most of the equity performance (similar to corporate credit), while the interest and FX rates play only a minor role. Thus, the currently looser monetary stance should be beneficial for Chinese equities going forward. Despite some economic headwinds, we expect Chinese onshore equities to outperform while we remain cautious on offshore equities due to potential knock-on effects of more stringent regulations (Figure 15). Given the relatively high share of China in the global emerging market equity index, notably in the “offshore” segment, spillover effects are likely to be greater for Chinese equities than corporate debt (Figure 16). Trade shocks in particular seem to have a particularly damaging effect on equity market performance. Historically, negative announcements related to the trade dispute with the US have on average led to a 1% decline in the total market capitalization of Chinese firms over a two-month period following each announcement (Figure 17). The risk of a renewed trade conflict with
the US — along with the potential for this to spread to trading partners amid slowing Chinese imports from the region — could have adverse confidence effects and be further amplified by the financial market reaction.
Figure 12: China: cyclically-adjusted PE ratios
Sources: Worldscope, Refinitiv, Allianz Research
Figure 13: China: 2022 EPS growth consensus
Sources: IBES, Refinitiv, Allianz Research
Figure 14: China: long-term EPS growth consensus (in %)
Sources: Refinitiv, Allianz Research
Figure 15: China: equity decomposition (in y/y %)
Sources: Refinitiv, Allianz Research
Figure 16: Country weights of the MSCI Emerging Markets equity index
Sources: Refinitiv, Allianz Research
Figure 17: Equity returns: impulse response to trade shock (after two months, %)
Sources: ECB, Refinitiv, Allianz Research.
Note: Average impulse response of the MSCI China Index, the MSCI Emerging Markets Index (ex China), the S&P 500 Index and the EURO STOXX 300 Index to trade shocks derived from local projections using daily data. Shocks are weighted by the size of the immediate response to ensure that surprise trade-related announcements have a greater impact than the ones that were expected

Global Head of Macroeconomics and Capital Markets Research

Senior Investment Expert

Investment Strategist

Corporate Credit Strategist

Senior Economist for Asia Pacific