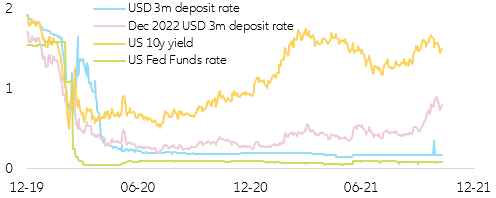
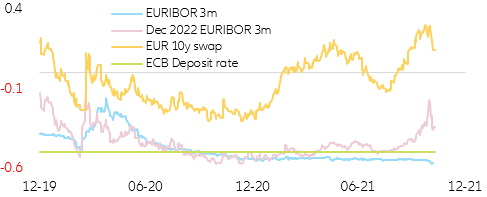
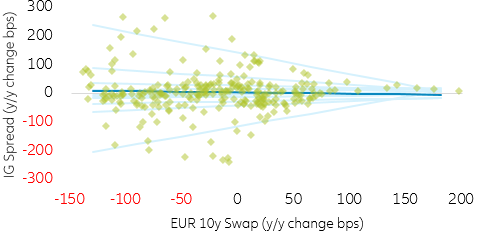
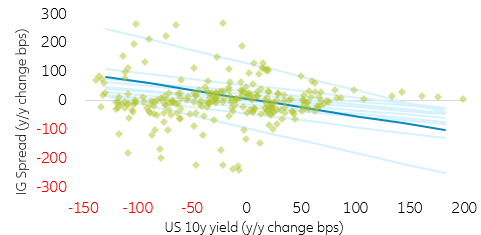
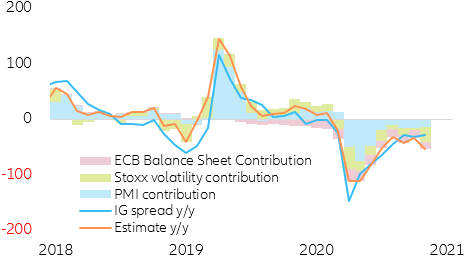
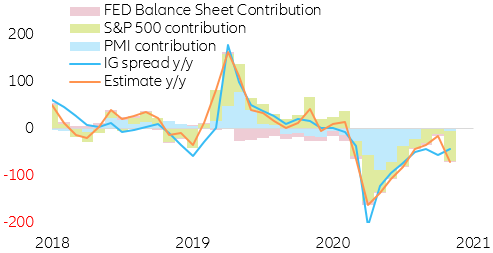
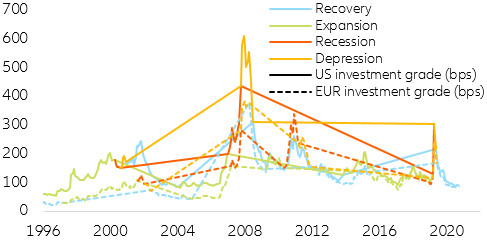
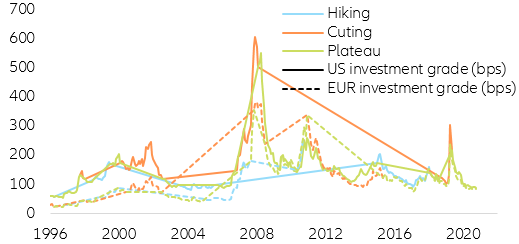
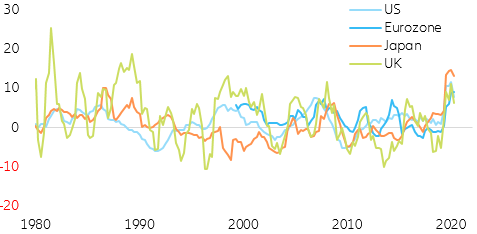
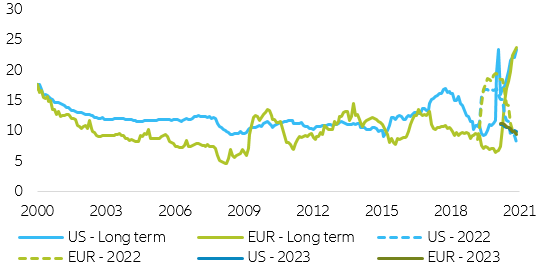
Strong crisis support from central banks has triggered substantial inflows into corporate credit, keeping spreads anchored close to multi-year lows. But will a world without QE reverse the trend?  Despite diverging monetary policy strategies in the US and Eurozone, both money markets seem to be looking at the latest developments through the same magnifying glass: The market repositioning in the short end of the sovereign curve due to pressing inflation and exacerbated supply disruptions has prompted both EUR and USD money market futures to heavily position for an earlier-than-anticipated hiking cycle in an attempt, successful or not, to suppress cyclical and non-cyclical inflation pressures. Of course, this inflation-contingent early-hiking path has not been interpreted as an indication of an early recovery but rather a depiction of temporary hiccups in the current economic recovery and a higher and stickier-than-expected inflation acceleration. Because of that, the steepness of the long end of the curve vis-a-vis ultra-short-term yields has diminished, signaling a more pessimistic stance moving forward (Figure 1 & 2).

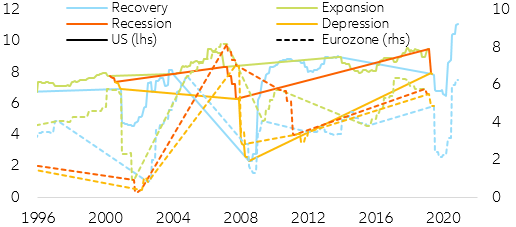
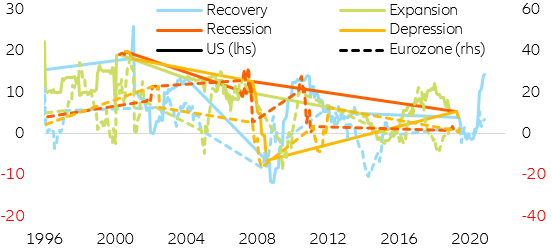
Figure 1: US short vs long end of the sovereign curve (in %)
Sources: Refinitiv, Allianz Research
Figure 2: EUR short vs long end of the sovereign curve (in %)
Sources: Refinitiv, Allianz Research
Along these lines, and if history is any guide, it is unusual that this pessimistic positioning in sovereign markets has not yet been transmitted to risky assets, which have not yet seen increased volatility: the difference between the move index (sovereign volatility) and the VIX (equity volatility) is at a yearly high (Figure 3)

Figure 3: US long-term sovereign vs equity implied volatility (in %)
Sources: Refinitiv, Allianz Research
Thus, one of the main future challenges will be how to finance the longer retirement periods of an increasing number of people. Combined with the breakup of traditional family structures, not least due to decreasing fertility rates , there is a rising need for sustainable pension systems that guarantee a decent living standard in old age. Though the development stages of Asia’s pension systems differ markedly, they have one thing in common: The window of opportunity to make them demography-proof is gradually getting smaller.
Besides the rapid demographic change, most markets have one further argument in common for striving for demography-proof i.e. sustainable and adequate pension systems: Due to their fiscal support measures to cushion the impact of the Covid-19 crisis, general government gross debt has increased and thus their future financial leeway to subsidize pension systems has shrunk. However, there are marked differences with respect to the degree of indebtedness: while the gross budget deficit of Japan is expected to reach 266%, that of Hong Kong will probably remain below 1%  (see Figure 4).

Figure 4: The Covid-19 crisis has diminished governments’ financial leeway 
Figure 4: Central banks corporate credit ownership vs spread (in % & bps)

Sources: ICE BofA, S&P, Barclays, Refinitiv, Allianz Research

*investable universe proxied using IG BofA indices;
**full line indicates spreads and dotted line central banks’ ownership

As long as central banks do not surprise with emergency tightening measures, we expect a close to negligible effect on EUR and US investment grade spreads. Traditionally, market commentators tend to link movements in the long end of the yield curve with the future path of corporate spreads. Despite sounding reasonable due to its interlinkage with corporate funding costs, this relationship seems to be unstable and only of particular interest in periods of considerable market swings. To assess the impact that changes in long-term sovereign yields have on investment grade corporate credit spreads, we perform a historical quantile regression analysis to capture how different interest rate change regimes affect corporate spreads (Figure 5 & 6).

Figure 5: EUR IG vs EUR 10y swap quantile regression

Sources: Refinitiv, Allianz Research (Distribution split in 10 different quantiles)

*each light blue line indicates a different quantile regression, dark blue line refers to OLS

Figure 6: US IG vs UST 10y quantile regression

Sources: Refinitiv, Allianz Research (Distribution split in 10 different quantiles)

*each light blue line indicates a different quantile regression, dark blue line refers to OLS

Interestingly, there seem to be material differences between the reaction functions of US and Eurozone spreads to changes in their respective long ends of the sovereign curve. In the case of the Eurozone, the aggregate OLS (Ordinary Least Squares), plotted as a dark blue line, reveals an inexistent slope while the quantile regressions depict a hand fan pattern, signaling changes in the sign of the slope coefficient depending on the spread quantile. In the case of the US, a negative slope across the distribution is visible, revealing a negative relationship between spreads and long-term sovereign yields. In other words, while other factors are also at work, in the US, periods of rising yields tend to be associated with spread compression episodes and vice versa.

Looking at the coefficient throughout the quantiles, the picture becomes clearer: Most of the time (15 to 85% quantile), changes in long-term EUR nominal yields have no impact on EUR investment grade corporate spreads. Nonetheless, at the extremes of the spread distribution, things change. If spreads are in an extremely low environment (i.e. -200bps y/y change), the implied nominal yields coefficient is positive. In other words, falling yields translate into compressing spreads and vice versa. However, on the other side of the spread distribution, that is to say in large spread-widening environments (i.e. 100bps y/y change), the coefficient turns negative. This translates into declining long-term yields being consistent with widening corporate spreads, which is consistent with a flight-to-safety rotation (i.e. depending on the position within the distribution moves in yields can push spreads up or down) (Figure 7).

Figure 7: EUR 10y swap coefficient vs IG spread quantiles

Sources: Refinitiv, Allianz Research

*light colored lines indicate confidence intervals

Nonetheless, the US does not exhibit the same coefficient pattern. For the overall distribution of investment grade spread movements the coefficient is negative, meaning that rising long-term yields and corporate spreads move in the opposite direction. In other words, when long-term yields rise spreads compress, and when long-term yields fall spreads widen. However, there are remarkable differences across the spread distribution: this existing relationship intensifies at the extremes of the spread distribution, with the multiplier going from -0.2 in the middle of the distribution to -0.7 at the extremes of the distribution (Figure 8).

Figure 8: US 10y coefficient vs IG spread quantiles

Sources: Refinitiv, Allianz Research

*light colored lines indicate confidence intervals

While surprising, the divergence between the regions is not completely out of place as the Eurozone underwent an additional credit cycle during the 2011 crisis and an initial wave of central bank direct intervention back in 2016. Despite these ex-ante causalities at the extremes of the spread distribution, we do not expect to be at the tails of either the long-term sovereign yield or corporate spread distribution in 2022 or 2023.

In this regard, we currently do not expect long-term sovereign yield interest to experience overly strong volatility in the coming months. The current flattening pattern suggests that, independent of the exact timing, market participants see monetary normalization to be moderate. The uncertainty about the persistence of current inflationary pressures and the monetary normalization path is therefore not feeding into the long end of the curve. This is also confirmed by the term structure decomposition of long-term sovereign yields: While the expectations component is on a timid upward trend (more in t he US than in the Eurozone), the term premium as the main driver of yield volatility has stabilized, thanks to clearly communicated key rates and QE outlook (especially in the US). As long as central banks do not surprise by any emergency tightening measures, this stabilizing pattern should remain over the next quarters. Because of that, and since our base case scenario puts us right in the middle of both spread and long-term yields distribution, we expect a close to negligible effect on EUR investment grade spreads and US spreads.

But are long-term yields all that matters?
The combination of an economic component (represented by the Markit PMI), a market volatility indicator (represented by implied equity volatility) and the contribution of monetary policies (represented by the central banks’ balance sheets and/or the money supply growth) seems to better explain moves in investment grade corporate credit spreads both in the Eurozone and the US (Figure 9).

Figure 9: EUR investment grade spread decomposition (y/y change bps)
Sources: Refinitiv, Allianz Research (*3y rolling regression)
We find that in the Eurozone a combination of changes in economic sentiment, as captured by the PMI, and spikes in equity volatility, as captured by the VStoxx, seems to have been responsible for most of the spread-widening since the Covid-19 outbreak. At the same time, and well into 2020, the renewed economic tailwinds together with plunging equity volatility and the ramp up of monetary policy have maintained spreads on a downward trending path which has now stabilized. As of today, a healthy combination of the three elements is keeping spreads anchored at low levels, building a cushion against bad news.
In the case of the US, the devil is in the details as it seems that US spreads’ reliance on equity volatility is far higher than that of the Eurozone, making them more vulnerable to changes in investor sentiment (it partly also leads economic sentiment as ultimately EUR and USD spreads are strongly correlated). At the same time, US spreads seem to be later in the cycle as the renewed economic tailwinds and the initial Fed intervention have been fully priced in, leaving spreads at an unstable equilibrium situation (Figure 10).

Figure 10: US investment grade spread decomposition (y/y change bps)
Sources: Refinitiv, Allianz Research (*5y rolling regression)
We expect investment grade credit spreads to remain close to 2021 levels in 2022, while experiencing a mild widening in 2023 (10-20bps per annum). From a credit cycle perspective, economic recovery and expansion periods tend to be favorable for investment grade corporate credit spreads as those phases are usually associated with periods of improved corporate profitability and solvency which, translate in corporate spread stability with diminished market volatility and easy funding conditions. In addition, historically, such periods have also been characterized by a strong bias towards wider spreads. In other words, the probability of experiencing tighter spreads is far lower than that of wider spreads in case of a market disruption and or economic deterioration (Figure 11).

Figure 11: Investment grade spreads & business cycle (in bps)

Sources: NBER, ECRI, ICE BofA, Refinitiv, Allianz Research

* Business cycle phases defined as ½ distance using NBER peaks & troughs
** for the EUR aggregate French business cycles are used as it has the biggest weight in the BofA index
*** full line refers to US IG spread while dotted line refers to EUR IG spread

At the same time and anticipating the beginning of the central bank hiking cycle, tightening periods are not necessarily widening forces for investment grade corporate spreads. If history is any guide, tightening periods tend to coincide with stable and/or compression waves for the US credit market but widening periods in the Eurozone (Figure 12).

Figure 12: Investment grade spreads & monetary policy (in bps)

Sources: ICE BofA, Refinitiv, Allianz Research

* monetary policy cycle phases defined using last hike / cut
** full line refers to US IG spread while dotted line refers to EUR IG spread

In this regard, the current expected divergence between the US and Eurozone tightening cycles should provide a cushion against diverging behavior between EUR and USD corporate credit spreads when looking at the two regions in isolation. In other words, the fact that the ECB is expected to start its hiking cycle only in late 2023 or early 2024 does not challenge our assumption that EUR and USD spreads may perform similarly in the following two years. However, it is important to bear in mind that a policy mistake in each side of the Atlantic could widen both EUR and US credit spreads as their correlation is extremely high.

Fundamentals also point towards market stability. Several fundamental valuation metrics are accompanying this stabilizing and recovering phase, with key credit cycle metrics showing signs of improvement and resilience. Along these lines, corporate debt to GDP is starting to decline as GDP growth recovers and corporate debt issuance slows down. This trend is consistent with other recovery and stability phases for corporate credit markets and hints towards a balance sheet consolidation phase. (Figure 13)

Figure 13: Corporate debt as a % of GDP (in y/y %)
Sources: National ministries of finance, national ministries of social affairs, national pension providers, OECD, ISSA.
But not everything is about debt; companies’ balance sheet top and bottom lines  and margins are continuously improving across the board, an additional signal consistent with a recovery and stability phase that should help them withstand upcoming headwinds. However, the Eurozone balance sheet recovery cycle seems to be lagging the US in terms of top line revenues (Figure 14, 15 & 16)

Figure 14: Net profits margin (in %)

Sources: Worldscope, Refinitiv, Allianz Research

* full line refers to US while dotted line refers to Eurozone

Figure 15: Sales growth (in y/y%)

Sources: Worldscope, Refinitiv, Allianz Research

* full line refers to US while dotted line refers to Eurozone

Figure 16: Net income growth (in y/y%)

Sources: Worldscope, Refinitiv, Allianz Research

* full line refers to US while dotted line refers to Eurozone

A natural consequence of this environment has been a remarkable improvement in liquidity and solvency. In other words, the capacity of companies to repay their additional Covid-19 debt burden has been improving as renewed economic tailwinds have pushed earnings growth to historical highs while, as mentioned above, the overall debt burden has been decreasing. These improving cash flows conditions can be spotted in the changes in interest coverage ratio , which has exploded to new highs, indicating that companies have successfully navigated through any liquidity issue that may have risen at the beginning of the Covid-19 crisis (Figure 17). Of course, it is important to mention that this diagnostic applies to the broader market, but certain sectors are still suffering Covid-19-related liquidity issues (i.e. transportation, leisure, etc.)

Figure 17: Interest coverage ratio
 Figure 17: Interest coverage ratio

Sources: Worldscope, Refinitiv, Allianz Research

* full line refers to US while dotted line refers to Eurozone

How will companies’ bottom lines evolve moving forward?  Markets have already priced in a deceleration in earnings for 2022 and 2023, with EPS expectations anchored at ~10% for both years. However, expectations for the three-to-five-year time horizon remain high, signaling that markets still expect earnings growth stability and acceleration in the upcoming years, which should provide a fundamental cushion against bad news and market swings. This reflects a bullish consensus moving forward (Figure 18).

Figure 18: EPS market expectations (in %)
Sources: IBES, Refinitiv, Allianz Research
With all that in mind, we expect investment grade credit spreads to remain close to 2021 levels in 2022 while experiencing a mild widening in 2023 (10 to 20bps per annum) on the back of an exacerbated market volatility due to withdrawal of central banks and progressing economic cycle. Despite this somewhat benign outlook, we believe that risks are on the widening side as the ultra-tight credit spreads leave little room for a further compression and more room for widening. Especially in the US, the heavy dependency on equity volatility provides a lucrative pick-up in bull runs but also reflects a highly unstable environment.