EU CBAM and developing economies

EU carbon border adjustments and developing country exports: saving the worst for the last

17 November 2020
The introduction of the EU carbon border adjustment mechanism (CBAM) will come with a high cost for developing economies , particularly African trade partners and the Arab states of the Persian Gulf, which will face the highest ‘carbon tariffs’. For simplicity, we use the term ‘carbon tariffs’ for the cost burden imposed by an EU CBAM . In our recent report, we identified cement, iron & steel and petroleum products to be the sectors most likely to be affected, with basic chemicals, fertilizers, industrial gases, aluminum and paper being the next in line. In terms of absolute embedded CO2 emissions in exports to the EU, we found the Russian Federation is the most exposed compared to all other countries . The U.S. follows well behind in rank 2, and ranks 3 through 7 are occupied by oil-producing developing economies. China follows only in rank 8 and features a more diverse portfolio, with its top three emission exports originating from chemicals, pharmaceuticals and aluminum.

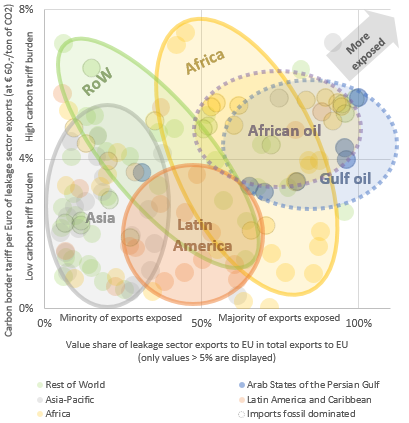
However, when it comes relative exposure, the ranking is very different. Figure 1 indicates the relative exposure to carbon tariffs by region (further details on the countries underlying the regions are displayed in Figure 4 in the Appendix). Individual countries are indicated by the smaller dots, with colors specifying the regions. Countries in the upper half face high carbon tariffs on the carbon leakage or ‘brown’ sector exports. The tariff on the export value is based on a carbon price of EUR60 per ton of embedded CO2. The 4% tariff on the export value as a cutoff for the high burden in Figure 1 is rather high. Typically, a tariff of 5% relative to value added (not relative to total export value, which is much higher) has been considered as an essential burden for identifying carbon leakage risk. As only carbon leakage sectors are relevant here, the 5% of value added cutoff is almost always fulfilled by definition.

Figure 1 – Exposure of developing and least developed countries to EU carbon border adjustments
Source: Allianz Research
In the left half of the figure, only a small share of the respective countries’ exports to the EU are exposed to carbon tariffs, while in the right half the majority of export value is generated in a ‘brown’ sector. Consequently, the countries in the upper right quarter are most exposed to carbon tariffs in both dimensions. Besides the oil-producing countries in Africa and the Persian Gulf, further African developing economies join the group of the most exposed.

Figure 2 lists the top 50 developing or least developed countries by declining total exposure . The filled bars end at the country’s respective carbon tariff on ‘brown’ exports to the EU and the hollow bars indicate the worth of the tariff relative to total exports to the EU. The most exposed country, Bhutan, for instance, owes its position to a large share of iron and steel products in its exports. But it will likely be exempt from carbon tariffs due to its least developed country status (indicated by the orange color). The countries that will be actually exposed to the EU CBAM are the developing economies indicated by the blue color.

Figure 2 – Top 50 least developed and developing economies most exposed to EU carbon border tariffs
Source: Allianz Research
Bilateral CO2 pricing commitments and mechanisms could act as a substitute to EU CBAM-related tariffs . The natural candidates for this would be countries with net-zero commitments such as Japan, South Korea, New Zealand and China, as well as potentially the U.S., given the designated president’s recent comments. However, the least-developed countries will likely be excluded from the mechanism. The remaining developing economies, particularly the poorer ones, will thus be affected the most, because they lack the administrative infrastructure or the financial resources to satisfy the regulatory requirements of the EU CBAM. In Figure 3, we focus on these countries and show which of them would be most affected. Thus limiting our analysis to ‘lower-income developing economies  (using the UN definitions and including ‘low-income’ and ‘lower-middle-income’ groups), it becomes apparent that the strongly exposed countries are dominantly located in Africa (African countries being indicated in orange). The most affected among the lower-income economies include the African fuel-exporting countries such as Nigeria, Egypt or Cameroon, with other African economies such as Congo, Ghana, Zimbabwe and Morocco being the next in line. For comparison reasons, the figure includes China as well (not being considered poor by our definition), which is much less exposed than the typical country displayed.

What does this mean for policymakers? Africa will play a crucial role in the development of the hydrogen economy, so it is in the EU’s very own interest not to jeopardize existing trade relations by applying the strict logic of CBAM. A functioning hydrogen economy is a necessary component of a complete European renewable energy transition, but as the EU has itself acknowledged, domestic production won’t be enough to satisfy the expected hydrogen demand. Africa has an abundant potential for producing cheap green hydrogen through solar and wind energy, and the development of an African hydrogen economy was declared as a primary aim of the EU Africa strategy announced earlier this year . It should be very clear that this would result in the EU being strongly dependent on Africa. The critical risk factors in this dependency will be rather institutional. Developing an African hydrogen economy would require a focus on stabilizing the continent politically and improving living conditions. A functioning hydrogen economy in turn will essentially contribute to these aims. Solving this chicken and egg puzzle will be the key to success for the EU energy transition.

Figure 3 – Exposure of lower income developing economies to EU carbon border adjustments (bubble size proportional to square root of tons of CO2 emissions embedded in exports to EU, China added for comparison)
Source: Allianz Research
Markus Zimmer
Senior Expert, ESG
Arne Holzhausen
Head of Wealth, Insurance and Trend Research