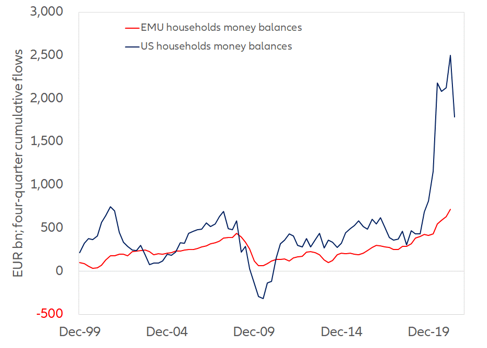
According to many an analyst, such an unusually large increase in privately held money balances indicates excess saving. The argument follows that when people tap into their savings, which they will inevitably do to correct the current excess, money balances will fall, unleash pent-up demand and a strong recovery will ensue.
As a matter of fact, one could (and actually should) deepen the excess saving argument by better distinguishing the two components of what laymen as well as some experts loosely call saving, namely:
- saving proper, or outlays other than consumption outlays,
- and (marginal) hoarding, or money not spent at all because it has been added to preexisting precautionary money balances.
If one hastily defines saving as that part of income that is not spent on consumption, one may be led to falsely believe that hoarding is part of saving, confusing money that is spent, but not on consumption, with money that is not spent at all. Focusing on the hoarding of precautionary balances, this investigation claims that the increase in outstanding money balances that inspires the excess saving argument systematically under- or overestimates the firepower set aside by private agents.
As a matter of fact, the excess saving argument underestimates by about 20% the quantity of money withdrawn from circulation and set aside by people in response to the Covid-19 shock. Saving proper has not really increased, but hoarding has, and much more than suggested by the cumulative increase in aggregate money balances since Q1 2020. Relevant to the growth and inflation outlook is the fact that the excess saving argument also underestimates the challenge of unleashing the purchasing power that people have stored for rainy days. The unlocking of hoarded money balances is not as straightforward as assumed by those who let the money supply alone guide their inflation expectations, at the risk of ignoring the demand for money. If people now held money balances above and beyond what they desire to hold, they would strive to get rid of excess liquidity and money velocity would increase. This has yet to happen. If there is something for policy to deter, it is hoarding; and if there is something to stimulate, it is saving.
Some money balances count more than others
On the one hand, at any time, the money supply consists of the money balances held by households, and of the money balances held by businesses. On the other hand, at any time, households and businesses have two motives to hold money balances: the transactions motive, and the precautionary motive.
It follows that the money supply can also be split into transactions balances (balances that do circulate because people and businesses pay their bills with them), and precautionary balances (balances that do not circulate because people and business hoard them as a precaution against a possible fall of their nominal income). For the sake of completeness, let us add that precautionary balances should be understood to include the money balances that people hold for speculative purposes. As long as people expect asset prices to fall further, such speculative balances do not circulate either.
The numerical example presented in Appendix A shows how we could directly measure transactions balances and precautionary balances
(or aggregate hoarding). It defines marginal hoarding as an increase in precautionary balances and shows that such an outcome is possible even when aggregate money balances are constant. That hoarding can happen even when the money supply does not increase at all invites caution when interpreting increases in money supplies such as the ones observed in 2020. The dual nature of the money supply means indeed that a variation in the money balances held by households and businesses, an easy-to-observe phenomenon, may have two not-so-easy-to-disentangle causes: a variation in the demand for transactions balances, or a variation in the demand for precautionary balances, or a combination of both. Like it or not, we cannot draw any conclusion about the magnitude of hoarding from an increase in the money balances held by private agents, since we have two variables, but only one equation. If transactions balances have decreased, the mere increase in money balances underestimates the quantity of money set aside, or withdrawn from circulation, by private agents.
Appendix A further shows that hoarding causes money velocity to fall and that, to quantify marginal hoarding, one needs to estimate the demand for money. In what follows, we investigate the behavior of both money velocity and the demand for money since early 2020.
Hoarding leaves an unmistakable footprint on money velocity
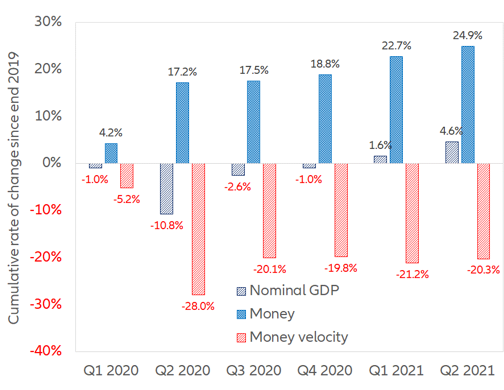
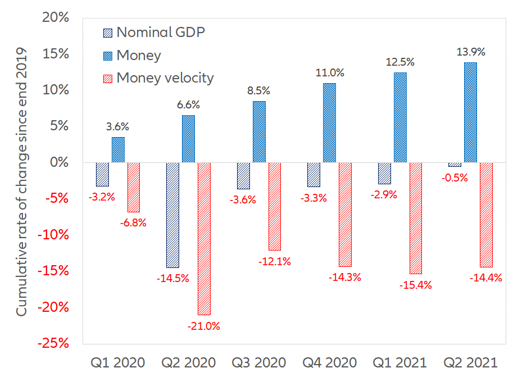
If hoarding can occur even when the money supply does not vary, a fortiori can it occur when, as seen since early 2020, the money supply does increase. As we have just seen, we can infer from the decrease or increase of money velocity whether hoarding or dishoarding is happening. The sharp decline of money velocity in the early stages of the crisis, its limited recovery in Q3 2020, and its stability ever since indicate that hoarding, rather than saving proper, has been and remains the hallmark of the current economic and monetary environment.
Hoarding (or dis-hoarding) indeed leaves an unmistakable footprint on nominal spending and money velocity. To see that, let us start from Newcomb-Fisher's equation of exchanges, which says that nominal spending (a flow of money) equals the money supply (a stock of money) times its velocity, that is, how frequently money changes hands during a given period.
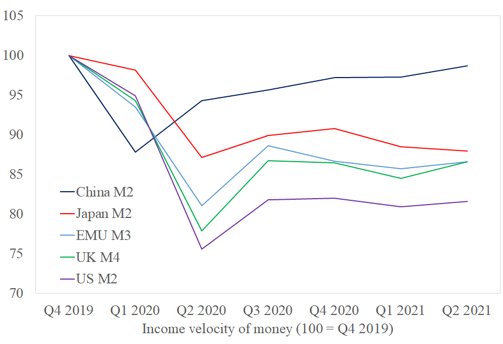
In a perfect world, we should tally all transactions: the transactions on final goods and services that make (nominal) GDP as well as transactions on intermediate goods and services, and securities transactions. At the risk of neglecting the transactions settled with bank notes and coins (for a large part, the money of the black economy), the sum of the debits on bank accounts during a given period could provide an estimate of aggregate nominal transactions. With that, economists could compute the transactions-velocity of money. For lack of such comprehensive measurement, economists are content to take nominal GDP as a proxy for aggregate nominal transactions and to compute the income-velocity of money (the ratio of nominal GDP to the money supply). Such is the approach followed in the present investigation.
Figure 2 – Income-velocity of money in major economies since Q4 2019 (=100)