Executive Summary
- In the long run, most sectors have (some) pricing power. By comparing the evolution of retail prices with changes in producer prices, we find that only five out of 19 sectors (textiles, household appliances, cleaning products, telephone services and restaurants) lack long-term pricing power. We also find that consumer electronics, pharmaceuticals and airlines have the most pricing power among our sample.
- However, the lack of short-term pricing power for many sectors means low inflation risk in the Eurozone. In a context of rising input prices, the potential short-term pricing power of firms is key for reflating the economy. Nevertheless, through our causality analysis, we find that only sectors accounting for a third of the Harmonised Index of Consumer Prices (HICP) have the ability to increase retail prices. Consequently, we see no evidence pointing toward a sustained pick-up in inflation in the Eurozone.
- From a sector risk perspective, only pharmaceuticals, computers and consumer electronics are immune to rising input prices. Through our risk score based on 1) short-term pricing power, 2) demand elasticity, 3) the trend in profitability, 4) recent changes in input prices and 5) the ability to offset rising input prices through exports, we find that only firms in these three sectors will not be under financial pressure from rising input prices. Other sectors might experience pressure on their margins over the next few months as we expect input prices to ease only in Q3 2021.
In the long run, most sectors have (some) pricing power.
As expectations of a post-pandemic demand catch-up in Europe are building up, rising commodity and input prices will test firms’ ability to charge more for their products and services without losing business. This potential pricing power is key for reflating the economy but also for firms to make up for 2020. However, because of a large number of factors (different market structures, competitive intensity, consumer behaviors etc.) not all sectors have the ability to stay ahead of the curve.
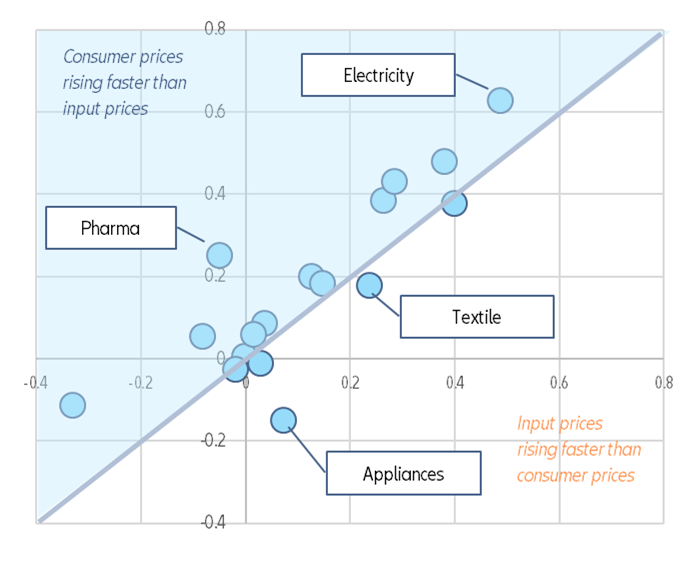
By comparing the evolution of retail prices with changes in producer prices in the Eurozone , we compute a proxy for pricing power. Indeed, sectors that saw retail prices increase faster than producer prices can boast of having some pricing power whereas those in the opposite situation could be seen as lacking pricing power. Due to data discrepancies, some sectors are analyzed since the early 2000s while others are studied since 2017 . Overall, we find that textiles, household appliances, cleaning products, telephone services and restaurants have seen input prices outpace retail prices (see Figure 1). These sectors have been facing fierce competition, whether domestic (telephone services, restaurants) or global (textile, appliances, some chemical products). As a matter of fact, the Harmonised Index of Consumer Prices (HICP) includes imported goods. In addition, restaurants also have a cost structure with high fixed costs (rents, wages).
Figure 1 – Long-term evolution of HICP vs PPI for selected sectors in the Eurozone
Sources: Eurostat, Euler Hermes, Allianz Research
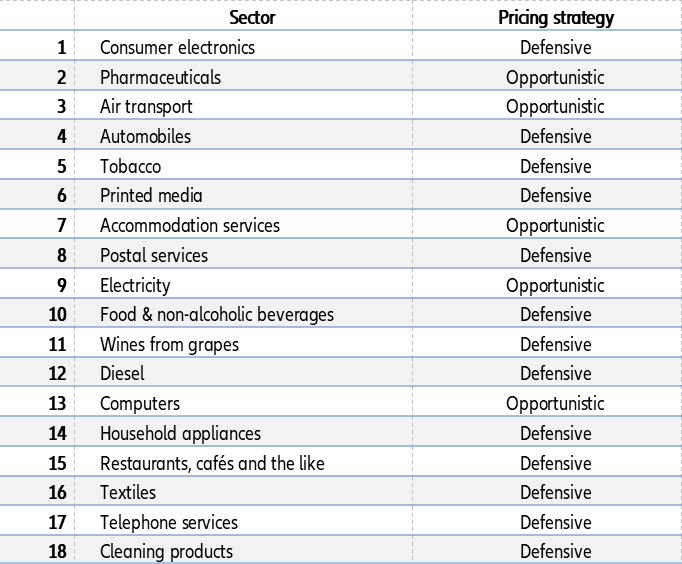
Consumer electronics, pharmaceuticals and airlines top our long-term Eurozone pricing power ranking. To further investigate the HICP-PPI nexus, we run simple regression models to estimate HICP components with relevant sector input prices . By looking at the relevance of our regression models and coefficients, we are able to establish a ranking of Eurozone sectors (see Table 1). Overall, our quantitative assessment is in line with expert judgements. However, some sectors, such as consumer electronics, could be on their way downward in the ranking as recent trends saw many (if not all) large manufacturers offshoring outside the Eurozone. We also underline a distinction between sectors that have been passing through input price changes in order to preserve market shares (defensive strategy) and those that were opportunistic (i.e. increasing prices much more than their input prices). We do so by defining a 10pp threshold in the HICP-PPI spread; sectors that managed to increase retail prices more than 10pp beyond input prices are considered as opportunists while others are considered defensive.
Table 1 – Our long-term pricing power ranking
Sources: Eurostat, Euler Hermes, Allianz Research
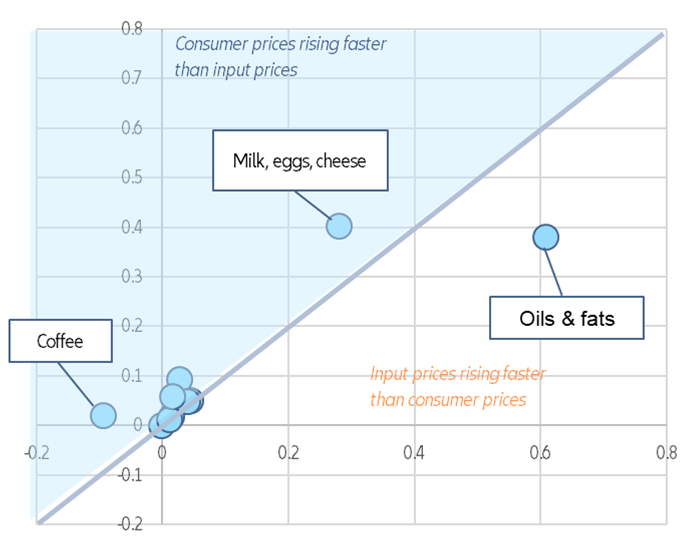
Beware of heterogeneity within sectors in long-term pricing power. Using detailed data in the food segment, we observe that here we must also account for heterogeneity within a sector (see Figure 2). For instance, the oils sector has seen its input prices outpace consumer prices over the last 15 years. Interestingly, the dairy (milk, cheese) and egg segment has been able to increase retail prices 10pp above its input price growth over the same time period. However, coffee producers that benefited from lower input prices had to cut retail prices in order to fight off global competition.
Figure 2 – Long-term evolution of HICP vs PPI for selected food sectors in the Euro area
Note: Due to data availability, periods are not homogenous among sectors
Sources: Eurostat, Euler Hermes, Allianz Research
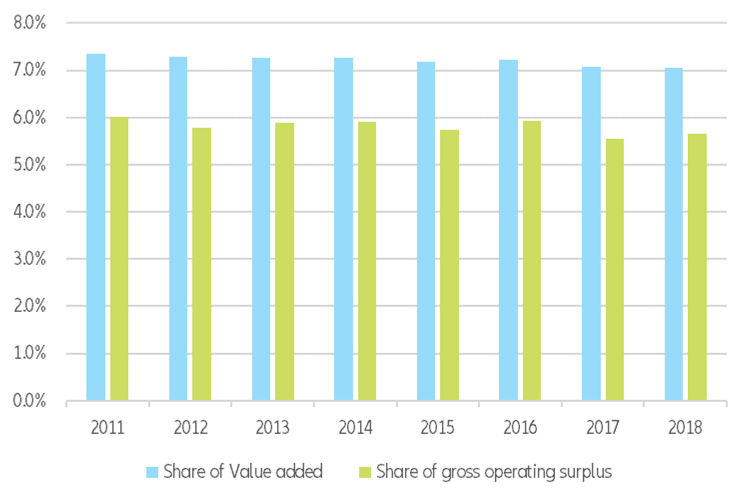
The increases in consumer prices are not (fully) taken up by retailers. As HICP includes the pricing strategy from the retail sector, one could question how retailers could skew our analysis. Indeed, they could increase selling prices to customers while purchasing at lower prices to producers in order to preserve or increase their own margins. However, looking at the broader picture, the retail sector has not seen its profitability increase compared to the rest of the business economy, it even decreased a bit over 2011-2018 (see Figure 3).
Figure 3 – Retail sector in total business economy (ex. Financial/insurance services)
Sources: Eurostat, Euler Hermes, Allianz Research
The lack of short-term pricing power for many sectors means low inflation risk
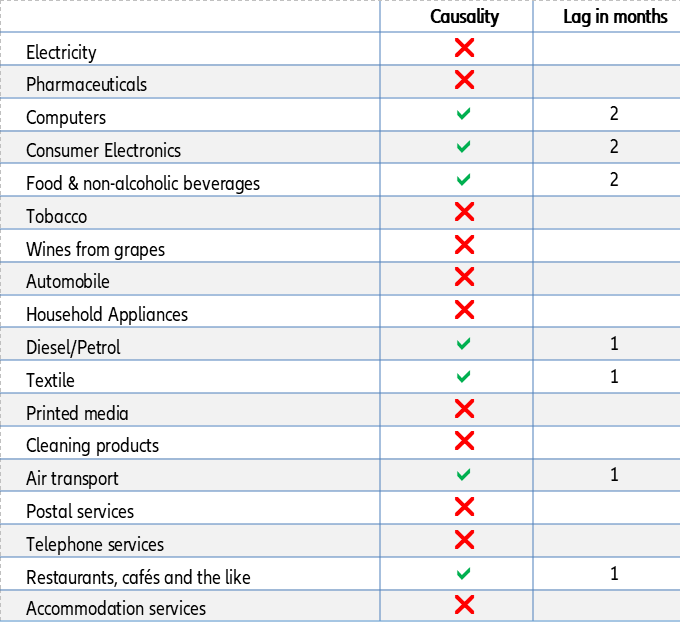
The 19 sectors in our analysis account for half of Eurozone HICP products and services. The main subcomponents that are not included are recreation and culture (8%), education & health (8%), rents/housing (7.5%) and other services/products that cannot be directly associated with a SPI or PPI. Overall, we find that there could be input price spillovers from food, fuels, textiles, computers, electronics and restaurants (see Table 2). These sectors account for about 33% of the HICP. However, if we remove non-core items, they only represent 12%. Furthermore, we note that there is a one to two months lag between a change in PPI and a change in HICP. As we expect input prices to continue to increase and peak around the summer, we could have a transitional spike in headline inflation at the end of the summer, but we do not expect a sustained pick-up in (core) inflation. We could however imagine two alternative risk scenarios that could lead to higher inflation: persistently high input prices or a policy shock affecting key sectors (e.g. climate policy with higher tax on energy industry, stricter regulation on food etc.).
Table 2 – Causality tests from PPI to HICP
Sources: Euler Hermes, Allianz Research
Exports cannot compensate for the lack of pricing power of Eurozone firms
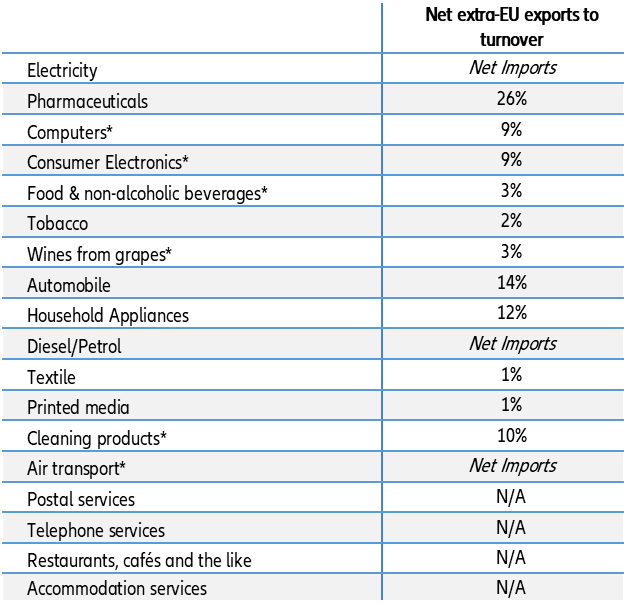
Unlike the Eurozone, Asia and North America have seen recent periods of higher inflation and the current pattern of recovery seems to point towards a similar divergence. In theory, Eurozone firms exporting outside the EU could ride along and benefit from higher selling prices. However, when looking at the 19 sectors analyzed, only the pharmaceutical sector has a significant ratio of net extra-EU exports to turnover (see Table 3).
Table 3 – Net extra-EU exports to turnover by sector
*due to data availability, the figures correspond to wider sectors (e.g. Transportation for Air Transport etc.)
Source: Eurostat, Euler Hermes, Allianz Research
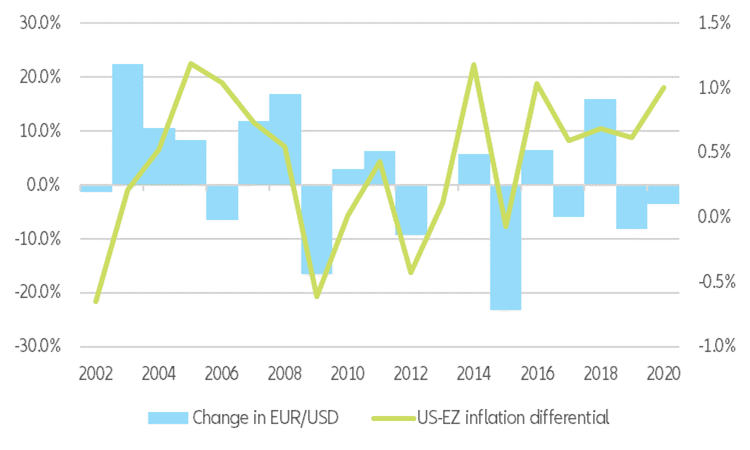
The exchange rate is an extra source of uncertainty for exporting sectors. The potential “offsetting mechanism” through exports can be reinforced or cancelled out by exchange rate fluctuations. Indeed, Eurozone firms could be able to sell at higher nominal dollar prices, for instance, but if in the meantime the euro appreciates, then the impact on profits in euros would be watered down. To illustrate this, we see that in 11 of the last 20 years, the euro appreciated while inflation was higher in the
US than in the Eurozone (see Figure 4). Symmetrically, higher selling prices and a depreciating euro would be a double boost.
Figure 4 –
US-Eurozone: exchange rate & inflation differential
Sources: Refinitiv, Euler Hermes, Allianz Research
Only pharmaceuticals, computers and consumer electronics are immune to rising input prices
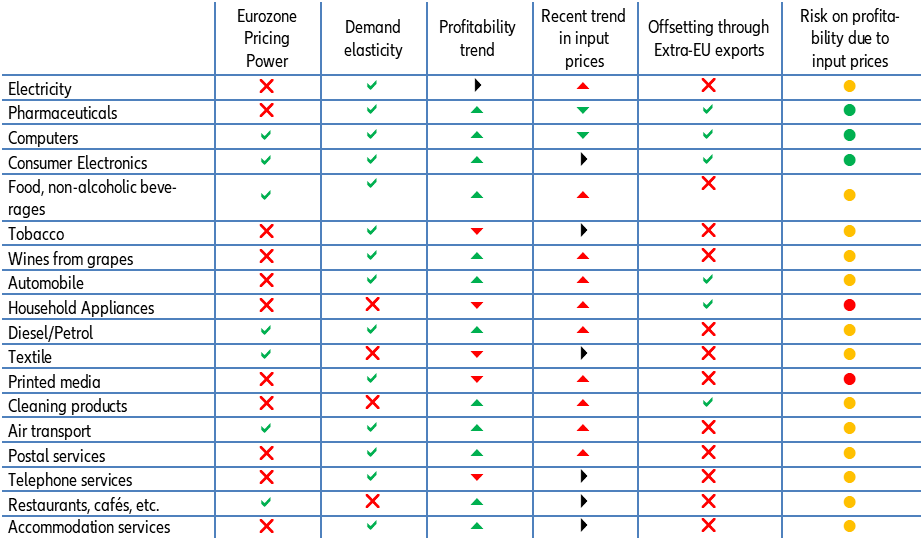
Using our previous findings, we assess rising input price-induced risk on profitability (see Table 4). We compute a risk score based on:
- short-term pricing power or its absence (0 or 1),
- demand elasticity (0 or 1, by comparing long-term changes in consumer prices relative to producer prices),
- five-year trend in profitability (0 for stable or increasing, 1 for decreasing profitability),
- recent changes in input prices (0 for stable or decreasing, 1 for increasing),
- And the ability to offset rising input prices through exports outside of the EU (1 if not possible, 0 if so).
By adding up the above-mentioned factors, we get a risk score from 0 to 5. Additional factors that we cannot measure can also increase risks for some sectors. For instance, the retail sector, one of the winners of the Covid-19 crisis, is playing hardball with the food sector currently and airlines are desperate to resume activity and regain market shares. As a result, although they could in theory pass on higher prices, they might not be able to or want to in order to (re)gain market shares. Although each individual firm needs to be assessed on its own, overall we find that firms in only three sectors (pharmaceuticals, computers and consumer electronics) will not be under pressure from rising input prices. The other sectors might remain under pressure for the next few months as we expect input prices to ease only in Q3 2021.
Table 4 – Risk assessment from rising input prices by sectors in the Eurozone
Sources: Euler Hermes, Allianz Research
Author

Sector Advisor and Data Scientist