- At a global level, companies’ leverage decreased by -3.2pp in 2017 to 53%
- Paper, transportation and textile are the riskiest sectors due to structural changes
- In the meantime, we note improvements in the resource sectors (energy and metals)
Global view - Wolfs hiding on the pastures green
We estimate a global net gearing ratio of a comfortable 53% on average when only considering companies with net debt on their balance sheet, i.e. excluding those with net cash. We are aware that total corporate gross debt outstanding amounts to levels anywhere between 28% (Mexico, 10/2017, source: BIS) and 330% (Luxembourg, 10/2017 source: BIS) of GDP of individual countries, but for the purpose of corporate leverage, our sample only covers public companies. The range around the public companies average is wide, with a low end of 3% (metals Morocco) and high end of 255% (paper Turkey).
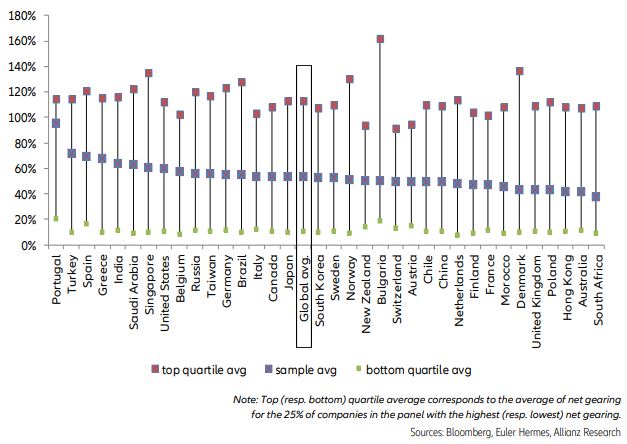
We find the highest net gearing on average globally in Portugal, with 96%, followed by Spain and Greece with 69% and 68%, respectively. Not without caveating against generalising on the basis of such a broad measure, we do allow for a conclusion of higher than average vulnerabilities in Southern Europe. Turkey also shows high gearing of 72%. On the same basis, risk is lowest in South Africa (38% net gearing), Australia (41%) and Hong Kong (42%).
Net indebtedness combined declined in 16 out of 18 sectors in 2017, confirming declining leverage. Balance sheet structures have strengthened curtesy of sustained earnings growth in a globally favourable environment: aggregate earnings per share of the S&P500 rose +14%, the Euro Stoxx 600 +86%, Nikkei +66%, Hang Seng +33%, and ASX +66% (source: Bloomberg).
When including companies with net cash, gearing has increased in 10 out of 18 sectors. We interpret this as deployment of excess cash either in the form of returns to shareholders or productive capex indeed. Earnings strength is there to stay with forecast earnings growth for 2018 ranging from +3% (Nikkei) to +22% (S&P500; source: Bloomberg). That should support further reduction of net debt.
Despite the globally positive picture, we see areas of significant risk as divergence around the average is huge. We find risk is concentrated in sectors that face significant structural change; in particular disruption from climate change, digitalization and changing business models rising to the surface for example in the paper, auto and energy sectors through new competitive dynamics and tightening regulation. Transportation will very soon have to adjust new climate change induced regulations and protectionism looming on the horizon. That energy is affected by accelerating climate change momentum goes without saying. We believe this to be only partially understood as the end game in many of these specifics is far from clear.
The highest gearing in the top quartile is found in paper, textile and transportation with 172%, 144% and 143%, respectively. These sectors also show the highest cash flow coefficients in our universe, 12.4, 10.5 and 8.7 years. Automotive manufacturers also exhibit a high cash flow coefficient, at 9.0 years. We consider these numbers as risky by themselves in accordance with credit rating benchmarks and in terms of a typical corporate being able to comply with debt covenants and service obligations. Additionally, all of these sectors face structural challenges as outlined above that make us see them as vulnerable.
Chart 1 Net gearing by countries