When Minsky strikes, Markovitz retreats. The Covid-19 crisis caused one the most severe financial market turmoil of the last hundred years. A historic slump was followed by a historic rally. Volatility reached levels unseen since the Great Financial Crisis. In such market phases, asset returns shift to the tails of their distribution. Usually, such extreme values do not occur in isolation, but spread across asset classes. Correlations increase, the benefits of diversification decrease. The financial market as a whole becomes systemically more unstable.
Increased tail co-movements between asset classes indicate the presence of a common risk factor. In the Covid-19 crisis, this common factor might have been the rush for liquidity. By this we mean the investors’ desire to build precautionary cash balances to hedge against the risk of income shortfall. In earlier crisis this common factor was for example a general shift in risk aversion, overvaluation, leverage, or market liquidity. The phenomenon of tail co-movement of asset prices is often referred to as spillover or contagion risk. Although most investors are aware of this risk, measuring it is a challenge. Correlation and Covariance are based on mean values. While the most common measure of tail risk – value-at-risk (VaR) – is not designed to provide explicit information about co-dependencies of risk. Value-at-risk is the expected loss over a given time horizon, at a pre-defined confidence level. For example, if the 95% weekly VAR of asset A is -8%, this means that the weekly return of asset A is expected to fall below that threshold approximatively two times in one year. VaR thus captures the tail risk of an asset from a partial equilibrium point of view.
We therefor use "CoVaR" to extent the analysis of tail risk to a general equilibrium view (with "Co" standing for contagion). CoVaR can be defined as the VaR of an asset subject to other assets being in distress, i.e. being at their VaR level. In technical terms, CoVaR captures the cross-sectional dependence between a specific asset and a set of assets. The ratio of CoVaR to VaR reflects the extent to which an asset is exposed to contagion risk from another asset. Let us take our example from above. The VaR of asset A at 95% confidence is -8%. Its CoVaR, which is conditional on asset B being at its 95% VaR, turns out to be -10%. The contagion factor is thus -10% / -8% = 1.25. A factor above one indicates contagion risk. A factor around one shows immunity. A factor clearly below one indicates diversification. In our example, this means that the 95% VaR of asset A is 25% higher when asset B is in distress.
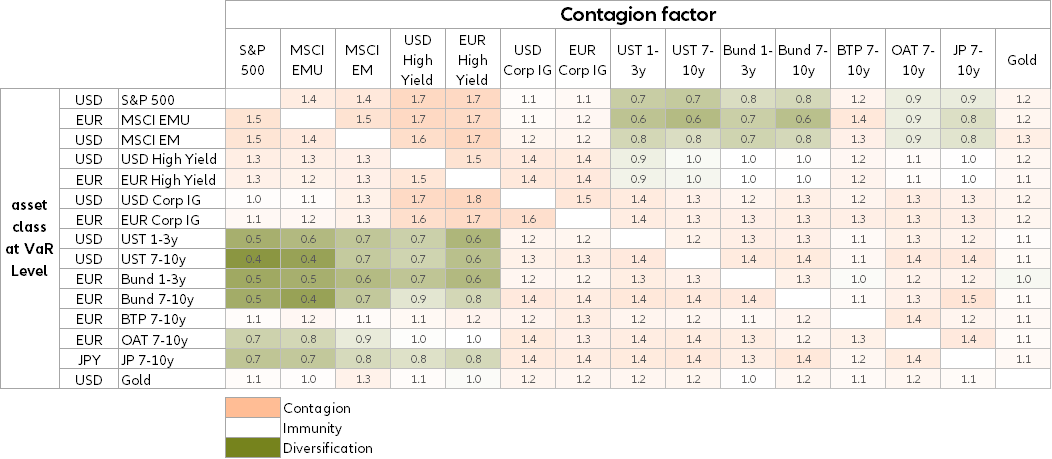
A matrix of these contagion factors across asset classes offers an easy way to map contagion risk. We apply this to a universe of 15 asset classes (equities, HY and IG bonds, government bonds and gold) using the 90% confidence interval for VaR and CoVaR based on rolling weekly returns. In a long-term view over the last 15 years, this matrix of clearly reveals contagion risks between asset classes with similar risk profiles (Table 1). Risky assets such as equities and HY bonds form one contagion cluster. Safe assets such as government bonds form another. To one another these clusters show immunity or even diversification. Two aspects are particularly interesting. First, unlike most euro government bonds the contagion structure of long-term Italian government bonds (BTP 7-10y) is more similar to a risky than to a safe asset. The euro crisis left its mark. Second, gold shows limited diversification properties when it comes to tail risk as one can observe slight contagion risks from most asset classes.
Table 1 – Long-term contagion matrix (last 15 years)
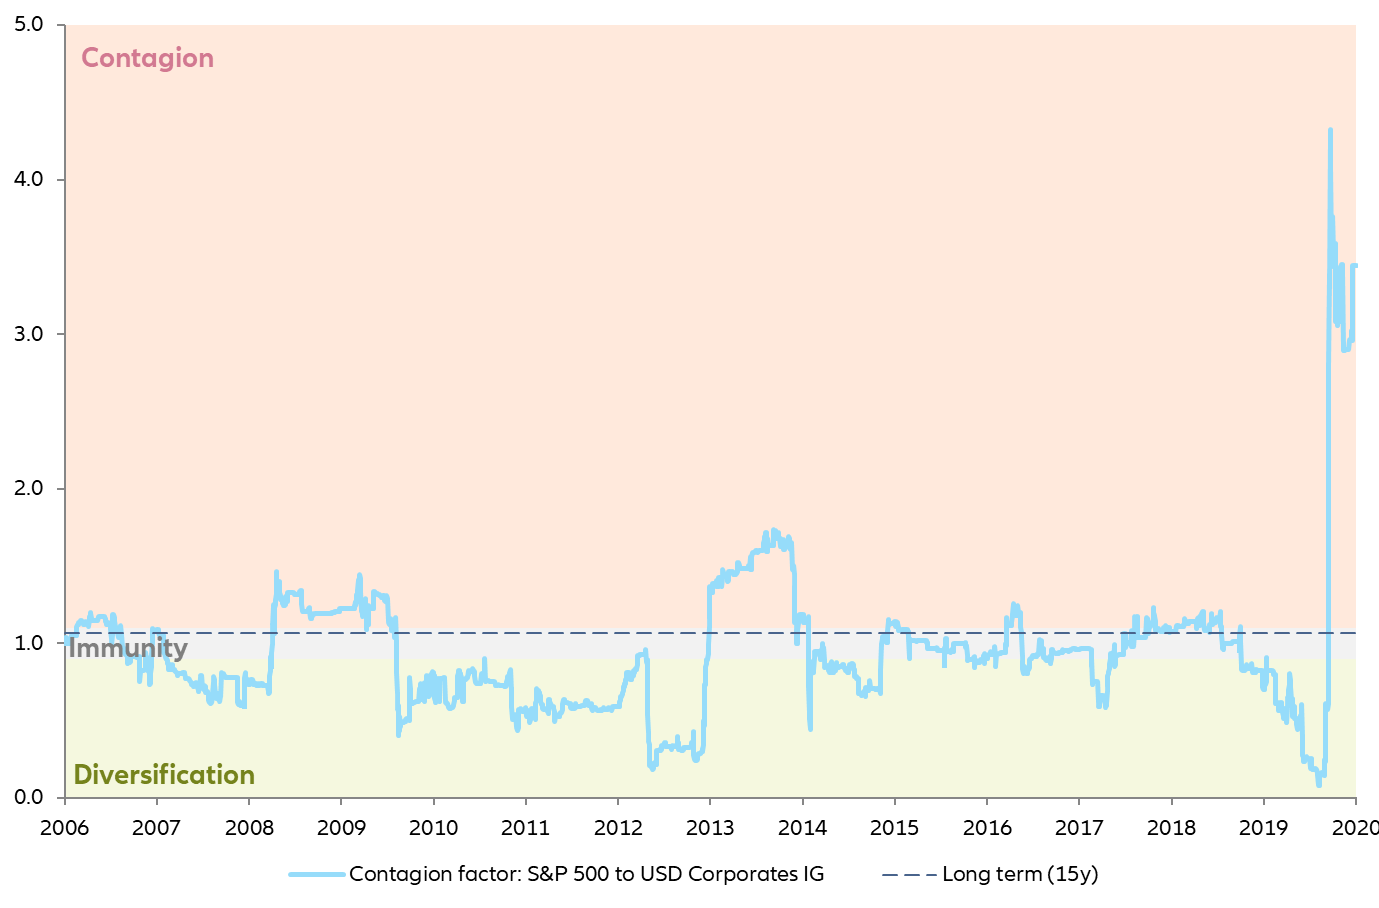
Increased tail co-movements between asset classes indicate the presence of a common risk factor. In the Covid-19 crisis, this common factor might have been the rush for liquidity. By this we mean the investors’ desire to build precautionary cash balances to hedge against the risk of income shortfall. In earlier crisis this common factor was for example a general shift in risk aversion, overvaluation, leverage, or market liquidity. The phenomenon of tail co-movement of asset prices is often referred to as spillover or contagion risk. Although most investors are aware of this risk, measuring it is a challenge. Correlation and Covariance are based on mean values. While the most common measure of tail risk – value-at-risk (VaR) – is not designed to provide explicit information about co-dependencies of risk. Value-at-risk is the expected loss over a given time horizon, at a pre-defined confidence level. For example, if the 95% weekly VAR of asset A is -8%, this means that the weekly return of asset A is expected to fall below that threshold approximatively two times in one year. VaR thus captures the tail risk of an asset from a partial equilibrium point of view.
We therefor use "CoVaR" to extent the analysis of tail risk to a general equilibrium view (with "Co" standing for contagion). CoVaR can be defined as the VaR of an asset subject to other assets being in distress, i.e. being at their VaR level. In technical terms, CoVaR captures the cross-sectional dependence between a specific asset and a set of assets. The ratio of CoVaR to VaR reflects the extent to which an asset is exposed to contagion risk from another asset. Let us take our example from above. The VaR of asset A at 95% confidence is -8%. Its CoVaR, which is conditional on asset B being at its 95% VaR, turns out to be -10%. The contagion factor is thus -10% / -8% = 1.25. A factor above one indicates contagion risk. A factor around one shows immunity. A factor clearly below one indicates diversification. In our example, this means that the 95% VaR of asset A is 25% higher when asset B is in distress.
A matrix of these contagion factors across asset classes offers an easy way to map contagion risk. We apply this to a universe of 15 asset classes (equities, HY and IG bonds, government bonds and gold) using the 90% confidence interval for VaR and CoVaR based on rolling weekly returns. In a long-term view over the last 15 years, this matrix of clearly reveals contagion risks between asset classes with similar risk profiles (Table 1). Risky assets such as equities and HY bonds form one contagion cluster. Safe assets such as government bonds form another. To one another these clusters show immunity or even diversification. Two aspects are particularly interesting. First, unlike most euro government bonds the contagion structure of long-term Italian government bonds (BTP 7-10y) is more similar to a risky than to a safe asset. The euro crisis left its mark. Second, gold shows limited diversification properties when it comes to tail risk as one can observe slight contagion risks from most asset classes.
Table 1 – Long-term contagion matrix (last 15 years)