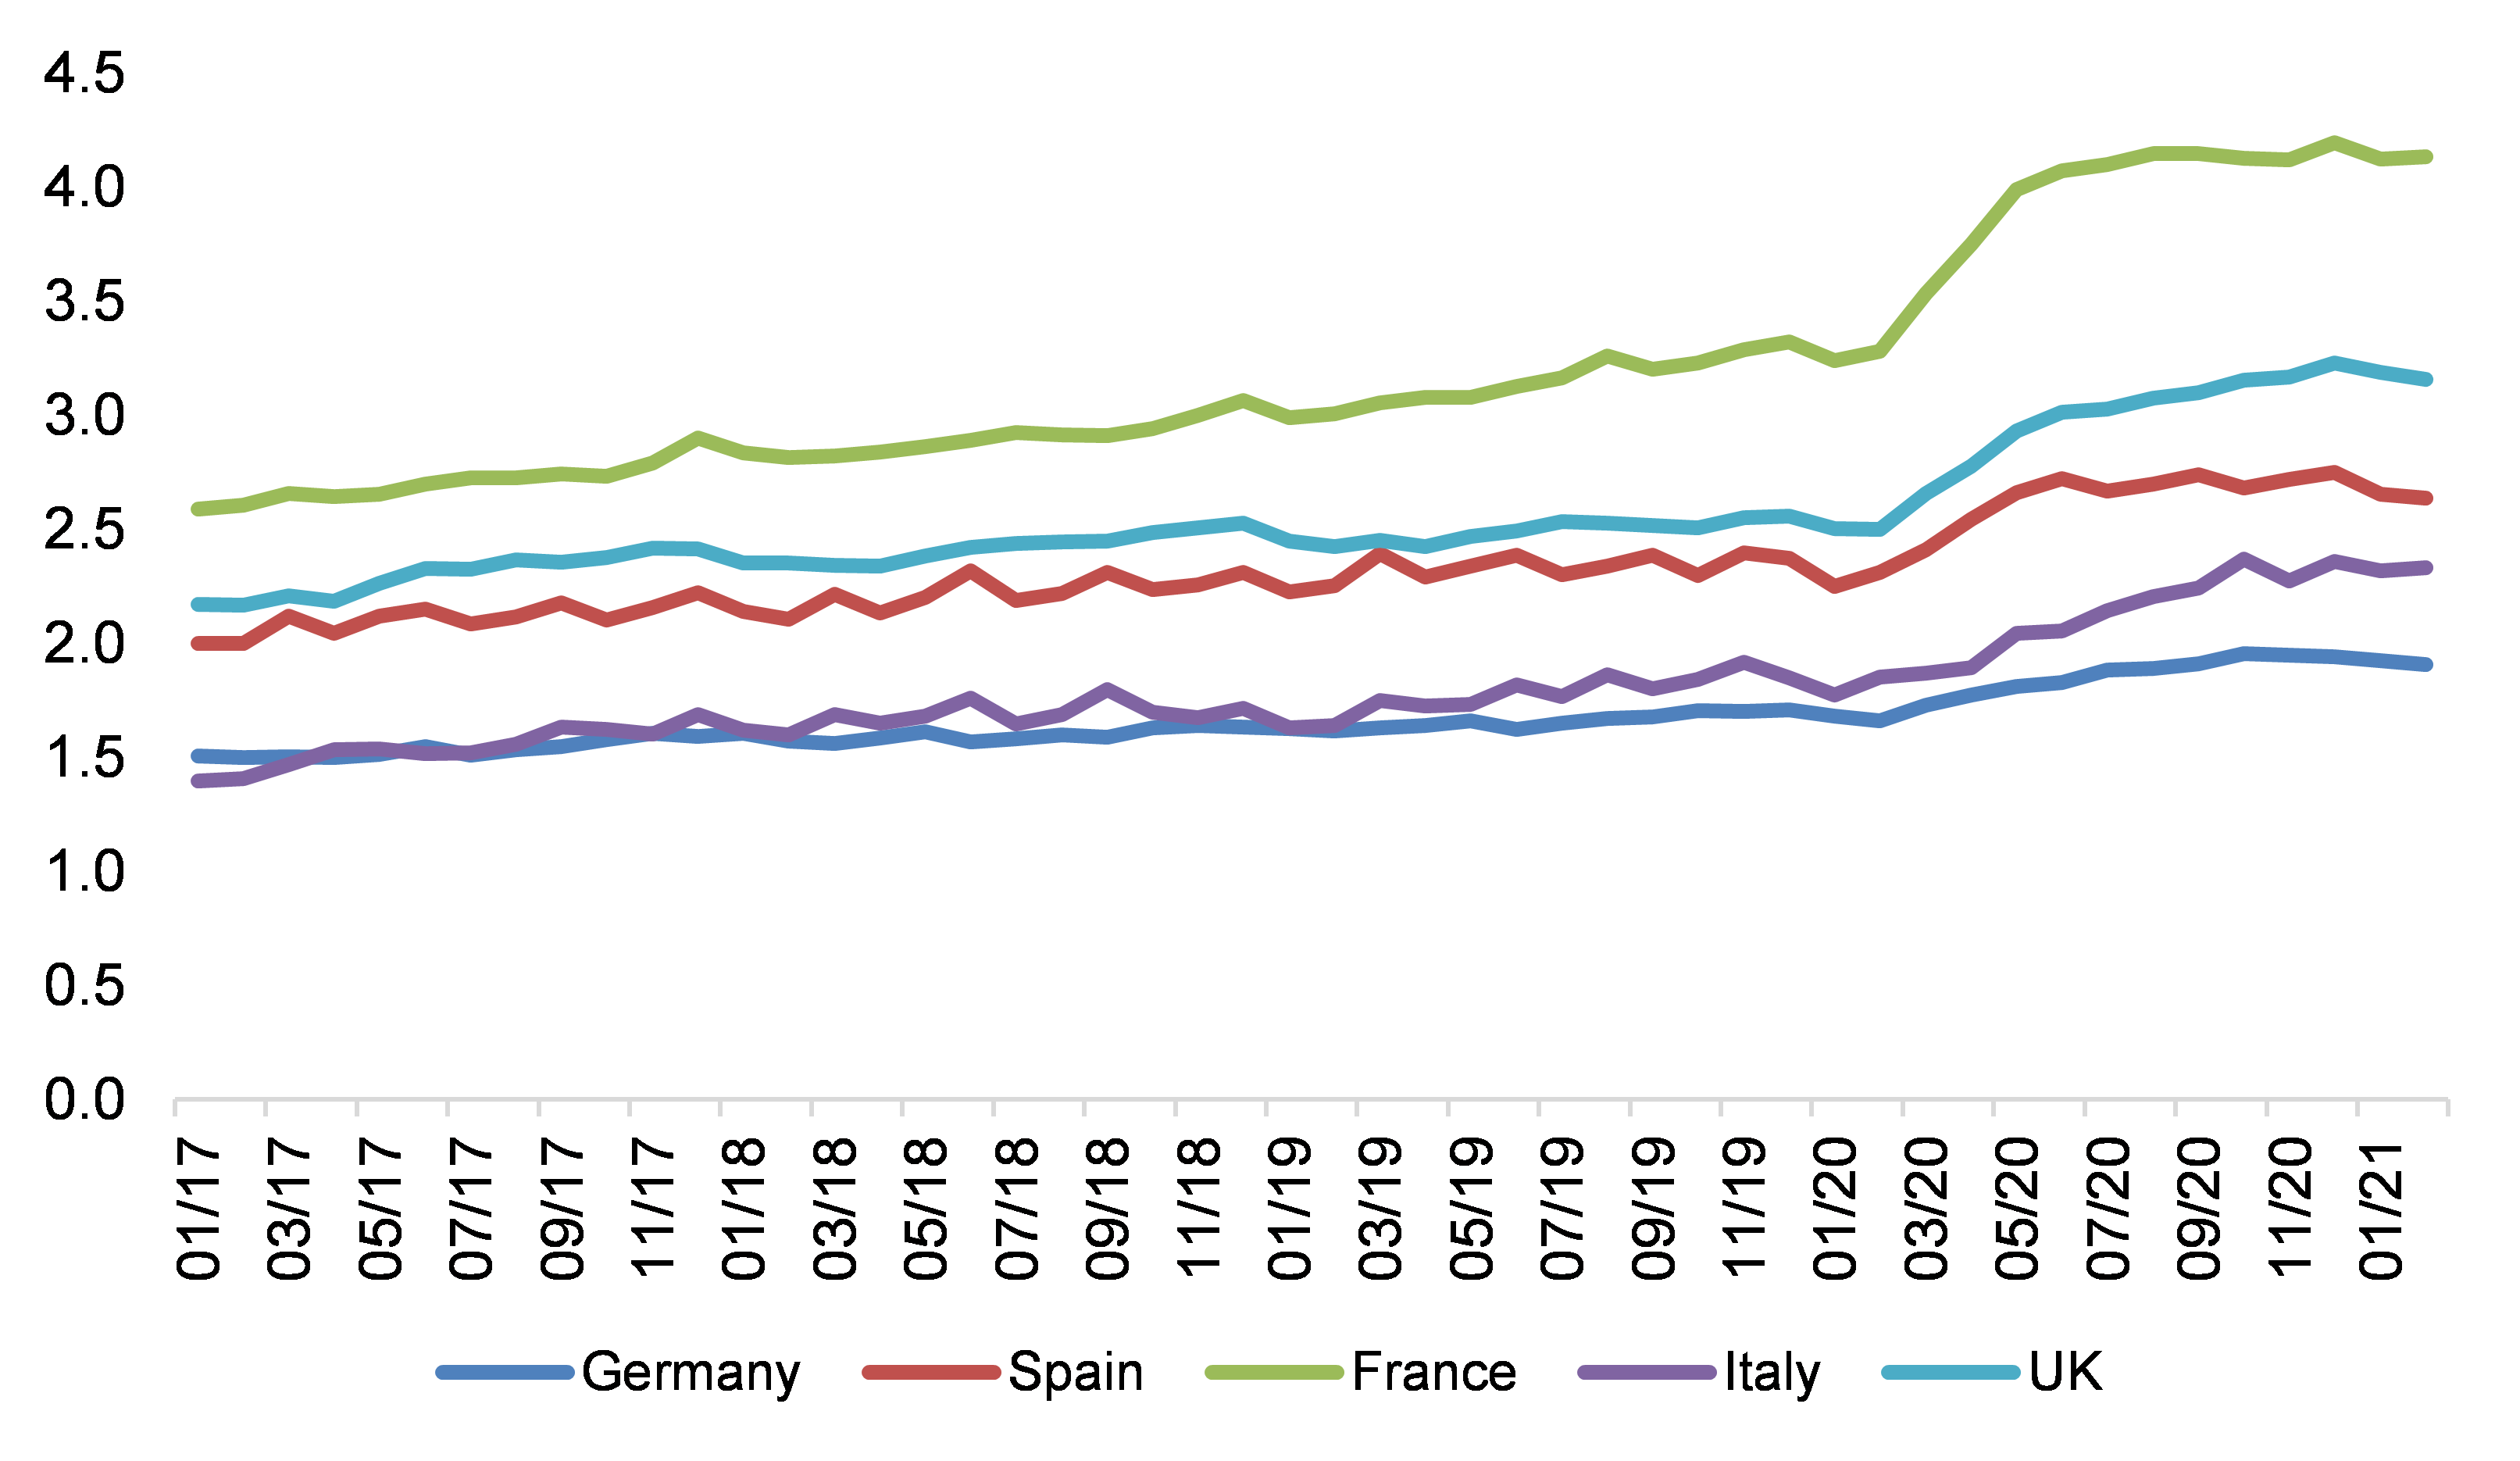
The Covid-19 crisis has pushed up cash concentration among European non-financial corporates: overall, NFCs now hold cash reserves equivalent to three months of turnover, more than half a month higher than pre-crisis averages, and it is the richest sectors and companies that have become even richer. After increasing considerably in 2020 in most European countries , non-financial corporates’ (NFC) cash has plateaued at high levels over the past few months. In France, total NFC deposits bring a cash-flow relief of more than four months of turnover, close to one month more than pre-crisis levels, while in the UK they are equivalent to close to 3.2 months, around 18 days above pre-crisis levels (see Figure 1). Given the continued light lockdowns across major European countries over the past few months, cash positions have remained quite sticky, raising upside risks for defensive and offensive investments in 2021.

Figure 1 – Total NFC deposits, months of pre-crisis turnover
 Figure 1 – Total NFC deposits, as a percentage of pre-crisis turnover
Sources: ECB, BoE, Eurostat, Euler Hermes, Allianz Research
Looking at the evolution of total cash positions in relative terms within countries, sectors such as industrials (mainly in Italy, Spain and to a certain extent the UK) and consumer goods (mainly in France and Germany) account for most of the cash hoarding of listed companies (see Figure 2 and 3). Yet, the increase in cash hoarding has also proved to be uneven within each sector to the benefit of the already richest companies. In the main European countries (see Figure 4), the top 10 cash surges in amount of cash were systematically higher than the average increase in relative terms, implying a higher concentration of cash. Looking at the financials available as of early April , the companies reporting the 10 largest increases in cash in 2020 posted a +56% increase (compared to +45% for the EU average) and were hoarding almost half of the total cash of listed firms. In view of this, governments have already started to implement progressive exit strategies from widespread fiscal support measures (see Figure 5).

Figure 2 – Cash-hoarding by sectors in main European countries (*), listed companies, EURbn
 Figure 2 – Cash-hoarding by sectors in main European countries (*), listed companies, EURbn
(*) Selected countries: Germany, France, Italy, Spain, Belgium and the Netherlands
Sources: Bloomberg, Euler Hermes, Allianz Research

Figure 3 – Increase in cash position for listed companies by sector, bn LCU
Sources: Bloomberg, Euler Hermes, Allianz Research
Figure 4 – Concentration of cash hoarding, listed companies, bn LCU
Sources: Bloomberg, Euler Hermes, Allianz Research
Figure 5 – Direct liquidity support provided to non-financial corporates, EURbn
Sources: Eurostat, Euler Hermes, Allianz Research
In addition, we find that large companies’ cash accounted for more than 70% of the total increase in NFC deposits in Germany at end-2020. However, it stood at 54% in France and close to or below 30% in Italy, Spain and the UK (see Figure 6).

Figure 6 – Increase in cash positions in 2020 by size of company, bn LCU
NB: Cash of SMEs is the difference between total cash position of NFCs and cash of listed companies.
Sources: Bloomberg, ECB, BoE, Euler Hermes, Allianz Research

Companies are likely to use around 50% of excess cash for financing rising working capital requirements and compensating for the strong rise in input prices against little pricing power. However, we also expect both defensive and offensive investment strategies in 2021. The increase in input prices due to current supply-chain disruptions are likely to drag NFC margins down by -4.5pp to -7.0pp in H1 2021 . Given the dependency on imports, we calculate that companies in Germany, the UK and France are likely to face the largest loss in gross operating surplus (see Figure 7). To this, rising working capital requirements in line with inventories financing and longer payment delays will also require additional financing in 2021.

Nevertheless, sectors with the highest cash positions are likely to embark on both defensive investment strategies (i.e. increasing productive capacities, modernizing existing production apparatus) and offensive ones, acquiring competitors that might be in weaker financial shape. Since the start of the year, we observe strong average M&A deals by Western European companies, both nationally and cross-border. The ITC sector registered the strongest increase, along with consumer non-cyclical and cyclical and industrials (see Figure 8).    

Figure 7 – Forecasted net cash position, bn LCU
NB: We calculate cash position based on total NFC deposits, latest data available is Feb 2021
Sources: ECB, BoE, Euler Hermes, Allianz Research

Figure 8 – M&A average deals, Western European acquirers, 4Q sum in USDbn
Sources: Bloomberg, Euler Hermes, Allianz Research