What to watch:
In focus – European housing – home (un)sweet home?
- The rapid tightening of financing conditions increasingly weighs on the housing market. Credit demand has weakened, and consumer confidence is low. There has also been a shift to variable-rate mortgages, suggesting that borrowers expect an improvement in financing conditions and do not want to lock in high rates. However, this also reflects continued interest-rate uncertainty as fixed-rate borrowing is becoming much more expensive.
- Supply constraints may cushion the adjustment on house prices, further exacerbating deteriorated home affordability. The total cost of purchasing a home has increased due to higher interest rates despite a decline in house prices. Together with the overheating in house prices in 2020-21 (or since 2014 for countries like Germany), debt burdens are becoming unsustainable, especially for the younger generation, which has mostly been priced out of the market.
- The ineffectiveness of public policies in tackling the structural challenges of home affordability contrast with the swift response to the temporary Covid-19 shock. As supply of new homes is scarce, well-functioning social housing and more balanced regulation of the rental market should become policy priorities.
Raising the roof – bipartisan deal on debt ceiling likely to focus on spending restraints amid growing fiscal deficits
According to Treasury Secretary Janet Yellen, the US could hit its debt ceiling as early as June 1, heightening a sense of urgency in Washington DC to avoid a default that would have consequences for the US and beyond. With the federal government at risk of exhausting its resources in a few weeks ,
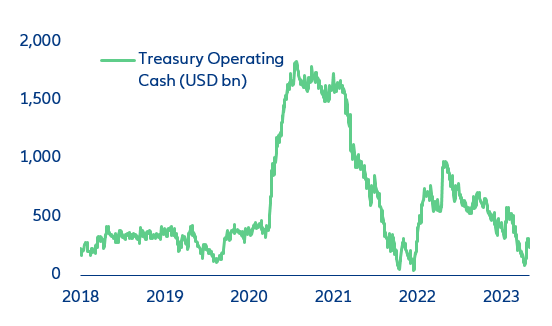
the US debt-ceiling drama is grabbing headlines again, although uncertainty remains high. The Treasury cash reserves hit a dangerously low level of around USD86bn in mid-April but have rebounded since then to above USD200bn (Figure 1).
Figure 1: US Treasury’s daily operating cash reserves balances
Sources: Refinitiv Datastream, Allianz Research
We still expect Congress Republicans and the White House to reach an agreement (even a temporary one), but an accident cannot be ruled out because of the tight legislative agenda. Neither the GOP nor the White House want to be accused of manufacturing a default. At the very least, the two sides could agree on a short-term suspension of the debt ceiling if reaching a comprehensive deal before 01 June appears unfeasible. The new deadline could then be pushed towards late July or end September – the end of the fiscal year – when a deal on spending levels for FY2024 will be necessary. However, there is a risk that the federal government could struggle to make payments on its debt by 01 June if cash resources are depleted much faster than anticipated in the next two weeks because of the tight legislative agenda. The House is scheduled to be in recess this week and again starting 26 May, while the Senate recesses the week of 22 May, returning 29 May. The chances of a misstep are therefore far from negligible. That is why the market is now assuming a much higher probability of a default this time around, with the one-year Credit Default Swap spread (the cost of insuring against a default) skyrocketing.
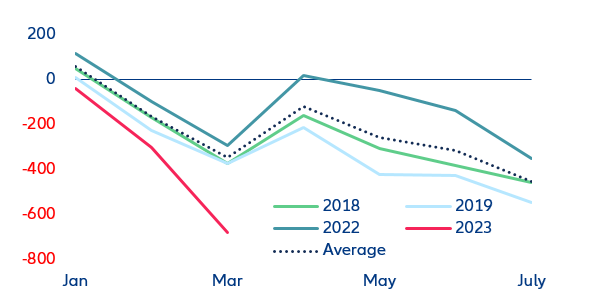
The core underlying issue of the debt-ceiling drama is how soaring spending has been blowing up the federal government deficit since the end of last year. In March, the Treasury’s cumulative shortfall (receipts minus spending) over the first three months of 2023 reached a whopping -USD679bn (Figure 2), much worse than in preceding years (excluding the pandemic years of 2020 and 2021).
Figure 2: Federal government cumulative funding shortfall (receipts minus spending), USD bn
Sources: Refinitiv Datastream, Allianz Research
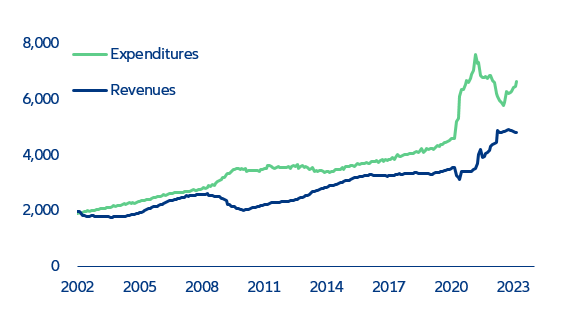
Federal income receipts have flattened off over the past few months, while spending has shot up (Figure 3). We previously warned of growing fiscal deficits in 2023 , although the pace of deterioration has been worse than expected. The spending-to-GDP ratio currently stands at close to 25%, up 3pps from before the pandemic, while the revenue-to-GDP ratio increased by only 2pps. The surge in government spending is the direct outcome of high inflation and high interest rates. The former has led to sharp cost-of-living adjustments (COLAs) in social spending to match higher prices. For instance, Social Security expenditures increased by more than +9% in January. The latter has fed rapidly into higher gross interest payments since the US federal marketable debt has an average maturity of only five years (shorter than most European countries). Gross interest payments reached USD565bn (12-month cumulative sum) in March 2023, up from USD394bn in March 2022. On the receipt side, the end of the Federal Reserve’s remittances to the Treasury – as the FOMC is now making (huge) losses – is depriving the federal government of the equivalent of 0.5% of GDP annually.
Figure 3: Federal government expenditures & receipts, 12-month cumulative sum, USD bn
Sources: Refinitiv Datastream, Allianz Research
Any kind of agreement will likely involve some form of spending restraints even though the White House refuses to sign off on any Republican-manufactured proposal for now. The Republicans passed their own bill at the House last week (the ‘Limit, Save, Grow Act’) that proposes sizable cuts to domestic programs but would spare the Pentagon’s budget. It would return funding for federal agencies to 2022 levels while aiming to limit the growth in spending to +1% per year (implying outright cuts in real terms). The GOP is also proposing to block Biden’s plan to grant student-loan forgiveness, repeal green-energy tax credits and kill new Internal Revenue Service (IRS) funding enacted as part of the Inflation Reduction Act (IRA) last year. While the current GOP bill has close to no chance of being signed off by the White House, we expect President Biden to eventually agree on some spending restraints – if not by June, given the tight schedule, by 01 October when the 2024 fiscal year kicks off. Spending caps on Social Security and Medicare will be hard to avoid, since these programs make up the bulk of federal government spending, although the Republicans may ease their demands by October on the back of a weakening economy. Grants to US states – which have shot up since the pandemic – could also be trimmed. On the other hand, the Republicans could compromise on some revenue-raising measures despite their fierce opposition to higher taxation. In any case, US fiscal policy is set to become restrictive from the end of 2023 and through 2024. This will exacerbate downward pressures on the economy at a time when tight monetary policy hits GDP the hardest (i.e. between mid-2023 and early 2024).
Italy’s bold vision – bold vision and fiscal challenges
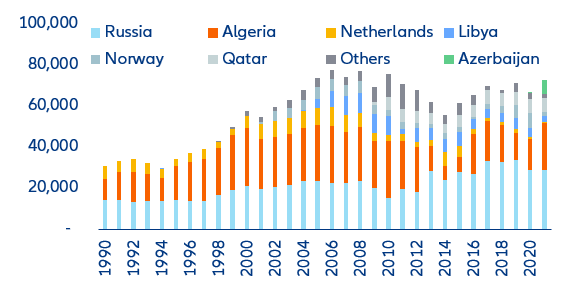
Since the outbreak of war in Ukraine, Italy has weaned itself off Russian gas imports remarkably quickly. For the last 20 years, Italy was worryingly dependent on Russian gas imports (40% of total gas imports as of 2021, Figure 4). But in the wake of the war in Ukraine, the government led by former Prime Minister Mario Draghi started looking for alternative supplies quickly and by October 2022, the share of Russian imports had dropped to 10%. Italy’s strategy to diversify gas imports comes from three main sources: Algeria via a pipeline in Sicily, the Trans Adriatic Pipeline arriving in Puglia and an additional contribution from LNG transported from different countries.
Figure 4: Italy – gas imports by country of origin
Sources: MASE (Environment and Energy Security Ministry), Allianz Research
Building on the successful energy-diversification talks, Prime Minister Giorgia Meloni recently launched an energy-cooperation agreement with Africa, dubbed the “Mattei Plan”, to use Italy’s storage capabilities to distribute gas from North Africa and the Mediterranean to the rest of Europe. More details about the ambitious plan to make Italy a central energy hub will be revealed in October but the first concerns have already arisen. First, geopolitical risks are on the cards as northern African countries are often subject to political turmoil, which could complicate negotiations. Moreover, a “European” solution would be better to address the energy-supply challenge rather than multiple national solutions that tend to benefit bigger and more industrialized countries. However, Italian energy companies such as ENI – the national energy company – have a good track record in investing in African countries, and have recently signed important gas collaboration agreements.
Given that the Next Generation EU funds will also contribute to improve the country’s energy strategy, recent “spending fears” are also justified. More than 30% of the resources allocated to Italy will support its green transition by investing in energy efficiency in residential and public buildings (EUR15.3 bn); sustainable mobility (EUR34bn) and the development of renewable energies and the circular economy and improvement in waste and water management (EUR11.2bn). In the first two years of the program, activation of public investment was moderate, so a strong catch-up in spending capacity is needed over the horizon to make up for the lags. All eyes remain on Italy’s administrative ability to manage an unprecedented amount of resources.
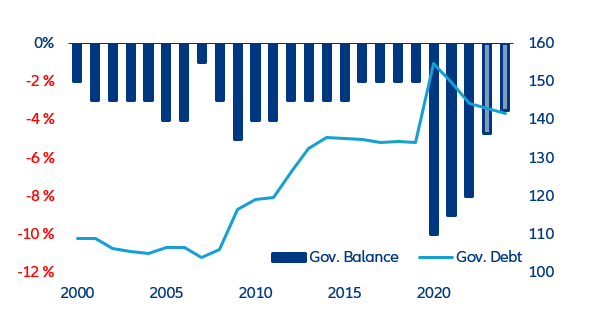
Another important test for the government will be the medium-term fiscal dynamics in a context of higher interest rates, normalizing inflation and slowing economic growth (Figure 5). Italian government debt-to-GDP decreased by more than 5pps in 2022 to 144.4% (down from the 2020 peak at 155%), helped by supportive growth and higher inflation rates. But the government deficit has been revised upward, given the new Eurostat accounting method for tax credits, applied widely with the “superbonus”. This scheme, in place since 2020, provides a 110% transferable tax credit to households for housing renovation works (of up to EUR200k) to improve the environmental efficiency of the housing stock. As a result, the fiscal deficit reached 8% in 2022, down from 9.0% in 2021 (-1.8% revision). But as the new methodology should have produced mainly backward revisions, we still expect a consolidation trend for the government balance in the coming years (our forecasts see the deficit at 4.7% in 2023 and 3.5% in 2024). Indeed, the new government is more fiscally prudent than previously expected, and some expensive and not-very-targeted measures (i.e. superbonus and universal income) have been tweaked in recent months.
Figure 5: Italy – government debt (rhs) and fiscal balance (% GDP)
Sources: Refinitiv Datastream, Allianz Research
However, we expect the ECB’s monetary policy tightening to impact Italian fiscal trends. Even with a higher overall debt level, sovereign interest payments continued to decline as a share of GDP until 2021, but this trend reverted in 2022. In fact, rapidly rising interest rates have significantly increased the Italian government’s debt-servicing costs and raised concerns about debt sustainability. We estimate the public debt burden to reduce only temporarily in 2023 (to 3.7% of GDP, given the price-slowdown impact on inflation-linked bonds) from 4.0% in 2022, but to increase again in 2024-2025 to around 4.2% of GDP. Despite the Italian debt-management agency having secured increasingly longer maturities (weighted average maturity around 7.6), which helps reduces rollover risks, debt sustainability will remain in the spotlight, especially after 2026.
Higher borrowing costs will put more pressure on Italy’s government budget and could raise fragmentation risk. Scaled-up public sector support since the onset of the pandemic and throughout the energy crisis has widened the budget deficit and delayed much-needed fiscal consolidation. Moreover, we expect fiscal adjustment to happen only gradually, given the current context, making it more difficult to reduce elevated government debt levels. In Italy, this could also increase fragmentation risk, causing a widening of the sovereign spread (so far contained). However, our estimates suggest that this risk remains rather small, also thanks to the robust signalling effect of the ECB’s transmission protection instrument (TPI).
Headed towards a “Minsky Moment” – what if the US banking crisis is not over?
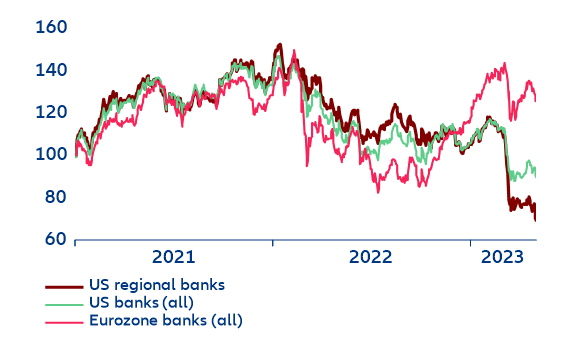
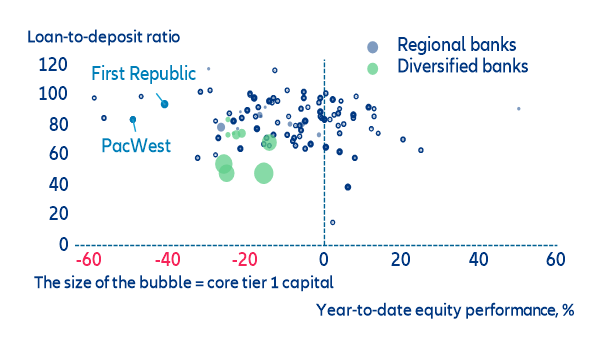
The scale of current US bank failures already exceeds the 2008 experience. PacWest Bancorp and Western Alliance Bank have become the latest US regional banks under stress amid general investor concerns about the financial health of both mid-sized lenders. Shares of both lenders kept sliding yesterday on the back of persistent deposit outflows triggered by high unrealized losses from fixed-income investments (Figures 6 and 7). Both banks have shed more than half of their market capitalization over the last couple of days. This comes just a day after the Federal Open Market Committee (FOMC) meeting, when Chairman Powell stated that supervisors were getting closer to containing the turmoil that has already claimed four failing banks this year (Silicon Valley Bank and Signature Bank in March, followed by the First Republic Bank last week). JPMorgan agreed on Monday to acquire the bank in a USD10.6bn deal after the FDIC took over the lender, making it the largest US bank failure since the 2008 financial crisis. The total assets of the three failing banks this year already exceed USD550bn, which eclipses the previous negative record of bank failures affecting a total of USD520bn during the height of the Global Financial Crisis in 2008 (involving 25 bank failures, including Washington Mutual with total assets of USD432bn).
Figure 6: Comparison of equity price performance – US vs. Eurozone banks (indexed, 1/1/2021=100)
Sources: Refinitiv Datastream, Allianz Research
Figure 7: US banks – equity performance vs. liquidity (loan-to-deposit ratio)
Sources: Refinitiv Datastream, Allianz Research
The stress in the banking sector is unlikely to abate with the Fed’s interest rates now above 5%. However, starting rate cuts in the near term would require financing conditions to be tight enough (especially due to more stringent bank lending) to lower demand and bring down inflation. Remedies for banks are limited as they cannot raise deposit rates to stop the haemorrhaging without hurting profit, while deteriorating credit conditions do not generate the volume growth to offset declining margins, especially as an inverted yield curve makes profitable long-term lending very difficult. Bank lending has started to decline for corporate loans and commercial real estate (CRE) loans, though consumer credit and residential real-estate lending remain resilient.
US real GDP rose +1.1% annualized in the first quarter, 0.8pp below consensus expectations. While consumption reaccelerated to 3.7%, business fixed investment slowed to 0.7%. More negative news from regional banks could further weigh on credit growth and real activity, increasing the likelihood of a US recession later this year, propagated in the sectors smaller, regional banks are most active in – CRE and small-business lending.
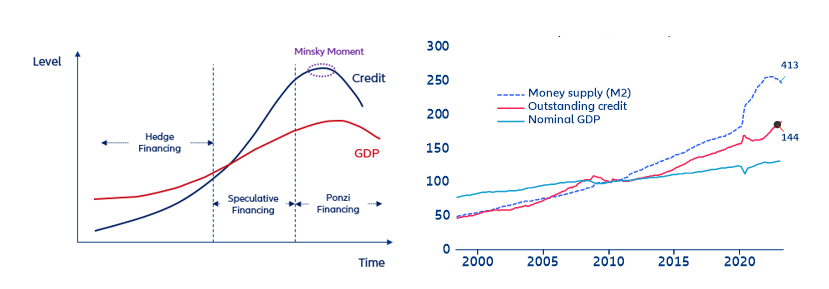
Figure 8: Stylized “Minsky Moment” and US monetary dynamics (money supply, credit growth and nominal GDP growth (indexed, 1/1/2010=100))
Sources: Refinitiv Datastream, Allianz Research
While spillover risks to the broader global financial system have remained limited, the chances of a “Minsky Moment” have increased (Figure 8). This term “Minsky Moment” describes a sudden collapse of asset values following a period of unsustainable growth, often leading to a financial crisis. The term was coined by economist Hyman Minsky (1919-96), who argued that periods of economic stability and prosperity often lead to increased risk-taking by investors and financial institutions, which increases asset-liability mismatches, leverage and interconnectedness, and thus system-wide vulnerability to changes in asset prices. Minsky's theory is based on the idea that the stability of financial systems can lead to complacency as investors and institutions become increasingly confident in their ability to generate profits. This confidence leads to increased borrowing and leverage as investors take on more and more risk in order to maximize their returns. However, as the risks of these investments increase, so does the likelihood of a sudden collapse. This can happen when investors begin to lose confidence in the underlying assets, leading to a rapid sell-off and a steep decline in asset values.
Will we see a systemic risk-triggered re-run of the 2008 crisis? After more than a decade of explosive money supply outstripping nominal growth, the highly financialized US economy has clearly entered a “Ponzi financing” regime, which typically unwinds in a “Minsky Moment”. Households and companies need to keep borrowing more to financing a rising debt burden without a realistic prospect of full repayment. This, in turn, can trigger a credit crunch and a wave of defaults and bankruptcies, leading to a broader financial crisis. While a comparison to the US subprime crisis and its systemic implications may be tempting, there are important differences – the valuation of “combustive material” (CRE) has already corrected significantly (though there is still downside risk), and when banks cut back lending, it tends to hit (riskier) small business lending first – this is nothing extraordinary. However, after a long period of excessive credit growth that increased system-wide leverage, policymakers need to act swiftly to shore up confidence in the banking sector to mitigate spillover risks from quantitative tightening and strengthen backstops to the financial safety net. This needs to be followed by a period of stabilization, with a focus on establishing debt sustainability, probably at the expense of higher growth.
Equity market sector rotation – Tech rising like a phoenix from the ashes
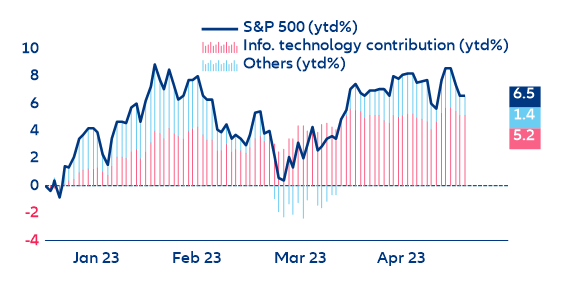
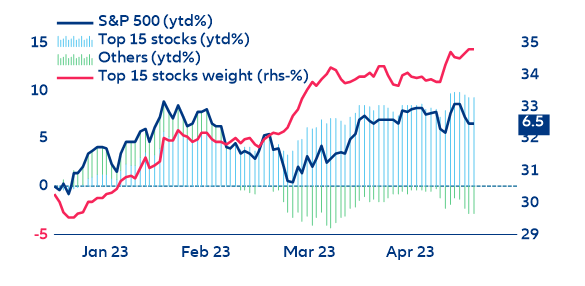
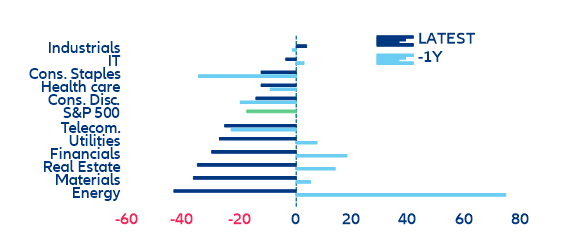
After a tumultuous 2022, the technology sector has been keeping US equity markets afloat, punishing both hawks and bears in the process. Last year was a rough one for equity markets due to a combination of higher short and long-term rates, recessionary concerns and sluggish earnings. These factors put pressure on corporate balance sheets, both from a spot and forward-looking perspective. In 2023, however, increased recessionary pressures leading to a more dovish bias paired with higher-than-expected balance-sheet resilience in certain sectors is leading to nearly double-digit market performance. But the technology sector alone accounts for a whopping 80% of the S&P 500’s year-to-date performance (5.15% of the 6.5%, Figure 9), raising concerns about the sustainability of the current market rally. In fact, a significant portion of the current rally can be traced back to the top 10-15 stocks of the S&P 500 in terms of market capitalization, with five out of the biggest six being tech companies. This means that the current and future performance of the US equity market is heavily dependent on just a few giants operating in a highly cyclical sector (Figure 10).
Figure 9: The technology sector dominates US year-to-date performance (%)
Sources: Refinitiv Datastream, Allianz Research
Figure 10: Top 15 S&P 500 stocks performance (%)
Sources: Refinitiv Datastream, Allianz Research
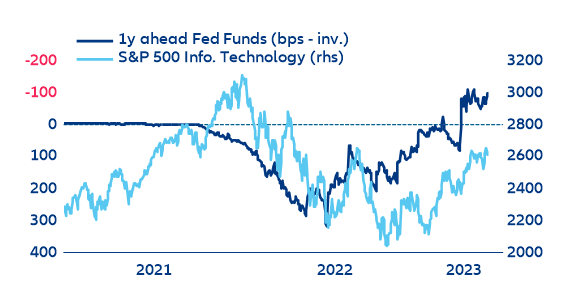
Despite the need for caution in the current market climate to avoid the Fear of Missing Out (FOMO) wave, there are two factors that have grounded the equity rally. The first is falling inflation combined with increasing recessionary pressures, as well as high short-term rates. These conditions have prompted a readjustment of forward-looking policy expectations and the pricing of a sharp monetary-policy pivot in the second half of this year and in 2024. Because of this, and due to the innate long cash-flow duration profile of tech companies, which makes the sector highly sensitive to changes in interest rates, tech companies have seen a technical upward repricing of both short and long-term valuations, which has fueled the equity rally (Figure 11).
Figure 11: S&P 500 technology vs Fed Funds expectations (USD and bps)
Sources: Refinitiv Datastream, Allianz Research
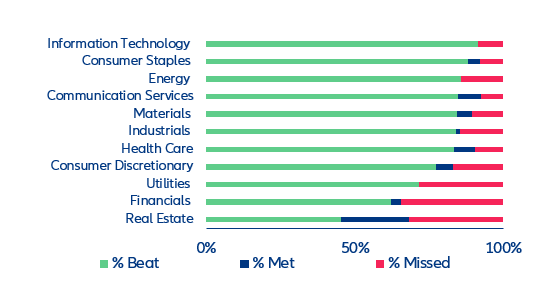
The US Q1 earnings season also contributed to the rally, with results from the 69% of companies that have reported so far indicating a better-than-expected situation. Information technology has been leading the charge, having beaten 91% of earnings expectations and outperforming the other sectors. The tech sector also comes in second in terms of earnings-expectations readjustments: While the earnings revisions breadth is slightly tad negative, it still outperforms all sectors except for industrials. From a fundamental perspective, this means that the IT sector partially deserves the relevance it has gained in the year-to-date performance of the S&P 500, and that the sector's overperformance can be “partially” justified by better-than-expected fundamentals (Figures 12 and 13).
Figure 12: US Q1 earnings season – earnings expectations by sector (69% reported)
Sources: Refinitiv Eikon, Allianz Research
Figure 13: US earnings revisions breadth by sector (3mma)
Sources: Refinitiv Datastream, Allianz Research. Earnings revisions breadth: # earnings expectations revised up as % of total # of earnings revisions
However, while many factors influence equity performance, initial conditions tend to play a crucial role in determining mid to long-run outcomes. Unfortunately, when compared to other regional markets such as the Eurozone, US equity markets continue to look expensive as an asset class, and this is particularly true for the technology sector. All in all, and despite experiencing close to 15 years of continued rallies, the technology sector remains a question mark when it comes to future performance.
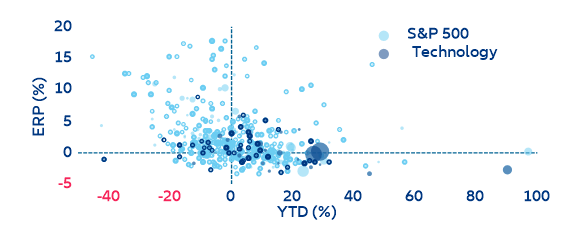
In this regard, a closer look at the equity risk premium of the technology sector versus the overall S&P 500 reveals that most technology companies, especially the big ones, are located close to or even within the negative equity risk premium area, despite showing some bias towards positive year-to-date returns. While it may continue to outperform in the short term if fundamentals improve and policy expectations remain dovish, it is unlikely to maintain such a broad overperformance over time. As a result, we are hesitant to overweight the technology sector within our equity positioning. In general, we prefer quality fixed income over equity at an asset class level, given the high yields in high-quality fixed-income markets (Figure 14).
Figure 14: S&P500 and technology equity risk premium vs year-to-date performance (%)
Sources: Refinitiv Datastream, Allianz Research. Note: the size of the bubbles indicate the market capitalization.
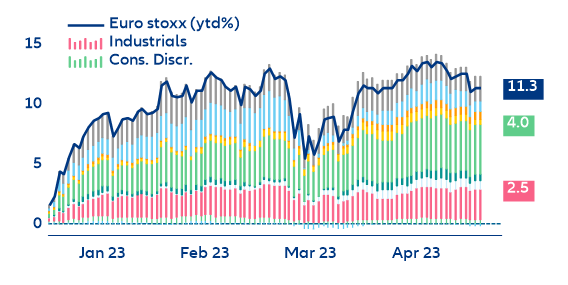
The situation across the pond is vastly different, with the Eurozone equity market's performance being more diversified. The biggest contributing sector to the recent market rally has been consumer discretionary but it accounts for only 35%. However, while the Eurozone enjoys better valuations and fundamentals than
the US equity market, it has its own set of challenges. Sectoral divergence, particularly with regard to banking-sector concentration, make a cautious approach necessary when considering certain European regional equity markets (Figure 15).
Figure 15: Eurozone equity performance and biggest sector contributions (%)
Sources: Refinitiv Datastream, Allianz Research
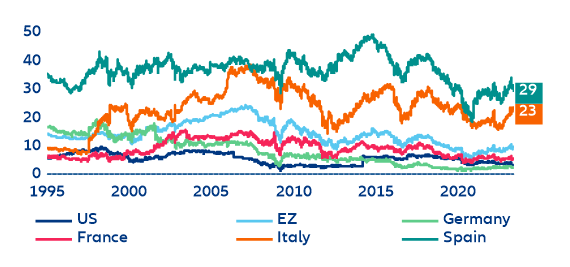
In this regard, Italy and Spain's regional equity markets are highly dependent on their respective banking sectors. While this sector has partially justified the significant year-to-date overperformance of these regions (~15%), it also exposes their markets to extreme fragility. If the US regional banking crisis spills over into the Eurozone, these markets would be particularly vulnerable. However, this is not our base case scenario (Figure 16).
Figure 16: Banks as a % of regional equity indices (%)
Sources: FTSE, Refinitiv Datastream, Allianz Research
Overall, we expect single-digit total return performance for 2023. This makes the current equity rally a bit too strong for our taste, reaffirming our preference for quality fixed income over equity in 2023.
Encouragingly, forward-looking indicators already point to a rapid decline in services inflation in the next eight to nine months (Figure 19). The trimmed CPI measure produced by the Fed of Cleveland (which excludes outliers’ values) indicates that sequential CPI inflation stepped down in March to +0.2% m/m – the lowest outturn since December 2020.
European housing—home, (un)sweet home?
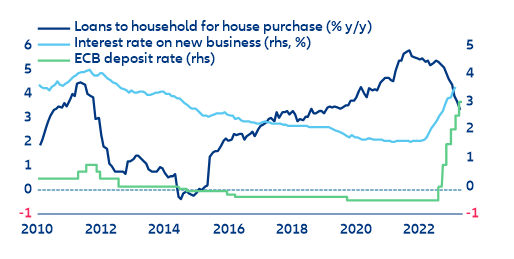
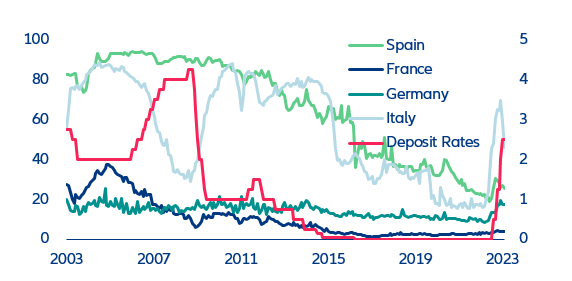
The rapid tightening of financing conditions increasingly weighs on the housing market. As the ECB keeps hiking interest rates (+25bps yesterday and a further 25bps expected in the upcoming meeting), households face higher borrowing costs for home purchases; interest rates for new loans increased to 2.05% in February (up from 1.61% in April last year). Moreover, the ECB’s latest Bank Lending Survey (BLS), released earlier this week, confirmed gloomy prospects for housing credit, which has already cooled to 3.3% y/y in March (down from 3.7% a month earlier). Credits standards for loans for house purchases have become tighter across all the major Eurozone economies, given banks’ higher risk perceptions and lower risk tolerance. Credit demand has also declined but less than in Q4 2022, which saw the highest rate of credit contraction since the survey began in 2003 (Figure 17). Interestingly, consumers in some countries opting for variable-rate loans, indicating that they do not want to “lock in” high rates (Figure 18). This suggests they expect rates will be lower in the medium term.
Figure 17: Eurozone loans for house purchase – annual growth vs. interest rates (new business)
Sources: Refinitiv Datastream, Allianz Research
Figure 18: Share of variable rate loans (% of total new loans) vs. ECB deposit rate
Sources: ECB SDW, Refinitiv Datastream, Allianz Research
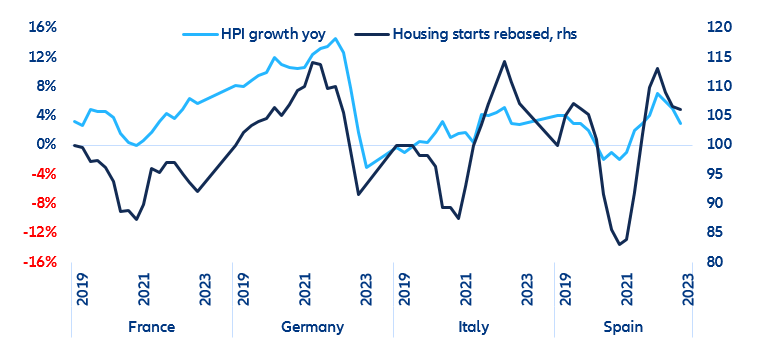
Supply-side constraints slowed the decline in house prices (Figures 19 and 20). Diminishing supply of new homes since the onset of the pandemic (restrictions on activity, multiple supply-chain disruptions and materials inflation) is set to continue as real estate developers maintain a cautious approach, given the gloomy growth prospects and higher borrowing cost. Housing starts are below 2019 levels in
Germany and
France, while in
Italy and Spain they remain above but declining from the post-Covid boost. When it comes to existing homes, households have not yet felt the urge to sell and the extraordinary protective measures (e.g. evictions moratorium) have similarly reduced supply; the rapid increase in the cost of materials has also kept demand away from houses that need renovation.
Figure 19: Compared evolution of nominal house prices (%yoy, lhs) and housing starts (rebased as of Dec. 2018, rhs)
Sources: National sources, OECD, Refinitiv Datastream, Allianz Research. Note: HPI growth in nominal terms; Housing starts as the rolling sum, rebased as of Dec2018. The labels in the x-axis coincide with the beginning of the year.
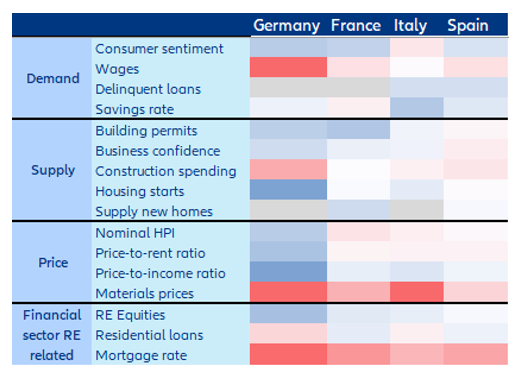
Figure 20: Heatmap of the yearly changes in key variables for residential real estate Latest available date for each indicator (z-scores)*
Sources: Refinitiv Datastream, Allianz Research. Note: Latest available date for each indicator (z-scores); the z-scores are computed over a 20 year-period, or the maximum available when the series has less than 20 years of history; grey cells reflect missing data.
France and Germany’s housing markets are most at risk of (further) price adjustments. We forecast real house price corrections of up to 5% until mid-2024, which would amount to a cumulative correction of 15% compared to end-2021. In France, household demand for new residential mortgages has fallen to historical lows since the second half of 2022. Italy and Spain could muddle through with stagnant property prices. In Italy, the number of potential buyers in the real estate market already decreased over the past year and the average time to sell a house and the average discount on prices have increased after hitting a 10-year low in early 2022. Overall, the shortage of housing is a common feature in all countries, which will counterbalance the downward price pressures and help avoid a crash. In this context, there are increasing calls for more government measures in affordable housing.
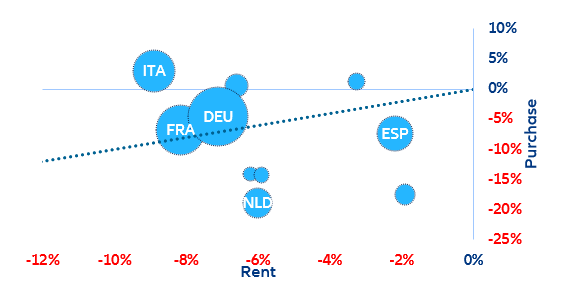
More social housing could be the solution to help first-time home buyers that are increasingly priced out of the housing market. The de-coupling between house prices and wages has worsened with the inflation in essential goods that followed the war in Ukraine and the monetary policy U-turn. Households now face budget constraints on multiple fronts, and those that have not already embarked on purchasing a home are not likely to be able to do so in the coming two years. In terms of rent affordability, things are not better, especially in Italy, Germany and France.
Figure 21: Cumulated house affordability losses (vs. rent in x-axis ; vs. Purchase in y-axis) of European households since 2019
Sources: OECD, Refinitiv Datastream, Allianz Research. Note: affordability here is only based on prices; Bubbles size based on GDP; nominal disposable income per head used for affordability measurement. The EZ countries without label are Austria, Belgium, Finland, Greece and Portugal. Dotted line represents an equal affordability loss for purchases and rents.
Public investment in social housing in the Eurozone has not significantly increased since the global financial crisis. Government expenditure for housing has largely stayed the same relative to GDP (0.4%). The largest economies have even decreased their relative expenditure on housing:
Germany went from 0.5% of GDP in 2009 to 0.4% in 2021,
France from 1.0% to 0.9% in the same period and Spain from 0.1% to 0.0%.
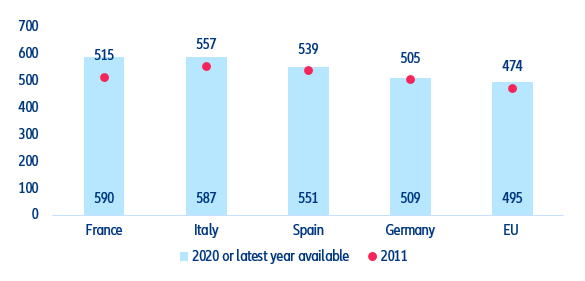
Italy remained stable at 0.0% in both years. This could explain why the stock of social housing is at around 3.2% in
Germany, 2.4% in
Italy, 14.0% in
France and 1.1% in Spain. Providers of social housing also vary from country to country: in
Italy, 96% is provided by public agencies; in France, 53% is provided by non-profit or cooperatives and 46% by regional public agencies. In Spain, 100% of social housing is provided by other types of providers. Data for
Germany are not widely available, but most social dwellings are provided by public institutions or cooperatives. The more dependent the housing market is on the private sector, the more vulnerable it is to business cycles. When it comes to effective social housing policies, the Eurozone could take cues from successful initiatives in Japan and Scotland. Programs that encourage the building of housing through favorable property taxes have proven to be successful in Japan, while Scotland offers a range of funding mechanisms to build affordable homes. Appropriate urban planning also provides a gateway to improve the housing crisis.
Figure 23: Dwellings per thousand inhabitants
Sources: OECD, Allianz Research
Authors
Ludovic Subran
Allianz Investment Management SE
Roberta Fortes
Allianz Trade
Jordi Basco-Carrera
Allianz Investment Management SE
Jasmin Gröschl
Allianz Investment Management SE
Maxime Darmet
Allianz Trade
Maddalena Martini
Allianz Investment Management SE
Patricia Pelayo-Romero
Allianz SE
Pablo Espinosa-Uriel
Allianz SE