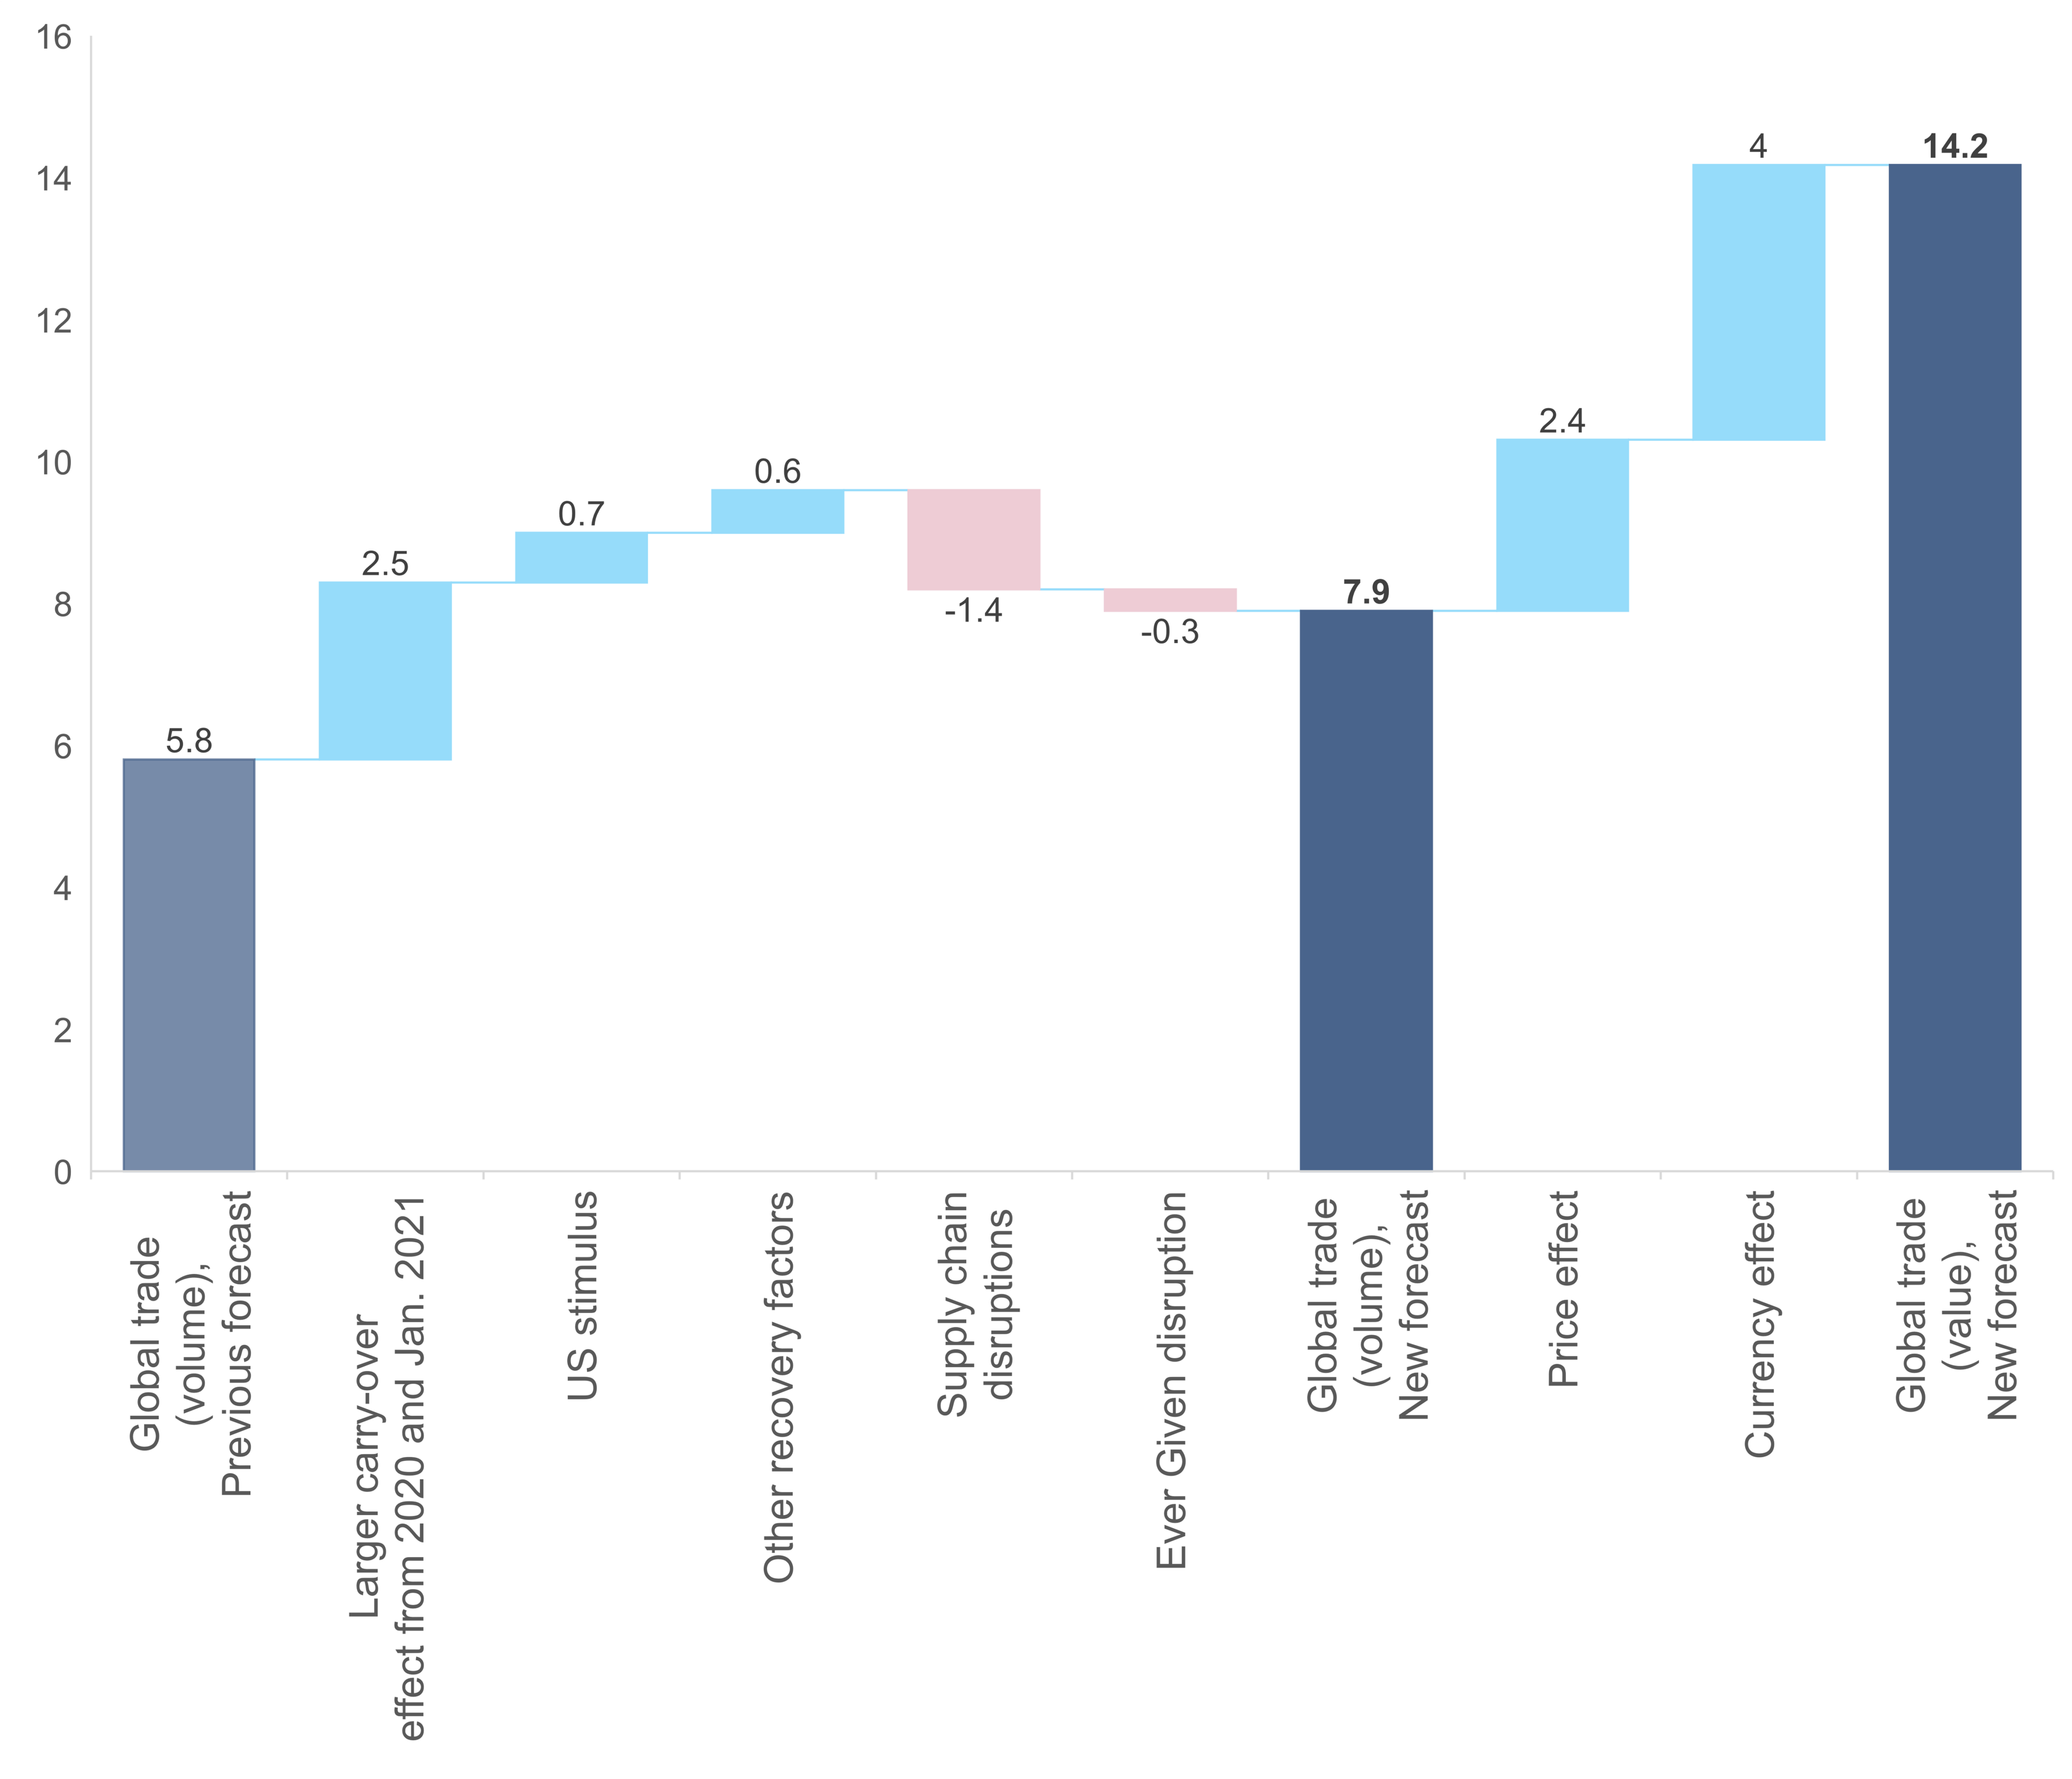
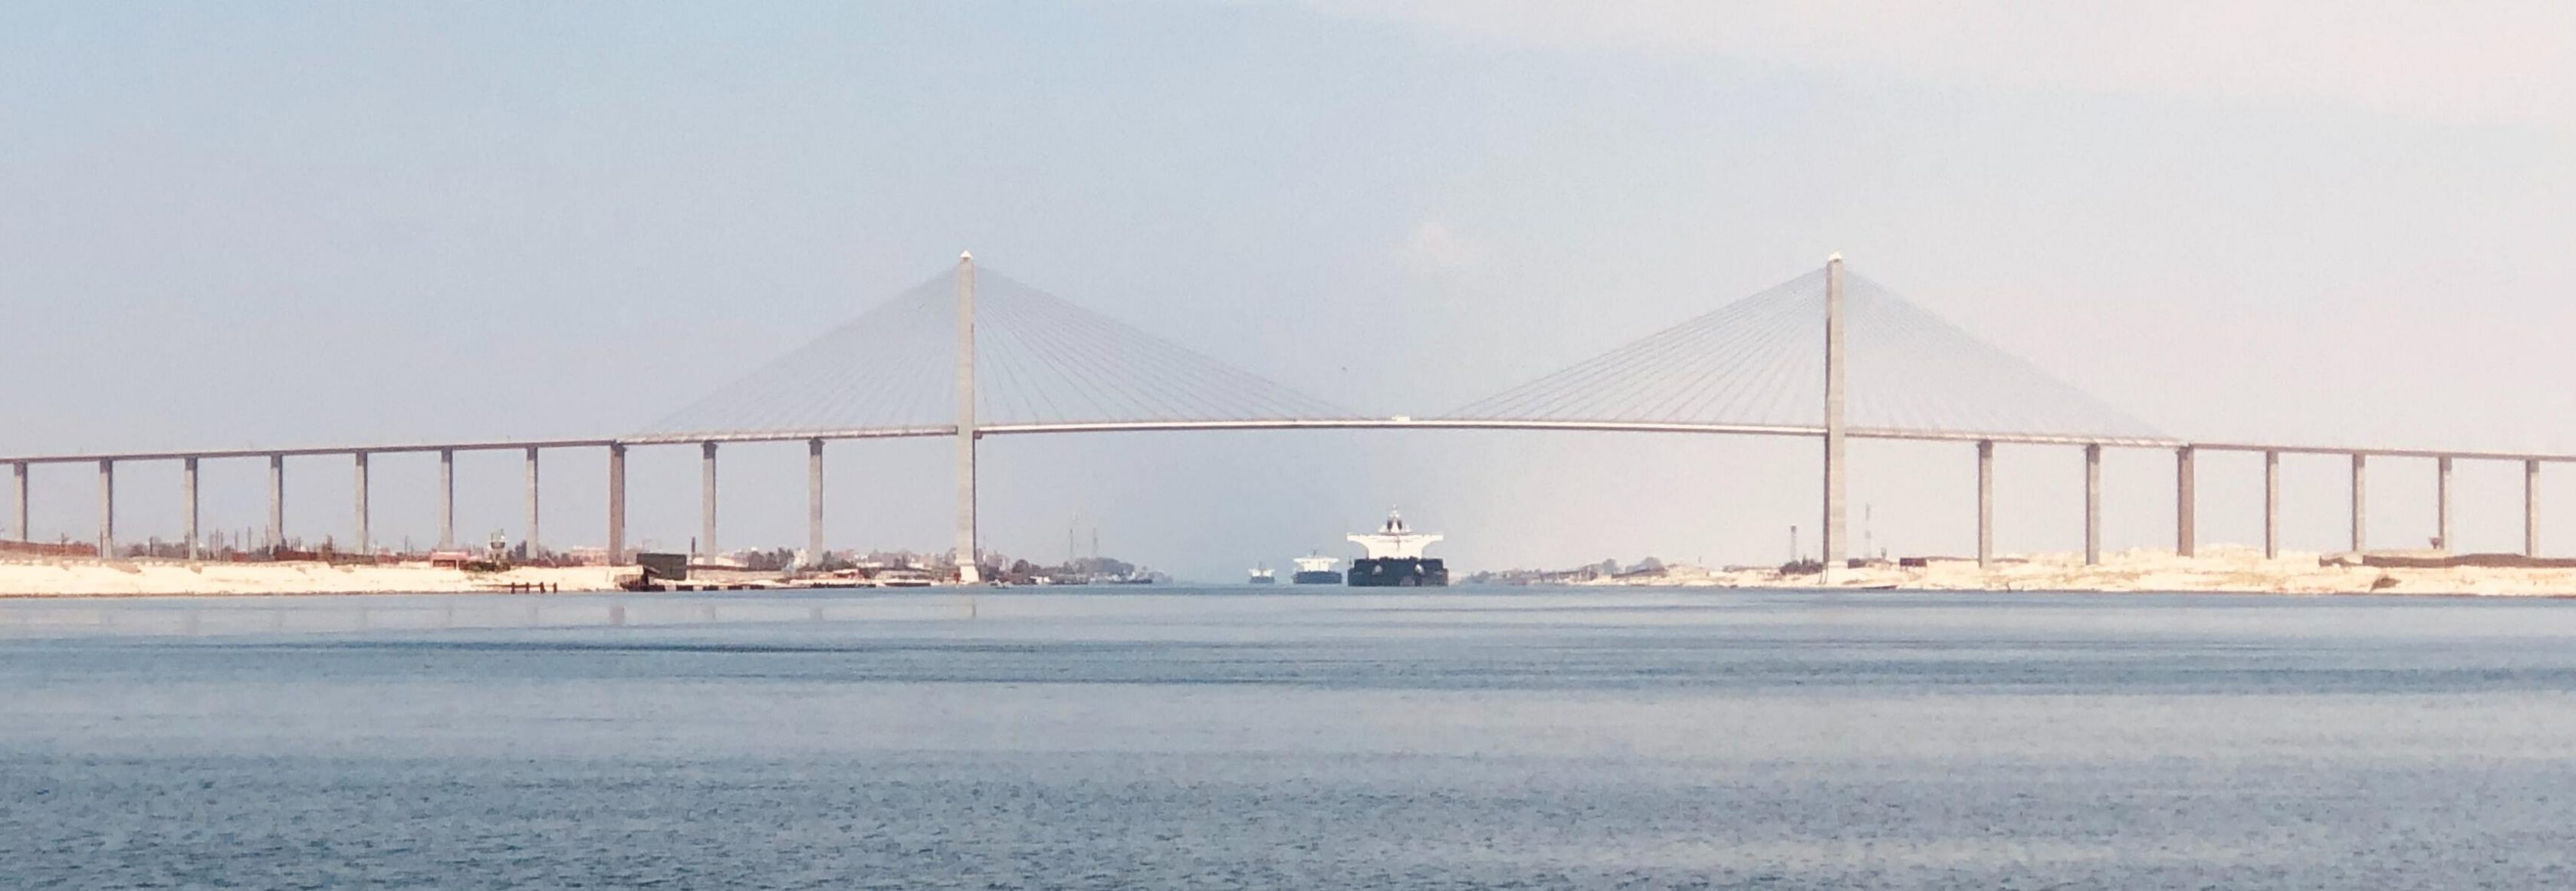
On 23 March 2021, a 400-metre-long container ship ran aground in the Suez Canal in Egypt. We calculate that each day of immobilization could cost global trade USD6bn-10bn. The Suez Canal is the gateway for the movement of goods between Europe and Asia, and welcomed over 19,000 ships in 2019, or 1.25 billion tonnes of cargo. This represents around 13% of world trade so any blockage is likely to have a significant impact. In particular, this incident will likely result in shipping delays of everyday items for consumers around the world. According to Lloyd's List, every day it takes to clear the obstruction will disrupt an additional USD9bn worth of goods. Rough calculations suggest westbound traffic is worth around USD5.1bn daily while eastbound traffic is worth USD4.5bn. Yet, coping mechanisms are in place. According to our estimation, every week of closure should cost from -0.2pp to -0.4pp of annual  trade growth. Note that in our trade forecasts, we assume the vessel will only block the Suez Canal for one week.

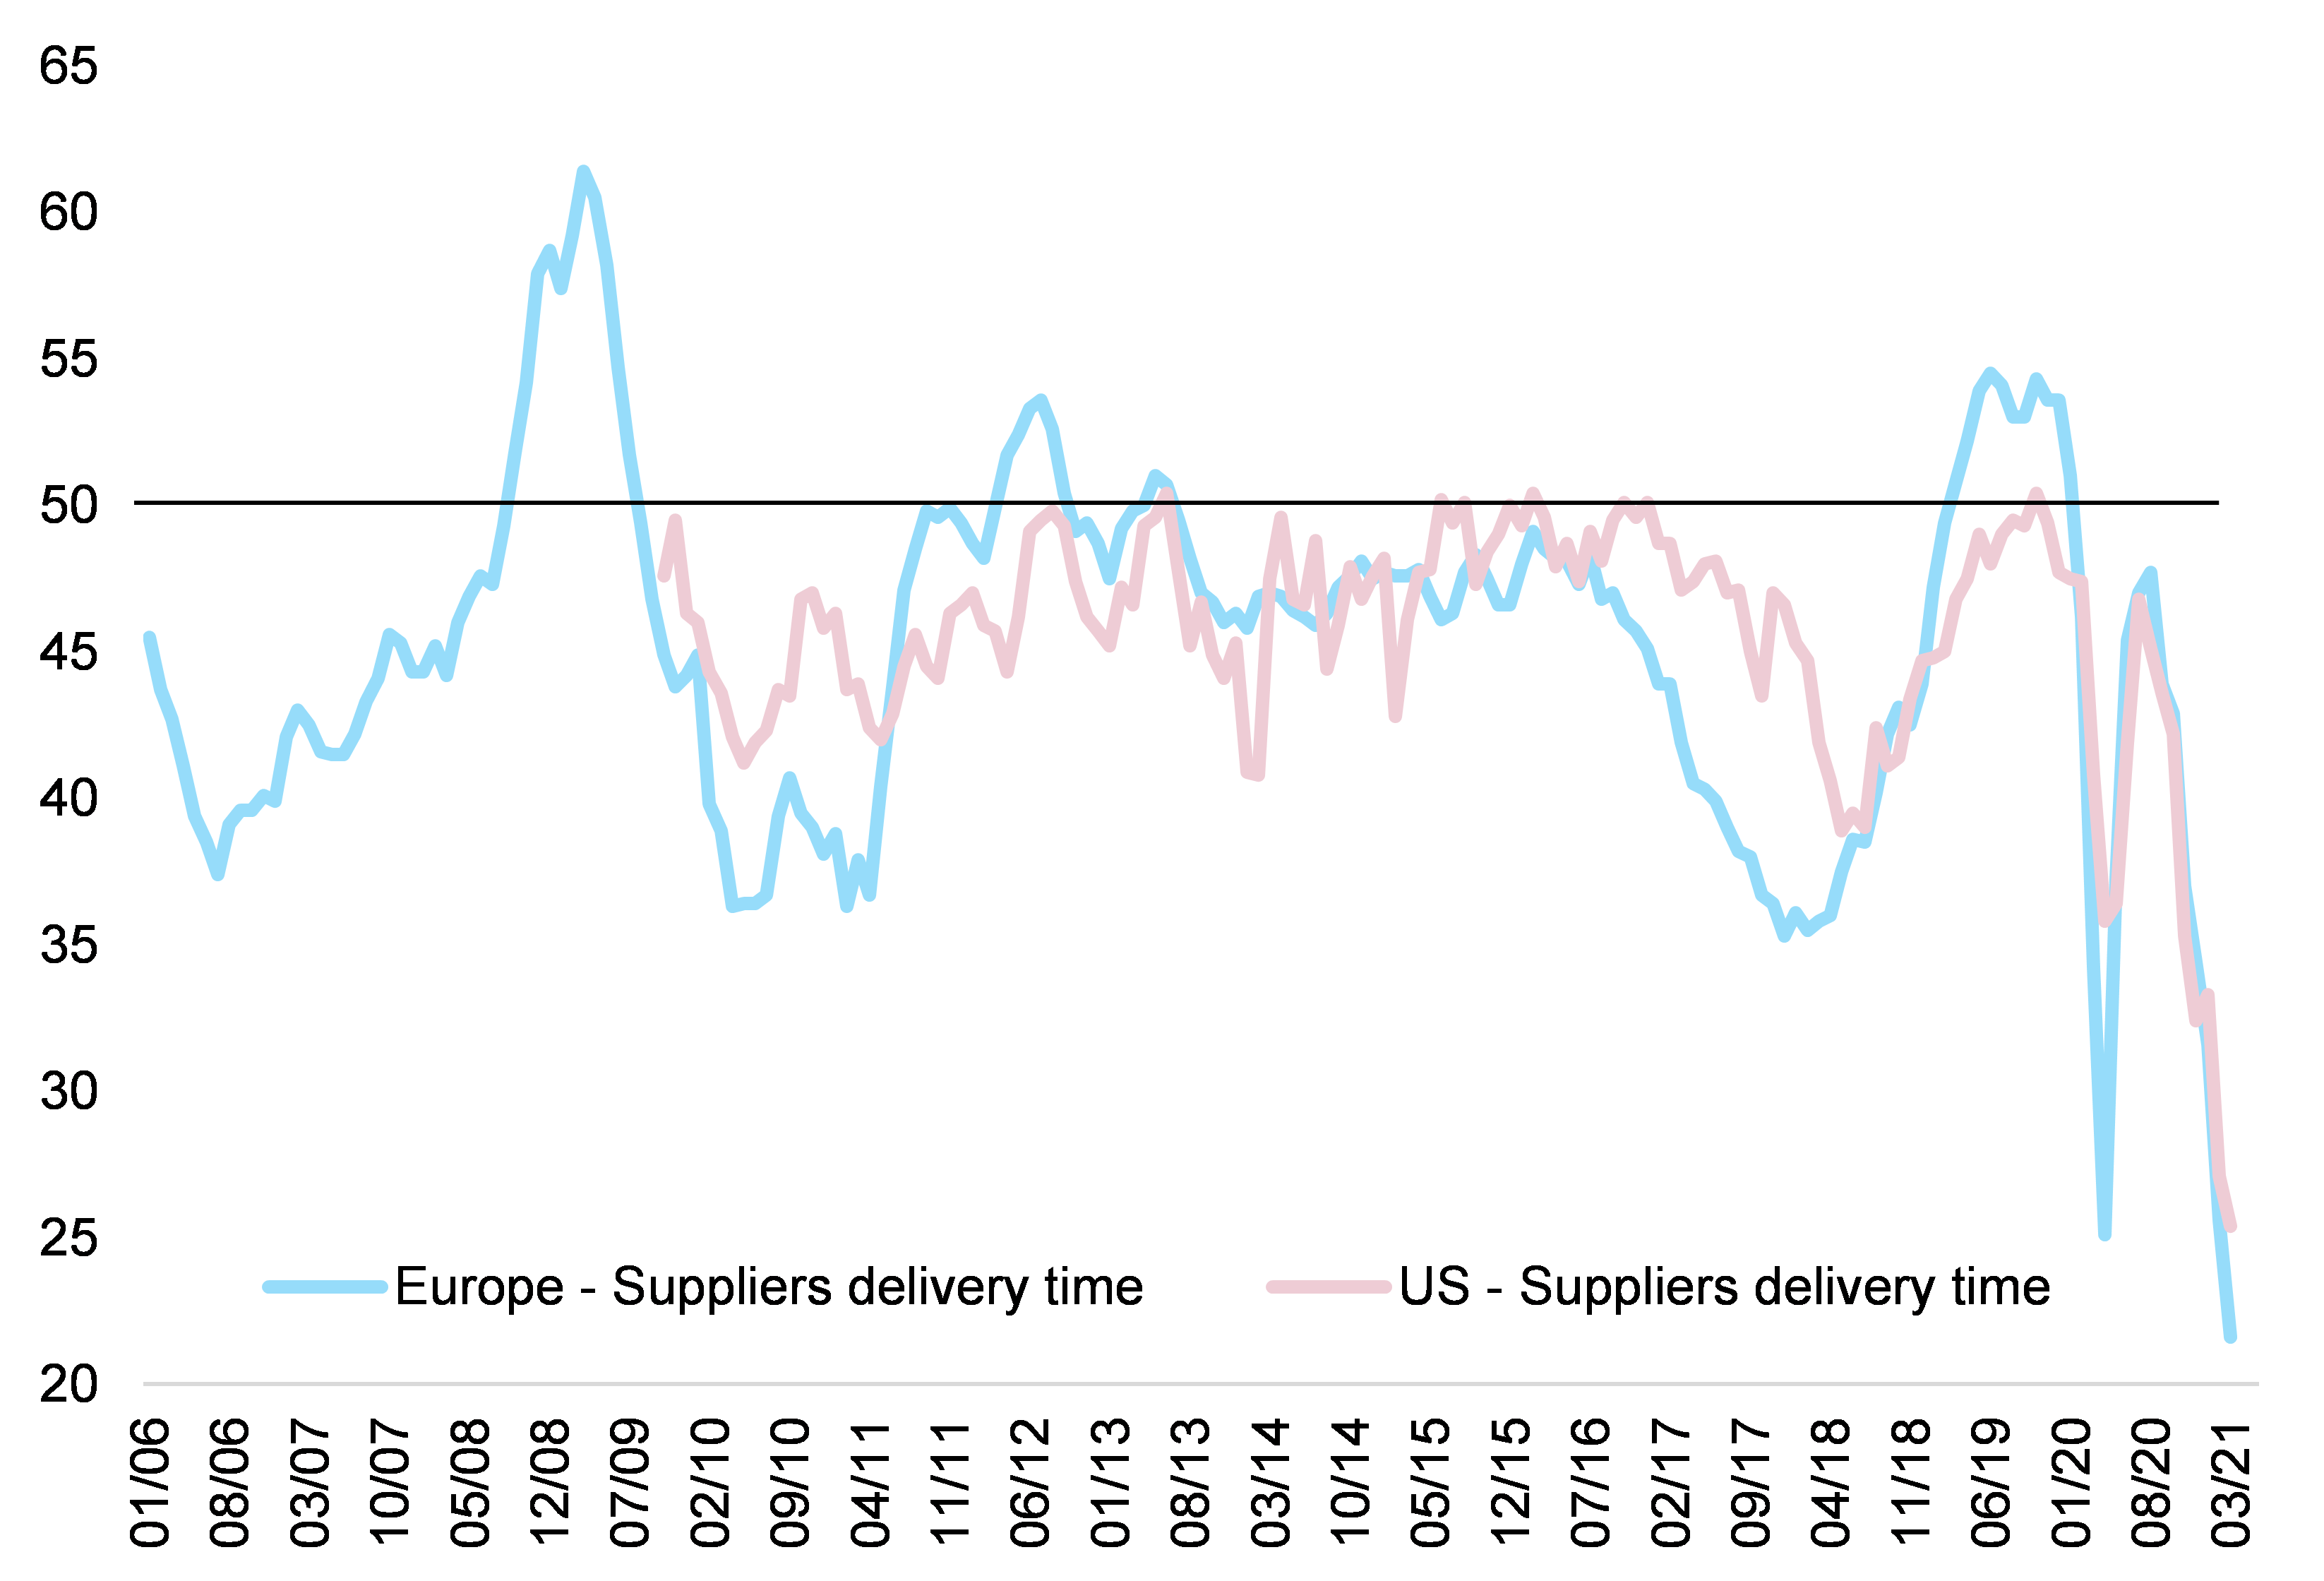
The problem is that the Suez Canal blockage is the straw that breaks global trade’s back. Supply-chain disruptions since the beginning of the year (shortages of containers, semi-conductors, etc.) could cost real trade growth -1.4pp or roughly USD230bn of direct impact, on top of the immobilization in the Suez Canal. First, suppliers’ delivery times have lengthened since the start of the year and are now longer in Europe than during the peak of the Covid-19 pandemic in 2020 (see Figure 1). The indicator slump, from peak to trough in March 2021, is equivalent to what happened in 2020 between January and April for Europe and is almost twice as bad for the US. The lengthening of suppliers’ delivery times for the US could be explained by the rapid depletion of inventories in the manufacturing sector as companies anticipate a demand boost caused by President Biden’s stimulus (see Figure 2). In Europe, this rapid deterioration of delivery times last February was chronicled in our last report: Is the Chinese ox reflating the world, one container at a time? All in all, the deterioration of suppliers’ delivery times in Europe and the US could subtract -1.4pp of growth from real global trade in 2021 and cost roughly USD230bn in value terms, all other things equal (Figure 3). 

Figure 1 – Suppliers’ delivery times in the manufacturing sector (the lower the index, the longer the delivery times)

 Figure 1 – Suppliers’ delivery times in the manufacturing sector (the lower the index, the longer the delivery times)
Sources: Markit, Euler Hermes, Allianz Research
Figure 2 – Stocks of finished goods in the manufacturing sector (above 50 = expansion)
Sources: Markit, Euler Hermes, Allianz Research
Figure 3 - 2021 global trade growth forecast, %, y/y

Note: we assume the Ever Green vessel will only block the Suez Canal for one week. Supply-chain disruptions should take a toll on our Q2 2021 forecast in particular, which will be only slightly positive (and the lowest in 2021) and at risk of being negative if disruptions linger.

Sources: IHS Data Insight, Euler Hermes, Allianz Research

Second-round effects will be much more important as the main impact channel is prices. Supply-chain disruption is hurting European input prices in particular. Looking at the relationship between suppliers’ delivery times in the manufacturing sector and input prices, we find that on a y/y basis, the impact is higher in Europe (coefficient of -1.38, R² of 63%) and its transmission is relatively fast (one month), while in the US the dependency is lower (coefficient of -0.95, R² of 38%). Hence, we expect European companies’ margins to be hit harder compared to the US where the pricing power continues to be limited, with a higher gap between input and output prices compared to the US (see Figure 4).

Last, taking into account negative disruptions and positive drivers, we forecast global trade to grow +7.9% in 2021. However, excluding base effects, volume growth should only reach +5.4%. Supply-chain disruptions should take a toll on our Q2 2021 forecast in particular, which will be only slightly positive (and the lowest in 2021) and at risk of being negative in case disruptions linger. A significant carry-over effect due to the recovery in late 2020 and strong January merchandise trade figures (in part due to China) are propping up our forecasts for 2021. In other words, should global trade remain at its January level for the rest of 2021, annual 2021 growth would surpass +4% for goods and services (2.5pp higher than our previous carry-over estimate). Instead of +7.9% real growth, we would thus have had +5.4% without this increased carry-over (see Figure 3). Moreover, the stronger-than-expected US super stimulus should add +0.7pp to global trade growth in 2021.

Figure 4 – Input vs. output prices in the manufacturing sector (above 50 = expansion)

Figure 4 – Input vs. output prices in the manufacturing sector (above 50 = expansion)
Sources: Markit, Euler Hermes, Allianz Research