Is the Chinese ox reflating the world, one container at a time? 

11 February 2021 
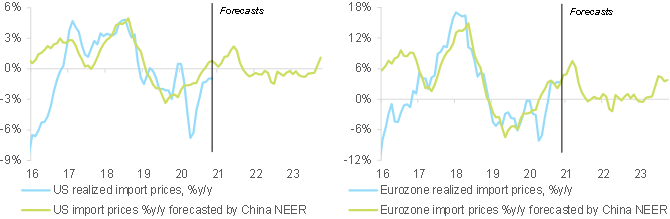
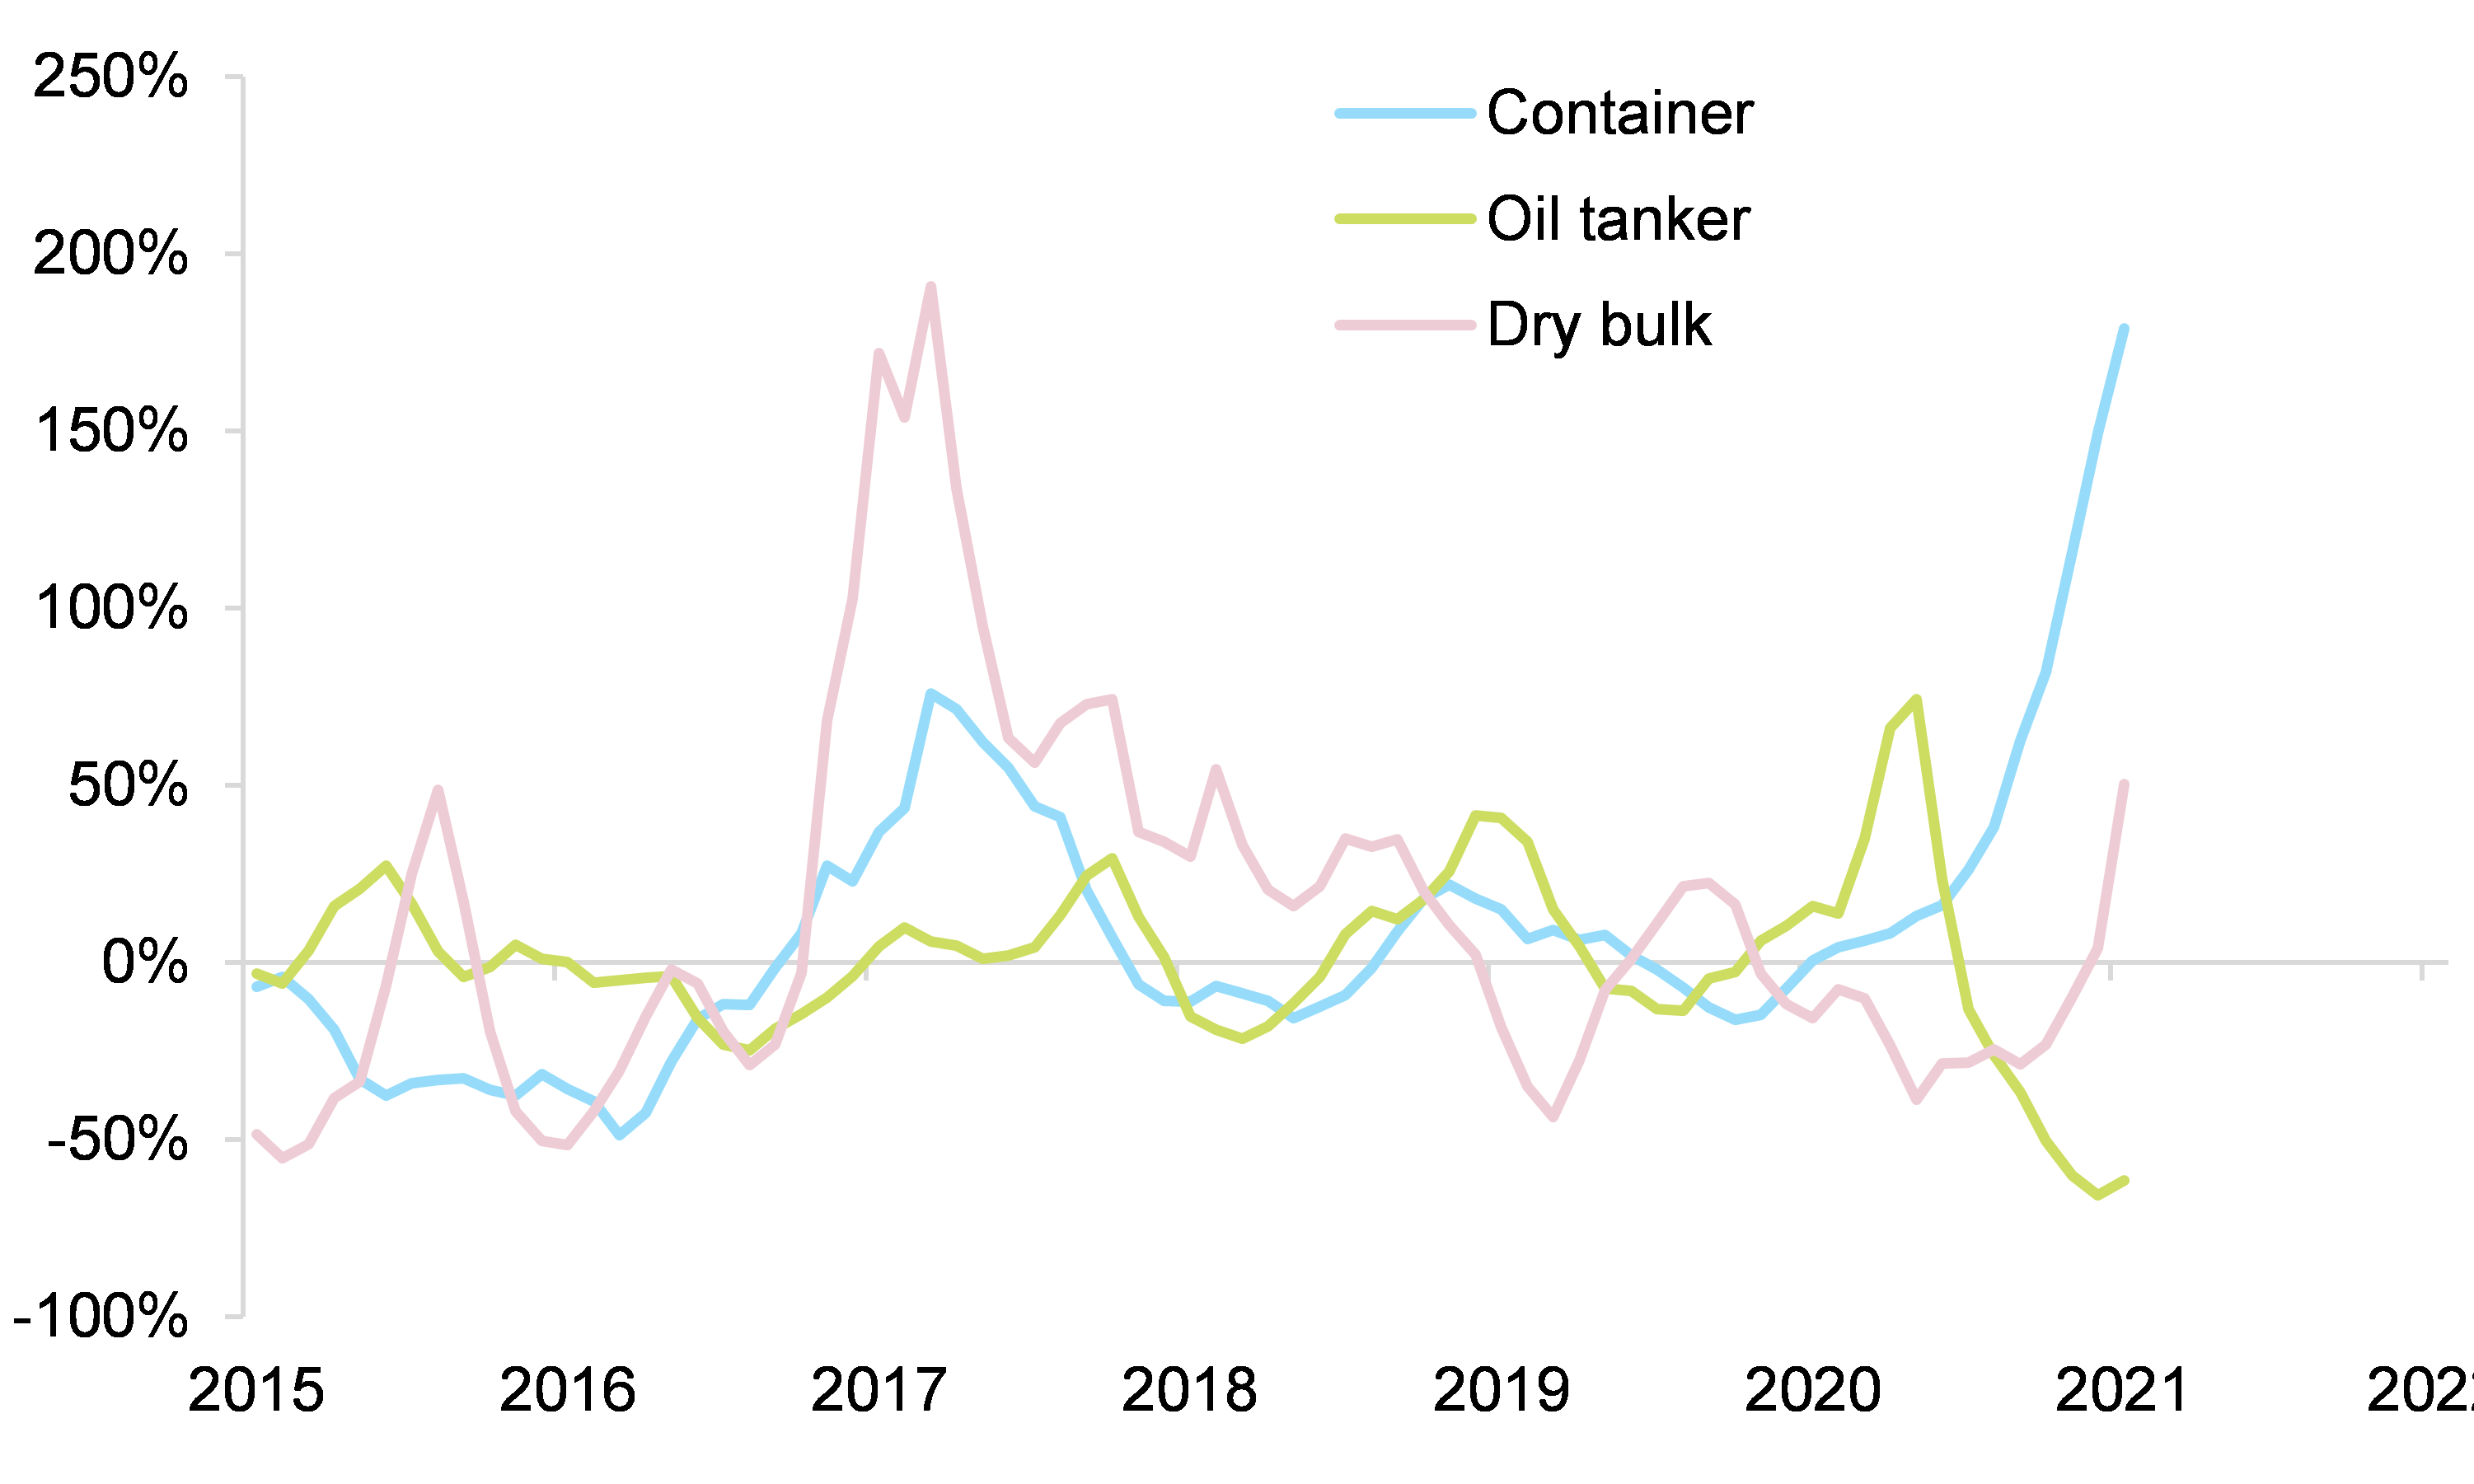
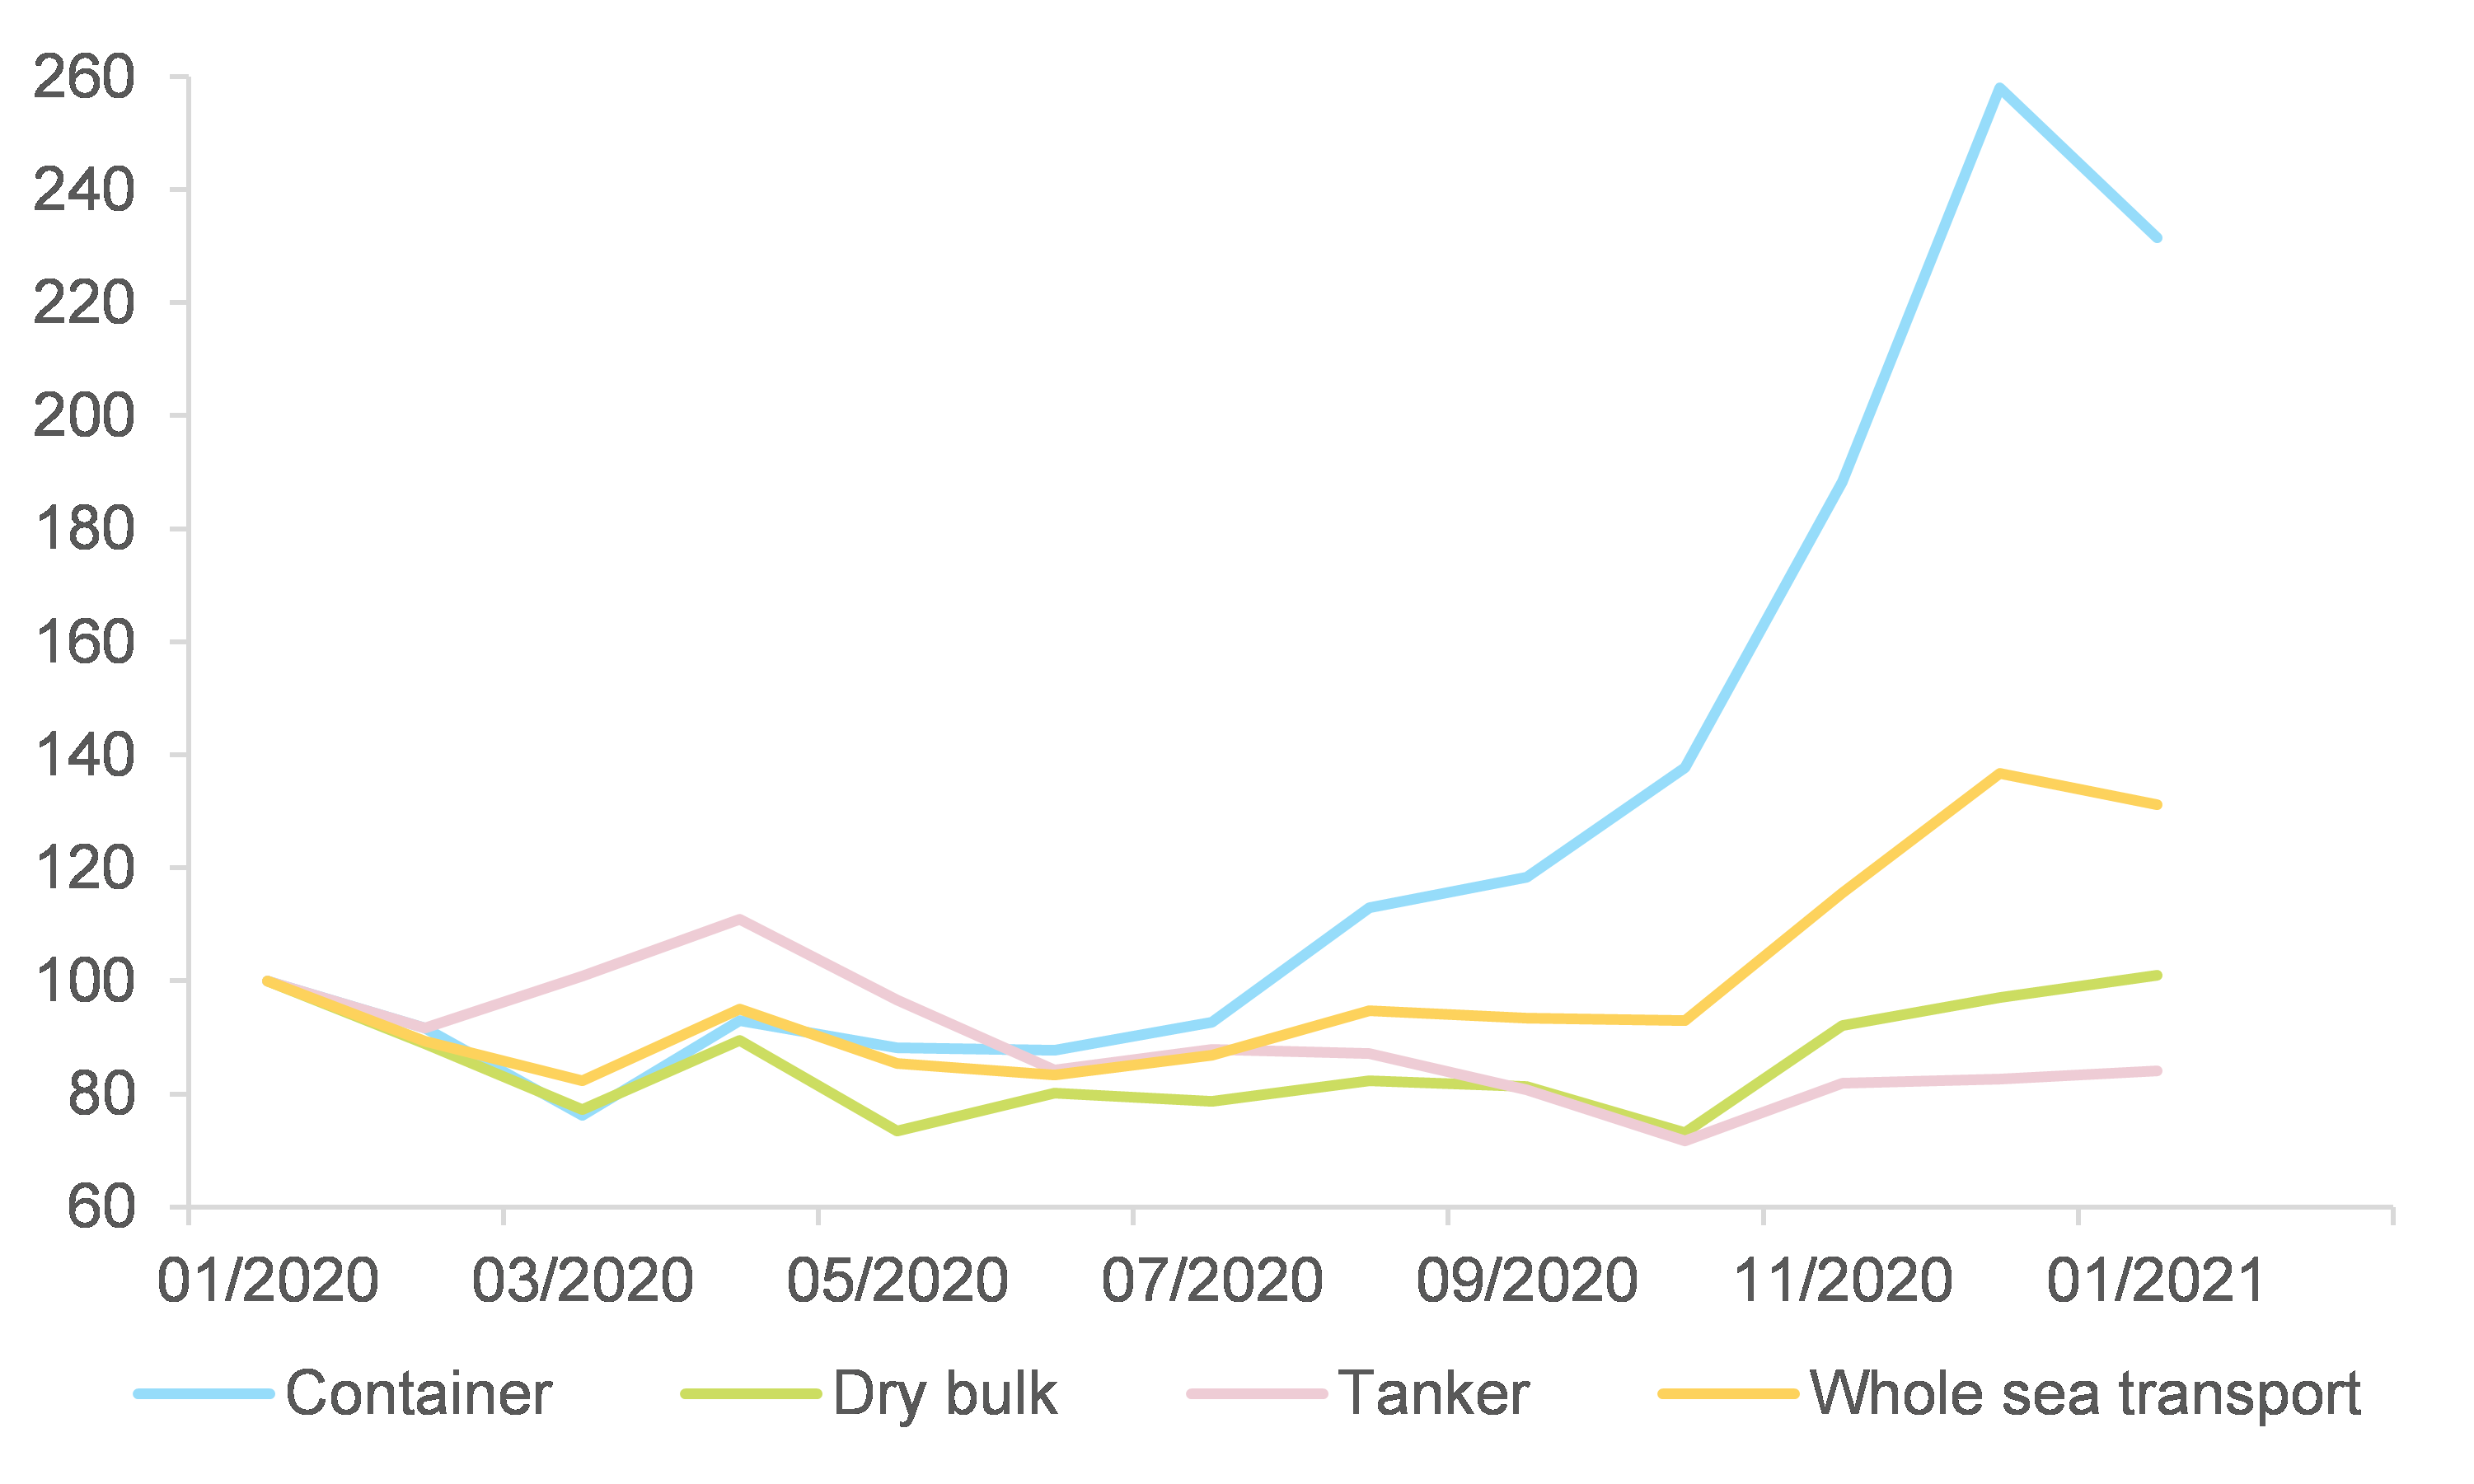
Amid surging demand for imports from China, a container shortage and a strengthening RMB are pushing up import prices for European firms: We expect a peak of +6% y/y by end-April 2021 from +3% in November 2020. For the US, the impact should be milder: +2% y/y by July from -1% in November (see Figure 1). The container shortages are the result of the differing timelines of Covid-19 lockdowns and an earlier production activity recovery in Asia. Combined with supply-chain disruptions and the oligopolistic nature of the maritime shipping sector, this has led to a sharp rise in freight rates (+150% q/q in Q4 2020, see Figure 2). This shortage is likely to continue until the summer: A survey  carried out in late 2020 found that more than 90% of container shipping enterprises in China believe it will last at least three months, with 25% of them expecting it to last for six months or longer. Part of the bottleneck can also be related to inventory management and mainly to a delay in European manufacturers rebuilding stocks following the Covid-19 shock.

Meanwhile, the strong performance of the RMB in 2020 is likely to extend into 2021 as a result of 1/ a faster recovery following the Covid-19 crisis, 2/ earlier policy normalization and 3/ measures to liberalize China’s capital account that attract foreign inflows: We expect USDCNY at 6.3 at year-end, vs. 6.5 at the end of 2020. The stronger RMB comes in a context where China’s export prices are also likely to increase: The latest data, for January, show a y/y increase in China’s producer prices for the first time in 12 months. We find that producer prices tend to lead export prices by five months in China.

Figure 1 – China NEER & import prices in the US and the Eurozone 
Figure 1 – China NEER & import prices in the US and the Eurozone
Sources: BIS, CPB, Allianz Research

Figure 2 – Freight rates by segment, change 3m/3m

Figure 2 – Freight rates by segment, change 3m/3m
Sources: IHS, Allianz Research
The rising freight rates are a boon for container shipping companies: The operating margin of the main 15 companies should rise to 10.3% in 2021 (after 8.9% in 2020 and 3.5% in 2019), before declining a little to c.8% in 2022. In line with the divergence in prices, the balance of power has turned to the advantage of container shipping companies at the expense of the two other main types of sea transport (see Figure 3). Container ships are finally bucking historic trend of underperforming the broader (transportation) market. While in the coming months regulatory oversight could step in, the container imbalance and shipping companies’ pricing power are such that we expect only a small adjustment in their operating margins in 2022 (as a comparison, the average over 2010-2015 was 5.5%).

Figure 3 – Global valuation of shipping companies, by type of goods transported (index 100 = January 2020)
Sources: Bloomberg, Allianz Research
For other sectors, the impact on margins is negative. Eurozone companies are by far the most impacted by the rise in input costs: We forecast a -4.5pp to -7.0pp hit on Eurozone margins in H1 2021, depending on corporates’ pricing power, compared to between -2.0pp and -4.0pp for US corporates. Input costs for both consumer and manufactured goods have increased rapidly over the past few months, with Europe being the most impacted (see Figures 4). This rise has not yet been translated into rising selling prices, given the weakness of domestic demand, and past episodes show that companies’ pricing power, notably in Europe, remains very limited. Hence, the immediate impact is a loss of their margins over the course of H1 2021. If companies manage to pass 20% of the increase in transportation costs (+15%, taking into account a 10% weight of transportation costs into the intermediate consumption) to their selling prices, the impact on Eurozone margins would stand at -4.5pp. The impact can increase to -6.0pp in the case of a 10% pass-through to the final price, and more than -7.0pp if there is no pass-through on the selling price. The highest pricing power lies in countries where household disposable income did not contract in 2020, thanks to state support measures: mainly Germany, the Netherlands, Belgium, Austria and to a lower extent France (see Figure 5). Expressed in amounts, this could mean a maximum loss of operating profit of close to EUR36bn for German non-financial corporates in H1 2021 and EUR23bn for French ones (see Figure 6). In the US, the impact is comparatively less significant as production is less dependent on foreign inputs and the dependence on exchange rate variations is milder, given a higher share of imported goods labelled in USD.

Figure 4 – Price pressures on margins in the consumer goods sector (left) and the manufacturing sector (right)
(positive = input prices increase more than output prices)
Figure 4 – Price pressures on margins in the consumer goods sector (left) and the manufacturing sector (right) (positive = input prices increase more than output prices)
Sources: Markit, Allianz Research
Figure 5 – Household disposable incomes vs corporates’ margins
Sources: Eurostat, Allianz Research
Figure 6 – Loss of operating profit by scenario of pass-through of increase
Sources: Eurostat, Allianz Research
The longer delivery times in the manufacturing sector and potential shortages of inputs (in sectors such as automotive, semiconductors) could lead to a drag of -1.2pp on 2021 Eurozone GDP growth and -0.7pp in the US. Since last summer, the transportation time of containers has been rising, with only 50% of vessels arriving on time at end-2020 compared with 78% in 2019. Suppliers’ delivery times deteriorated fast for US and European firms, while they were more resilient in Asia. We find that the supply-chain disruption cut Eurozone GDP growth by -2.5pp in 2020 and it could be a drag of an additional -1.2pp in 2021. In the US, the supply-chain disruption weighed on GDP growth by -0.3pp in 2020 and could cause an additional decline of -0.7pp in 2021. The impact is comparatively is lower in the US, given a smaller shock on supplier delivery times and also a lower vulnerability to (foreign) inputs – in part thanks to better inventory management.

Could short-term reflation morph into medium-term inflation?

China is set to have an increasingly significant impact on global trade in the coming years. The economy is a relative winner amid the Covid-19 crisis and is set to keep growing faster than developed economies. We estimate that the world economic center of gravity should be located around the confluence of China, India and Pakistan by 2030 (while it was still in the Atlantic Ocean in 2007 – see here for more details). Following the same methodology, we calculate the position of the world exports center of gravity (see Figure 7), based on 67 economies which accounted for 91% of global trade in 2019. We find that it has also been moving Eastwards in the past few years, with an accelerated movement in 2020 as China has been increasing its global export market share (see here for more details).

Figure 7 – World exports center of gravity
Blue dots are the years 2000 to 2019. Orange dots are the months of Jan to Sep 2020.
Figure 7 – World exports center of gravity
Sources: national sources, Allianz Research
In the coming years, global supply chains will be vulnerable to structural changes in the Chinese economy. They can be summarized by China’s dual circulation strategy. Its targets center around increasing domestic demand and lowering dependence on foreign inputs (“domestic circulation”), while maintaining export market shares and liberalizing capital flows as a complement (“international circulation”) – see here for more details.

More specifically, the domestic circulation could imply long-term changes at the global scale in sectors that are deemed important for China’s strategy, such as automotive, electronics, semiconductors etc. (see here for more details on the latter sector). China boosting domestic demand and adjusting domestic supply chains to cater to domestic needs could impact input costs and inflation in the rest of the world. In order to assess the vulnerabilities, we look into CPI weights and exposure to China (see Figure 8) in the US and Europe. We find that sectors important for China’s dual circulation strategy (communication, transport and health) constitute between 12% and 20% of CPI baskets in the US and major economies in Europe. The communication sector in particular is vulnerable to sectoral changes in China, with on average 10% of local domestic demand dependent on China.

Figure 8 – CPI weights and exposure to China, by sector
Sources: OECD, Allianz Research
A successful dual circulation strategy would also imply a stronger RMB in the long run, increasing import prices in local currencies for China’s trading partners. Indeed, continued global integration of China’s financial sector, a model that shifts away from low-cost exports and towards quality and domestic consumption, and FX reserves diversification away from the USD, are supportive for the Chinese currency. A stronger RMB, and the conditions to get there, imply that the PBOC will not need to accumulate FX reserves as it had done in the past (particularly in the decades leading to 2014). Furthermore, the central bank aims to slowly increase diversification in its foreign assets, therefore gradually reducing dependence on the USD (see Figure 9). This long-term trend is occurring in a context where we expect a large issuance of US Treasuries in the coming years as US public debt should reach 160% of GDP by 2030. The potential shortfall of demand for US Treasuries will need to be absorbed by other institutions in order to avoid an environment of higher US bond yields and a weaker USD.

Figure 9 – Breakdown of PBOC foreign assets (FX reserves and gold)
Sources: SAFE, Allianz Research