Executive Summary
 

  • Between 2009 and Q3 18 the US total debt has declined from a peak representing 350% of GDP in Q1 09 to 311.5% in Q3 18. While the US as a whole has been deleveraging, the business sector (corporate and non-corporate) has re-leveraged, standing at 72.6% of GDP or USD 15tn today. This represents a 2pp deviation to trend. Past recessions in the US have coincided with positive deviations ranging from 2-8pp of GDP.
  • According to our calculations, the true level of non financial corporate debt in the US may be 30% or USD 3.9tn higher than officially reported, primarily because of leveraged loans bought by non-banks. We estimate that the debt-to-EBITDA ratio would thus be close to 4.6 instead of 3.9. As a consequence, the BAA-Treasuries’ spread (to AAA) should be about 120bps higher than currently observed (~ 230bps today) if hidden debt were factored in.
  • The Trump Administration’s fiscal stimulus has boosted demand in the US over the past couple of years. According to our model, a correction of this excess demand, back to potential output growth, could trigger an increase of the corporate delinquency rate from 1% in Q3 18 to 2.32% (highest level since Q2 11). This adjustment could follow strong disagreement about fiscal policy as we enter 2019-20 budget discussions. Corporate spreads will thus continue to hover around 230-250bps as seen today, still underestimating hidden debt, but aware of looming risks in the corporate sector. In a stress scenario (likelihood to switch estimated at 35%), which could correspond to a series of defaults for instance, the delinquency rate would jump to 3% and credit spreads would very quickly increase by 70bps higher than today.
  • The bottom line is that be it from scoping (hidden debt) or for cyclical reasons, we believe that corporate spreads are underestimated today, and that unfortunate events (rapid downturn, market defaults) could end up pushing up spread by 70-190bps, by sheer realization by market actors of intrinsic risks in that segment.

Overall US deleveraging hides corporate re-leveraging


Long-lasting phases of expansion, as observed today in the US economy, are often accompanied with an accumulation of debt both public and private. The US debt cycle and the decomposition of this debt by economic actors (state, non financial corporates, financial corporates, and households) can provide relevant information on the possible amplitude and nature of the next crisis. Figure 1 shows that the deleveraging phase has been uninterrupted since 2009, counterintuitively to the common misconception of an excessive level of debt. This deleveraging has been mainly initiated by the financial and household sectors. Between 2009 and Q3 18 the total US debt declined from a peak representing 350% of GDP in Q1 09 to 311.5% in Q3 18. Over the same period, debt of the financial sector registered a decline from 124.5% of GDP to 78% of GDP. Households have reduced their level of debt from 97.7% of GDP in Q2 09 to 75% of GDP in Q3 18.

Figure 1: US debt (as % of GDP)

US debt (as % of GDP)

Sources: Euler Hermes, Allianz Research

However, this total deleveraging masks two things: first, the fact that the US government is now the largest issuer of debt; and secondly the re-leveraging of the corporate sector. As for the latter, Figure 2 shows vividly the rise in corporate debt measured as the whole business sector (corporate and non-corporate non-financial debt) or just as the corporate non-financial debt. The former stands at USD 15tn, i.e. 72.6% of GDP, and the latter at USD 13tn. Both are clearly on the rise. In addition, prior recessions in the US have been preceded by a significant surge in the deviation of corporate debt compared to its own trend (Figure 3): this proxy for excess leverage will be used later on for our modelling. Among the various debt series (expressed as % of GDP: households, financial sector, state, corporate), the corporate series is the most predictive of a downturn.

Figures 2&3: US corporate debt

US corporate debt (as % of GDP)
Sources: Euler Hermes, Allianz Research
US corporate debt (as % of GDP)

Sources: Euler Hermes, Allianz Research


What if US corporate debt were underestimated


Over the past two years, the IMF’s Global Financial Stability Reports and the BIS’s Quarterly Reviews voiced concerns about both the quality and the quantity of debt issued by the US non-financial corporate sector. More recently, investors became wary of US non-financial corporate debt as shown by investors’ surveys, widening credit spreads and outflows from corporate bond funds.

According to the Federal Reserve, the debt-to-EBITDA ratio of the US non-financial sector now stands at 3.9. But, ever since the Great Financial Crisis, the net interest-to-EBITDA ratio has remained significantly above (four percentage points or 60%) the level consistent with both market interest rates – approximated by the BAA yield in our model – and the officially reported debt level (see Figure 1). The market interest rate being directly observable, such an anomaly can be cleared up by assuming that the “true” debt level is higher than reported. The most plausible reason for this underestimation is to be found in the securitization of leveraged loans and their buying by non-banks, a market segment which has become larger than the junk bonds market. Statistical machinery generally fails to account for financial innovations. For the net interest-to-EBITDA ratio to be reconciled with both the BAA yield and the level of non-financial corporate debt, the latter has to be 30% higher than reported, that is to say USD 16.9tn. This means close to USD 3.9tn of hidden debt. Under this assumption, the debt-to-EBITDA ratio would be close to 4.6 instead of 3.9 (see Figure 4).

Figure 4: estimate of the net interest/EBITDA ratio based on BAA corporate bond yield and debt (%)

US BBB credit market

Sources: National Statistics, Euler Hermes, Allianz Research

Non-rated debt is essentially left out of scope. An investor limiting her risk-taking to investment grade bonds may admittedly decide to ignore what happens in lower-rated segments. Similarly, an investor in rated debt may arguably neglect to observe trends in non-rated debt. This silo approach entails the risk of underestimating the potential interdependence between the various segments of the credit market as well as the potential contagion from the weaker borrowers to the stronger ones. This question is also relevant to equity investing as share buybacks are to a large extent funded by the issuance of corporate debt. Improving the measure is paramount to assess the true vulnerability of the corporate debt segment.

As one would expect, indebtedness and the credit risk premium tend to move in the same direction: the higher the debt-to-EBITDA ratio, the higher the spread between the BAA yield and the US Treasuries yield; up to a constant, the credit risk premium is proportional to indebtedness. In other words, for a debt-to-EBITDA ratio close to 4.6, the BAA-Treasuries spread should currently be about 120 bps higher (Figure 5). Interestingly, after adjusting corporate debt to make it consistent with the net interest-to-EBITDA ratio, the model estimate fits the actual spread better than without adjustment. A debt-to-EBITDA ratio close to 5 is high by historical standards. In recent history, such a level was reached in 2001 and 2009, close to the business cycle troughs, i.e. after recessions had depressed EBITDA. Put differently, it is unusual for this ratio to be that high during an expansion. Private providers of equity indices and financial data confirm the observation that the debt-to-EBITDA ratio is at a level usually reached during recessions.

Figure 5: Leverage of US companies (%)

Leverage of US companies (%)

Sources: National Statistics, Euler Hermes, Allianz Research


US stimulus may have kept delinquencies and spreads artificially low


The debt vulnerability discussed above is all the more important since excessive borrowing may have been fuelled by artificially high demand. Indeed, from 2017 onwards, the large fiscal stimulus implemented by the Trump Administration (fifth largest in US history) pushed the US above potential output growth – which we estimate at 2.2%. The output gap currently stands at 5% (the highest since Q2 00), a transient situation during which corporates could have reacted to temporary high demand, by deciding to over-invest or -indebt themselves. As fiscal policy could experience a U-turn in the US, understanding the correction in the corporate sector is essential.

Today, the rate of corporate delinquencies – 30-day past dues of commercial and industrial loans – stands at 1% in Q3 18, which is rather low from a historical perspective. This creates some insensitivity of corporate spreads to excess debt in the corporate sector. Should the excess demand be corrected, we would observe a higher delinquency rate – and higher credit spreads for corporates. The question is by how much. To answer this question we estimated the percentage of non-performing loans among non-financial companies by regressing it against a constant, the output gap, the Fed Funds target rate and the deviation of corporate debt from its trend. According to our model, a correction of excess demand in the US economy, back to its potential output, could trigger an increase of the delinquency rate from 1% in Q3 18 to 2.32% (highest level since Q2 11).

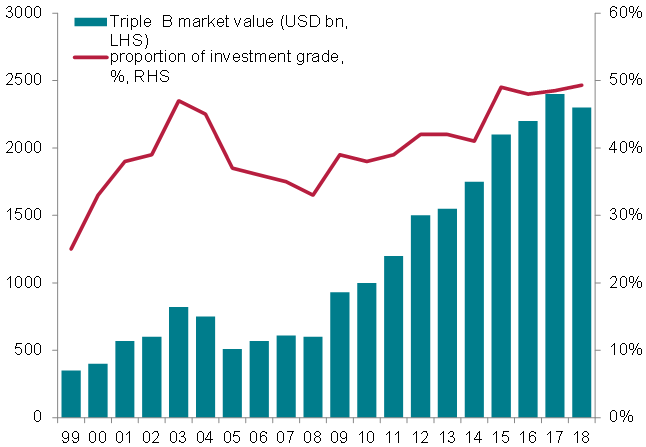
A soft landing of the US economy (our central scenario) could therefore trigger a regime switch for credit spreads, which seem rather low for the current risk level. Indeed, the average credit quality has deteriorated: the share of risky corporate bonds, rated BBB i.e. one notch above junk status, has markedly increased to reach 50% of the total investment grade credit market in Q3 18 (Figure 6).

Figure 6: US BBB credit market

US BBB credit market

Source: Allianz Research

To test this assumption, we used a markov-switching model, to determine how corporate spreads react differently to (a constant), Fed Funds Target rates (FFR), and excess leverage (the deviation of non-financial corporate debt as % of GDP, depending on the regime of low, average or high delinquency rates. Our estimation ran from Q3 97 until Q3 18. Our main results are that there are three clear cut (and stable) regimes: Regime 1 where spreads are anesthetized because of extremely low insolvency rates, a stable status often in recovery phase of the economic cycle; Regime 2 where spreads are awake as insolvency rates are perceived at a low level but decelerating growth is looming ahead; and Regime 3 where spreads widen rapidly as corporates are under stress and delinquencies soar.

In Regime 1, excess leverage is not significant in explaining corporate spreads and the FFR exerts a strong downward influence on US corporate spreads; the economy is perceived by the market as being strong enough to absorb tightening credit conditions. This coincides with an ascending trend for growth and could be valid for 2010-18. This regime coincides with delinquency rate around 1.5% (lower than today!) and BAA yields around 230bps.

In Regime 2 ( which we believe is the current state), the excess debt becomes moderately significant with an upward influence on US corporate debt spreads, while the FFR is still negatively significant albeit at a much lower level compared with regime 1. The market is less confident in the capacity of the US economy to absorb a tightening of credit conditions. The current level of spread at 255 bps (Moody's Seasoned Baa Corporate Bond Yield Relative to Yield on 10-Year Treasury Constant Maturity) corresponds to this estimate. The delinquency rate in that regime is 2%, in line with our previous estimation. The problem is that this regime is transient. The probability to switch to Regime 3 is 35% (when switching from regime 1 to 2 is 12%). Therefore, a default in the investment grade universe could start a series of downgrades from BBB to junk, exacerbated by many mutual funds recently invested in risky assets (Figure 7) incited to sell just for regulatory reasons, thereby triggering a severe selloff of the US credit market as a whole.

The corporate complacency argument is problematic because Regime 3 corresponds to rapidly widening spreads: a stress scenario. The excess debt is strongly and positively significant in explaining corporate debt spreads with an even lower negative impact of the FFR. It corresponds to episodes of stress (the Fed cuts rates but spreads widen, showing a sense of incapacity of the monetary policy to stabilize worsening market conditions. Under this scenario, the delinquency rate could be as high as 3.2%, and credit spreads could jump 70bps higher to 325bps.

Figure 7: Mutual funds ownership of risky bonds (USD bn)

Mutual funds ownership of risky bonds (USD bn)
Source: Allianz Research