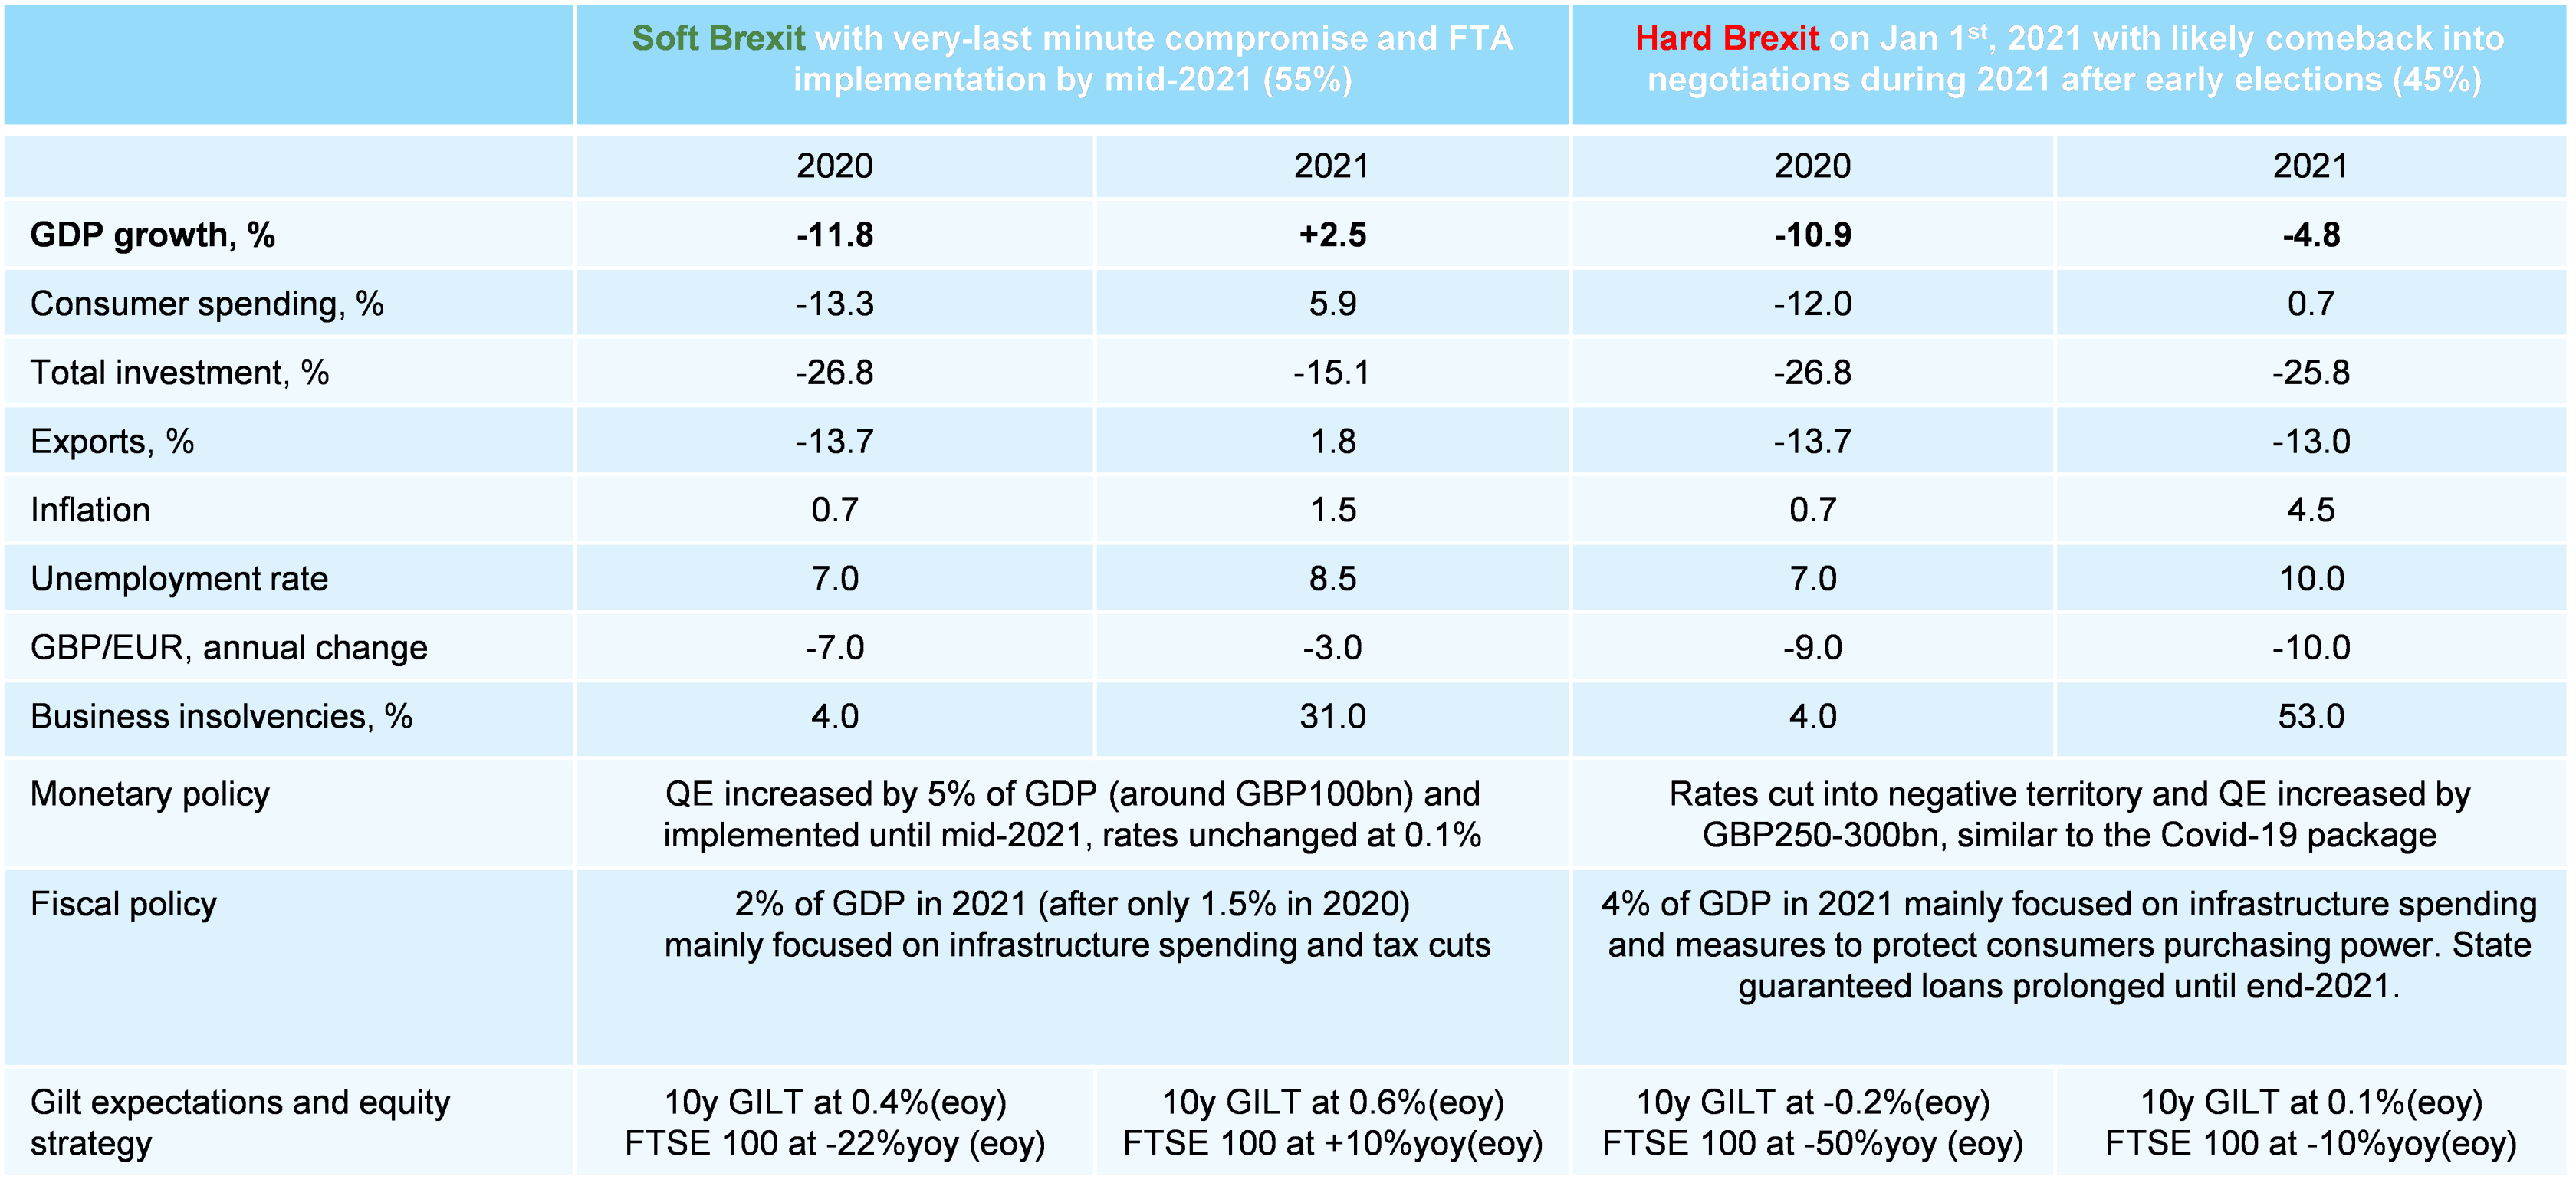
The odds for a no-deal Brexit at the end of 2020 have considerably increased to 45%.While we do still expect a last-minute compromise, given thes ocial, political and economic consequences of such an outcome on top of the continuing Covid-19 crisis in the UK and across Europe in general, a Hard Brexit could cost as much as EUR33bn in annual EU exports, with Germany (EUR8.2bn), the Netherlands (EUR4.8bn) and France (EUR3.6bn) hit the hardest. In the event of a no deal on 1 January 2021 (probably announced after mid-November to allow at least one month of preparation), the UK could see a -5% contraction in GDP and a -15% drop in exports, besides inflation beyond 5% for at least six months. This latter will mainly be driven by the strong rise in import prices (+15%) on the back of: (i) higher average import tariffs on total imports (+1pp to 2.6% ); (ii) a significant rise in non-tariff barriers (supply-chain disruption, administrative hurdles, increased transportation costs and time) — estimates suggest these could act as a +10% ad-valorem tariff on product value for imports coming from countries such as France, Germany or Spain, as they are part of the Customs Union and the Single Market, and around +5% on imports coming from Norway, a member of the Single Market but not the Customs Union. (iii) a forecasted -10% depreciation of the sterling (see Figure 1).
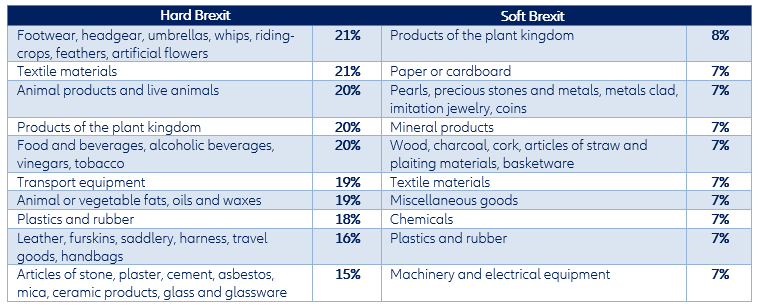
Import prices will rise the most for the following categories (i) footwear, headgear, umbrellas, whips, riding-crops, feathers, artificial flowers (+21%), (ii) textile materials (+21%), (iii) animal products and live animals (+20%), and (iv) food and beverages (+20%) – see Figure 2. Depending on the nature of imports, their sensitivity to changes in prices varies – in general, we expect a higher elasticity on second necessity goods such as high-tech products, machinery and equipment, automotive etc.
Taking into account the rise in import prices as well as the import sensitivity to prices (on average 0.4), we calculate that Germany could lose as much as EUR8.2bn of its exports to the UK in value (11.2% of its exports to the UK and 0.6% of its total exports). The Netherlands will see its exports decrease by EUR4.8bn (10.5% of its exports to the UK) and France by EUR3.6bn (11%) – see Figure 3 for the most exposed European countries and products.
We expect the authorities to step in in the case of a Hard Brexit. The BoE would significantly ease the stance of its monetary policy. Key interest rates are expected to go into negative territory and QE to be increased by GBP250-300bn, similar to the Covid-19 package, and at least double compared to our baseline scenario (see Figure 1). On the fiscal side we expect 4% of GDP in additional measures in 2021 (against 2% in the baseline scenario), with a focus on infrastructure spending, protection of consumers’ purchasing power (prolonged VAT rate cut and consumption vouchers) and liquidity measures for companies.
We expect a Free Trade Agreement (CETA++ type) with the EU to be agreed by mid-November. However, we don’t exclude the possibility that a longer transition period is agreed upon to allow enough time for a full ratification. Hence, we expect an FTA to be implemented only by mid-2021. It’s worth mentioning that if an agreement between the UK and the EU is not finalized by the end of October / mid-November, there won’t be enough time for a full ratification of the FTA before the end of the year. Hence, we don’t exclude the possibility of a technical extension of the transition period despite the commitment of both sides not to do so. The intensification of the sanitary crisis could also be a trigger for the extension of the transition period and the implementation of the FTA in a smooth way. In our baseline scenario, we expect the UK economy to continue to struggle throughout the sanitary crisis, with GDP contracting by -3% q/q in Q4 (-11.8% in 2020), and a weak and unstable recovery afterwards until 2022 when a vaccination campaign could allow a return to normal.
It is worth noting that, as of mid-October 2020, the UK is planning to enforce as many as 22 trade deals with non-EU countries or trade blocks as of 01 January 2021 in case no agreement with the EU is reached before the end of this year. In addition, 16 similar deals with other partners are still under negotiation. If the latter cannot be formally signed before late December, the UK will have to trade with such countries under WTO terms as of 01 January 2021. Finally, the UK secured mutual recognition agreements (or MRAs, that is, agreements in which countries recognize the results of one another’s conformity assessments) replicating EU arrangements, with the U.S., New Zealand and Australia. It also managed to sign an FTA with Japan, with whom an MRA is currently being contemplated.
Overall, we expect growth of +2.5% in 2021 (see Figure 1), as the effective EU exit under a FTA (a CETA++) is likely to materialize in 2021, either on 1 January 2021 or a later stage if both sides agree they need more time for ratification and implementation. In this Soft Brexit scenario, EU export losses would stand at EUR18bn. Meanwhile, in the UK, import prices are expected to rise by +6% on average due to a -3% depreciation of the sterling and the rise in non-tariff barriers detailed above. Hence, despite the overall fall in import tariffs (-0.7pp to 1%), under a Soft Brexit scenario, imports of products from the plant kingdom will experience a +8% price increase, followed by imports of paper and cardboard (+7%), pearls, precious stones and metals, metals clad, imitation jewelry, coins (+7%), mineral products (+7%) as well as wood, charcoal, cork, articles of straw and plaiting materials, and basketware (+7%) – see Figure 2. The rise in import prices will increase inflation beyond 2% in H2 2021 while reducing corporate margins.
Figure 1 – Brexit scenarios and related economic and financial impacts