So far this year, global trade has bounced back faster and stronger than expected, especially in value terms (+8.6% q/q in Q1 2021 vs. +3.4% q/q in volume terms), driven by price and capacity pressures. Despite peaking in 2021, these are likely to continue in 2022 as lower tariff rates won’t make up for a slow normalization and structural changes in trade flows. While global supply and demand explained most of the yearly contraction in trade in 2020, they account for only c.15% of the average y/y growth of global trade in value since the beginning of this year (see Figure 1). Instead, input restocking explains c.50% of the rise. More specifically, US and European companies are managing their inventories to respond to a strong rebound in local demand, which is dependent on inputs and goods manufactured and shipped out of Asia .

Figure 1 – Global trade in goods in value, %y/y growth
Sources: CPB, IHS, Bloomberg, Euler Hermes, Allianz Research
The global race for inputs is supporting trade volumes and, more importantly, pushing prices up. The race leads to the just-in-case model of inventories management being more widely adopted, which can lead to a form of micro speculation in which companies rush to acquire inputs, to protect against further price increases. Such a strategy adds further pressure to the ongoing global supply-demand imbalance, caused by renewed Covid-19 restrictions and power shortages in Asia-Pacific alongside accelerating demand from the grand reopening  in the US and Europe. The result is that trade volumes are sustained, and prices keep accelerating.

Shipping constraints explain another c.35% of the rise in trade flow value this year. Vessels are currently being used at almost full capacity and available containers remain scarce. After continuously rising in the second half of 2020, there are signs that maritime shipping delays are plateauing, but overall performance remains the worst it has been in ten years of records (the share of vessels not arriving on time has remained around 60-65% since the beginning of the year vs. 25% in July 2020 and c.20% on average in 2019). Importers are thus probably willing to pay more for their orders to be transported. Indeed, the traffic volume from Asia to North America is rising sharply, denoting strong demand, while freight rates increased earlier and faster for shipping from Asia to Europe (see Figure 2). North America is thus capturing available containers out of Asia, while Europe has been forced earlier on to pay higher prices to access shipping capacity.

Figure 2 – Container shipping volume and price indicators
Sources: Drewry, Bloomberg, Euler Hermes, Allianz Research
Against this backdrop, trade flows in value terms will continue to overshoot: We expect global trade to grow by +7.7% in volume terms in 2021 (vs. -8.0% in 2020) and by a much higher rate of +15.9% in value terms (vs. -9.9% in 2020), with even an upside risk to this forecast. Sequential growth could prove to be more bumpy, with Q2 in particular under pressure (in part due to temporarily softer activity in Asia), followed by a mild rebound in Q3. The large gap between the volume and value yearly numbers reflects the recovery but in particular price pressures caused by input and container shortages. Strong demand for shipping capacity coming from Asia is set to continue as US retailers currently face an exceptionally low level of inventories . The shipping industry is unlikely to normalize in the short-term (2021-2022), due to a number of reasons: 1/ the continued uneven recovery around the world, 2/ underinvestment over the past few years in the maritime shipping industry, 3/ new capacity only slowly becoming operational (probably not before 2023 as it takes one and a half years to build a new vessel) and 4/ few alternatives to ocean freight .

In 2022, price and capacity pressures are likely to stay on, even though they should have peaked in 2021. Lower tariff rates will not make up for structural changes that are likely to keep trade costs elevated. Reflecting only a slow normalization, we expect global trade growth to remain above-average in 2022, at +6.2% in volume terms and +8.4% in value terms. Global demand will continue to be sustained in 2022, thanks to the new infrastructure cycle , fiscal stimuli, residual savings (especially in advanced economies) and the relaxation of trade tariffs. Indeed, we estimate that the global tariff rate already declined by -0.6pp in 2021 compared to 2019, reversing nearly one third of the rise seen under the Trump administration and representing USD110bn of global export gains (see Appendix). It could continue to decline in 2022, notably thanks to the likely ratification of the Regional Comprehensive Economic Partnership (RCEP) in Asia-Pacific , with -0.1pp impact on the global tariff rate. However, at the same time, the number of protectionist measures accelerated in 2021 (see Figure 3) and continued tensions (especially between the US and China) could lead to further non-tariff barriers keeping trade costs elevated (see Appendix for our trade policy scenarios). Measures supporting the green transition, e.g. related to carbon border adjustments , could also work as non-tariff barriers and embody a new form of protectionism.

Figure 3 – Trade interventions and Global tariff rate
 Figure 3 – Trade interventions and Global tariff rate
Sources: Global Trade Alert, World Bank, Euler Hermes, Allianz Research
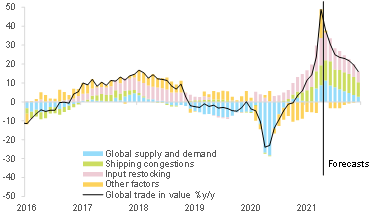
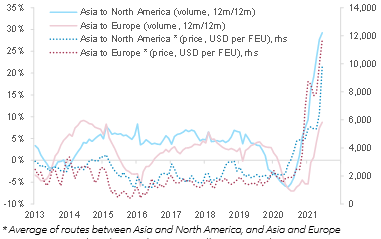
Structural changes in trade flows could also contribute to transportation costs staying higher than before the crisis. Notably, e-commerce seems to be capturing a larger share of global maritime container shipping capacity, c.30% in 2020-2021 compared with c.15% on average over 2016-2019, according to our estimates. Products ordered through e-commerce, more consumer-driven, typically have a higher tolerance for cost increases than industrial goods. Looking at the US more precisely, e-commerce and retail sales of goods typically imported from Asia have been standing at unusually high levels since the beginning of 2021 . The two-year correlation between non-store retail sales and Asia-to-North America maritime shipping volumes reached an average of 72% this year, higher than the 56% for in-store retail sales (vs. around 30% on average for both over 2016-2019).

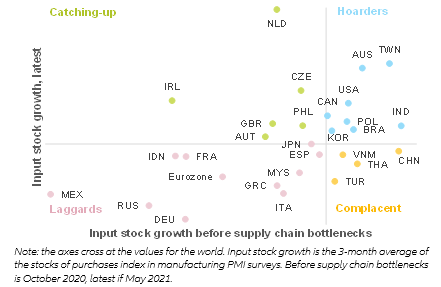
Which countries and sectors are most vulnerable? Europe (Germany in particular) is overall lagging in terms of input stock, while the US and some economies in Asia seem to be hoarding inputs. Indeed, input inventories in the US and several economies in Asia-Pacific (e.g. Taiwan, Australia, South Korea) were already at relatively high levels before the current supply chain bottlenecks emerged and are now still seeing a rising trend – see Figure 4. Asia is probably less impacted by input shortages, given high regional trade integration  and sectoral positioning that is prioritized by suppliers . In contrast, most countries in Europe are struggling to restock already low levels of inventories. The Netherlands and 
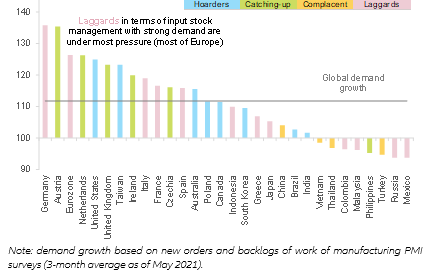
Ireland appear as exceptions, likely thanks to their trade platform status and specialization in the tech, chemicals and pharmaceutical sectors. The more pronounced shortage of inputs for the region overall is all the more worrying, given that demand is very dynamic (see Figure 5). Manufacturers thus have to pay higher prices to obtain inputs and/or are unable to fully match demand.

Figure 4 – Manufacturing sector input inventories management, by economy
Sources: IHS, Euler Hermes, Allianz Research
Figure 5 – Manufacturing sector demand growth, by economy (and respective input inventories management)
Sources: IHS, Euler Hermes, Allianz Research
The ongoing rise in prices will also negatively impact even further companies that went into the crisis with low levels of inventories. For example, the just-in-time model, which aims at minimizing the need to stockpile, was widely adopted in the automotive sector. We find indeed that the transportation sector, along with textiles & apparel and computer & electronics, are currently seeing declining inventories from already low pre-crisis levels (see Figure 6).

At the global level, beyond this year, manufacturers will have to deal with the peak of the demand cycle (around mid-2022) at a time when inventories will be above average following the ongoing race for inputs.

Figure 6 – Inventories indices, by sector
Sources: Bloomberg, Euler Hermes, Allianz Research