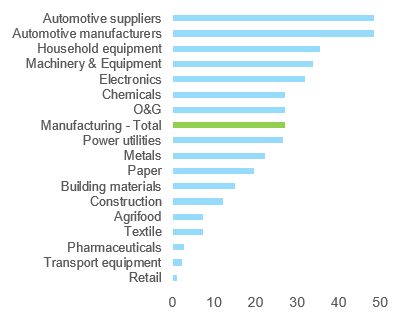
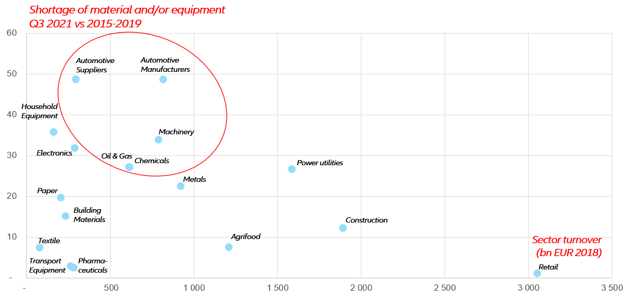
Companies in Europe and the US could face a profit squeeze from Q4 2021 onwards as sustained supply-chain disruptions slow the manufacturing recovery. We find that the automotive, machinery, oil and gas and chemicals sectors are the biggest cause for concern, and Germany in particular is at risk of a shortage-induced industrial recession. The European manufacturing sector has been facing significant headwinds over the past few months, which have weighed on production and contributed to a wider context of rising manufacturing costs. These include: 1) production outages due to prolonged input shortages and more recently the sharp rise in energy prices; 2) breakneck demand growth as European and North American countries reopened their economies earlier this spring and 3) transport bottlenecks on key trade lines, exacerbated by the resurgence of Covid-19 cases in Asia, notably in China. Looking at business surveys, we observe that 35% of respondents in the European manufacturing sector said tensions on equipment and inputs were limiting their Q3 2021 production, a 27pp jump from the 2015-2019 period. We also observe a very strong dispersion between sectors, with automotive, household equipment and machinery and equipment far more concerned than transport equipment, pharmaceuticals or textile manufacturing (Figure 1).
Figure 1 – Europe: shortages of material and/or equipment as a factor limiting production, % of respondents, Q3 2021 value vs 2015-2019 average (% of respondents)
Sources: Euler Hermes, Allianz Research, Eurostat. See appendix for definition of sectors
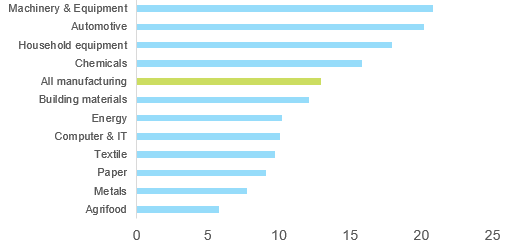
The situation on the other side of the Atlantic is similar, with the machinery and equipment, automotive, household equipment and chemical sectors reporting tensions far above the average of the entire manufacturing sector (Figure 2)
Figure 2 – US: reasons for plant production operating below full capacity, supply of materials and equipment limitations, Q2 2021 vs 2015-2019 average (% of respondents)
Sources: Euler Hermes, Allianz Research, US Census Bureau Quarterly Survey of Plant Capacity Utilization
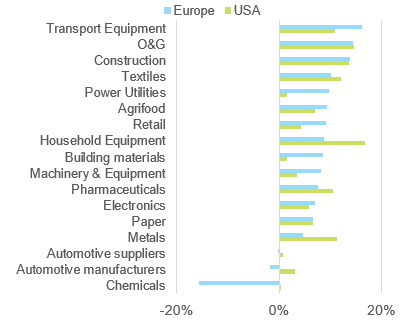
In Europe, financials data and estimates from a panel of about 1,100 large corporates suggest that 31% of companies should see their sales recede in the second half of 2021 vs the first half (against 25% of US companies), with a higher proportion among the automotive suppliers, chemicals and metals sectors. However, looking at the aggregate revenue of these corporates, we observe that while shortages are most certainly putting a significant cap on production capacity, they are not enough to reverse H2 turnover growth altogether, especially after a generally strong Q3. The exceptions are the automotive and chemicals sectors (Figure 3). Figures from a panel of about 1,000 large American corporates suggest headwinds might be slightly less severe, with 25% of companies reporting lower revenues in H2 2021 vs H1 2021. Much like in Europe, the chemicals and automotive sectors are, again, reporting below average growth.
Figure 3 – Estimated H2 2021 vs realized H1 2021 sales, % change
Sources: Euler Hermes, Allianz Research, Eikon consensus estimates
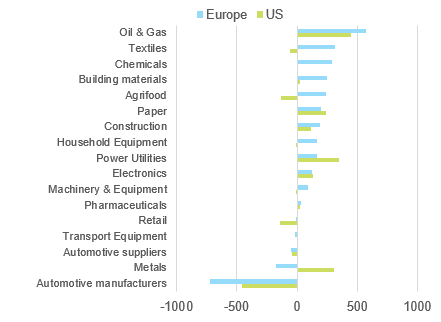
Turning to profitability, data suggest profits expressed as a percentage of turnover will start to suffer in Q4, with more than 50% of sectors in Europe posting a decrease in EBITDA margin of -2.5pp on average versus 70% of sectors in the US (-0.6pp on average). Overall in H2 2021, the most impacted sectors in terms of profitability are automotive, metals, transport equipment and retail. Conversely, higher sales driven by growing volumes and sometimes significant price increases will allow profit margins to improve further in the oil and gas, building materials and household equipment sectors (Figure 4).
Figure 4 – Change in EBITDA margins, H2 vs H1 2021, basis points
Sources: Euler Hermes, Allianz Research, Eikon consensus estimates
With supply-chain tensions set to last for at least a few more months, industrial production should remain subdued and weigh on the recovery of EU economic activity. To identify the sectors most likely to act as a drag, we plot sector input and equipment shortages against sector turnover in the region (Figure 5). Our results show that:
- Three of the region’s most important sectors in terms of activity, i.e. retail, construction and agrifood, report a comparatively modest increase in supply-chain tensions.
- A loose grouping comprising automotive, machinery, oil and gas and chemicals appears far more of a concern: not only do these sectors account for 30% of Europe’s manufacturing turnover (45% including the borderline metals and electronics sectors), but they also have strong linkages to other sectors, translating into elevated secondary round impact (e.g. electronic component shortages hurting automotive suppliers, in turn hurting automotive manufacturers).
Figure 5 – Shortages and sector turnover matrix (Europe)
Sources: Euler Hermes, Allianz Research
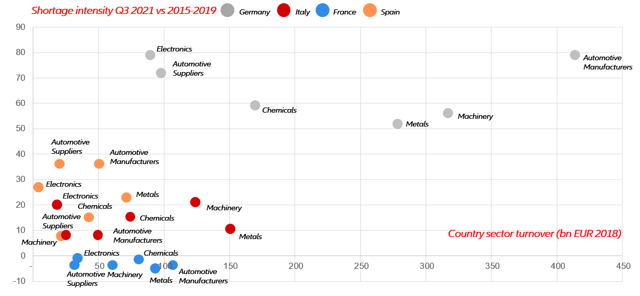
Looking at individual member countries, the data suggest that German companies are more at risk of a shortage-induced contraction in industrial activity than their Spanish, Italian and French competitors (Figure 6). While the magnitude of the gap between Germany and other countries could be accounted for by the massive floods of July 2021, this hierarchy is broadly consistent with the latest industrial production and PMI data.
Figure 6 – Shortages and sector turnover matrix, focus on key sectors
Sources: Euler Hermes, Allianz Research, Eurostat
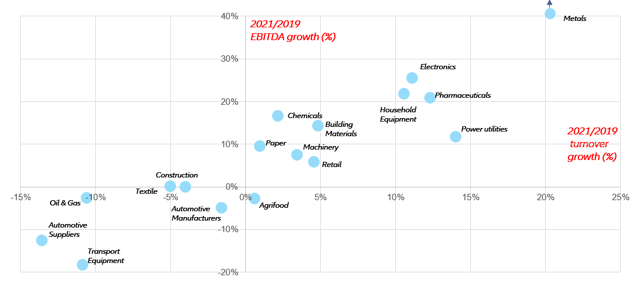
Looking at how sectors emerged from the 2019-2020 pandemic, we observe that supply-chain tensions are coming at a particularly bad moment for sectors whose activity and profitability have not entirely recovered yet. This is particularly the case for automotive manufacturers and automotive suppliers (Figure 7)
Figure 7 – Turnover and profit growth of listed European corporates by sector, weighted average, 2021 vs 2019, %
Sources: Euler Hermes, Allianz Research, Refinitiv Eikon consensus estimates. See appendix for definition of sectors
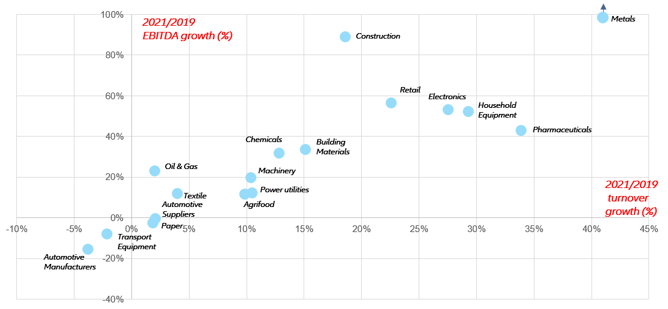
In the US, in contrast, shortages are impacting industrial corporates that have vastly outperformed their European peers on both profitability and sales growth since the beginning of the pandemic. The hierarchy of sectors is, however, very similar to the one we observe in Europe (Figure 8).
Figure 8 – Turnover and profit growth of listed US corporates by sector, weighted average, 2021 vs 2019, %
Sources: Euler Hermes, Allianz Research, Refinitiv Eikon consensus estimates. See appendix for definition of sectors
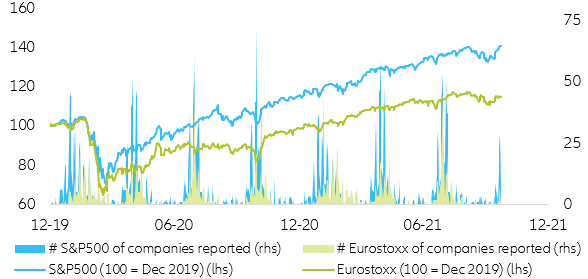
Market expectations confirm that an earnings slowdown is in the making. Markets have been volatile ahead of each earnings season since March 2020 due to high uncertainty over companies’ balance sheets. Nonetheless, and despite the combination of high valuations and an extremely uncertain environment, companies have managed to consistently beat market expectations, triggering an immediate market recovery and a continuation of the post-Covid-19 equity bull run after each reporting season (Figure 9).
Figure 9 – US & EUR equities vs earnings seasons
Sources: IBES, Refinitiv, Euler Hermes, Allianz Research
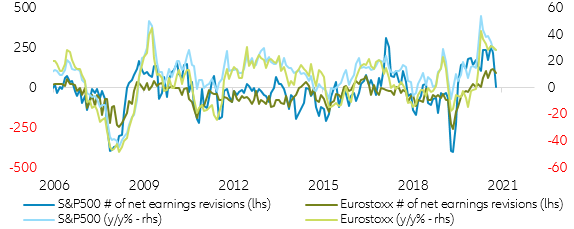
Despite risky asset investors being extremely pleased with such a thriving market environment, Q3 2021 is hinting towards a change in paradigm. As of today, market participants are consistenly revising down their companies’ earnings estimates, signalling that an earnings slowdown is in the making and that the highly uncertain environment will, most probably, damage the permanent earnings safety net that has been preventing equity markets from consolidating in the upcoming quarters (Figure 10). In this context, and still early in the reporting cycle (23% of US companies have reported with an 84% beat ratio), we expect earnings aggregates to come in close to flat in Q3, with clear early indications of (i) balance sheet deterioration, be it in terms of sales, earnings and/or margins moving forward, especially from Q4 2021, and (ii) differenciation across sectors, to the detriment of the sectors most affected and vulnerable to the current environnement such as consumer discretionary (12.5% of the equity market capitalization in the US and 17.8% in Europe) and industrials (respectively 8.2% and 17.4%) – noticing that the aggregate Eurozone equity market seems to be more vulnerable that the US due to its underlying sector allocation.
Figure 10 – Net earnings revisions and equity market performance
Sources: IBES, Refinitiv, Euler Hermes, Allianz Research; (net earnings revisions: earnings revised up – down)
Three factors could tighten the squeeze in 2022 and unfold in a context where policy support measures (tax deferrals, partial unemployment schemes and direct subsidies) will be entirely phased-out in most countries: semiconductor supply, energy prices and tensions in Chinese manufacturing and transport activities. The easing of supply-chain tensions will be instrumental in shaping turnover and profit growth in 2022. Looking at the most common factors hurting supply chains across sectors, we identify three critical areas for the easing of tensions:
- Tight semiconductor supply is hurting the automotive, machinery and equipment, household equipment and a fraction of the electronics (intermediate or final goods incorporating semiconductors) sectors. Data and anecdotal evidence from dominant automotive semiconductor companies and semiconductor foundries show that semiconductor supply is increasing at a fast pace, sometimes covering up to 130% of what companies believe is “real demand”, pointing to stockpiling or double-ordering behaviour that is preventing chips from reaching their final markets. Normalization of demand in the consumer electronics industry, combined with new capacities coming online, should alleviate tensions through 2022.
- Limited gas supplies are translating into higher electricity prices and rising input costs (metals, building materials), sometimes forcing industries to cut production (chemicals). The extent to which gas prices could rise further will be heavily dependent on the severity of the upcoming winter. We anticipate prices to peak in spring 2022 before receding in the second half of 2022.
- Tensions in Chinese manufacturing and transport activites are the last factor with a broad and adverse impact on a large number of sectors, given Europe’s reliance on Chinese intermediate and final goods. In recent weeks, tensions arose from local surges in Covid-19 cases and power outages. On the latter topic, Chinese authorities have taken steps to incentivize coal and power production. As regards the saturation of port infrastructure resulting from exceptionally high exports to North America and Europe, this too should ease with the normalization of demand from sectors boosted by the pandemic.
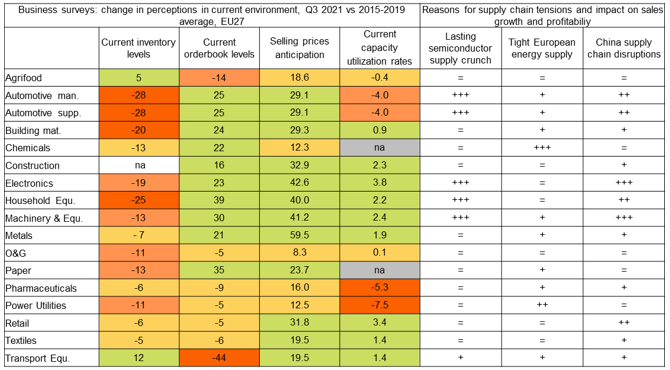
We expect Q2 2022 to be a turning point for supply-chain disruptions. In this scenario, the catch-up potential in sectors plagued by shortages could be significant, notably for those with higher pricing power (Figure 11 for selling price expectations and our report on current pricing power as measured by growth in retail prices versus input prices). Taking the automotive sector as an example, we observe in surveys that inventory levels are particularly low and capacity utilization rates depressed, but orderbooks i.e. potential volumes are high, selling price anticipations are positive and pricing power has been visible for a couple of months (Figure 11).
Figure 11 - Business sentiment survey and sources of supply-chain tensions
Sources: Euler Hermes, Allianz Research, Eurostat.
How to read: = neutral impact + limited impact ++ average impact +++ strong impact
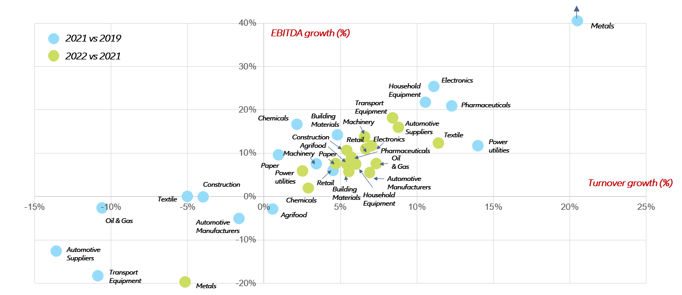
Across sectors, this would translate into a +5-10% increase in turnover and profits over the whole year, reflecting two opposite trends (Figure 15):
- Sectors which outperformed during the Covid-19 crisis, including metals, pharmauceuticals, electronics and household equipment, will post softer growth after two excellent years.
- Sectors which underperformed, including the wider automotive sector and transport equipment, will bounce back from their 2020-2021 lows as supply-chain tensions ease and demand for air transport picks up gradually, respectively.
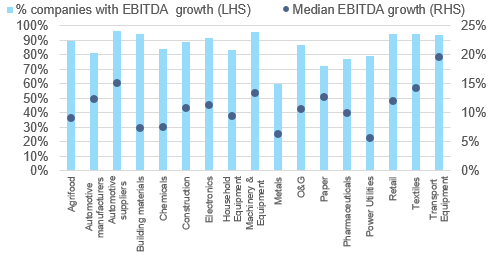
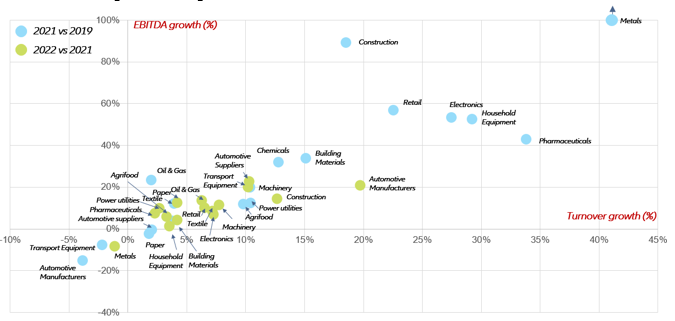
Figure 12 – Turnover and profit growth of listed European corporates by sector, weighted average, 2021 vs 2019 and 2022 vs 2021, %
Sources: Euler Hermes, Allianz Research, Refinitiv Eikon consensus estimates
All but one sector would post profit growth as rising variable costs (energy, commodities) would be more than offset by higher capacity utilization and a distribution of fixed costs on greater volumes. Profit growth would, however, remain uneven (Figure 13 and see Appendix for more details by sector).
Figure 13 – Profit growth distibution among European corporates (2022)
Sources: Euler Hermes, Allianz Research, Refinitiv Eikon consensus estimates
In the US, we observe a very similar pattern by which most sectors will see sales and profits normalize and grow by 0-10%. A major difference from Europe is the construction sector which, after reporting an excellent 2021, will continue to post positive performance in 2022 again. However, much like in Europe, the automotive, transport equipment and metals sectors are the main outliers (Figure 14)
Figure 14 – Turnover and profit growth of listed American corporates by sector, weighted average, 2021 vs 2019 and 2022 vs 2021, %
Sources: Euler Hermes, Allianz Research, Refinitiv Eikon consensus estimates
Looking again at equity markets, we see that the earnings expectations deterioration is also perceived to affect 2022 and part of 2023, though long-term growth expectations (beyond three+ years) seem to be maintaining some resilience. Indeed, market participants still expect +20% long-term earnings growth in the long-run, suggesting that the market is conviced that current headwinds affecting industries across the equity spectrum is temporary and that earnings should come back to interesting growth levels once those pressures fade away (Figure 15 & 16).
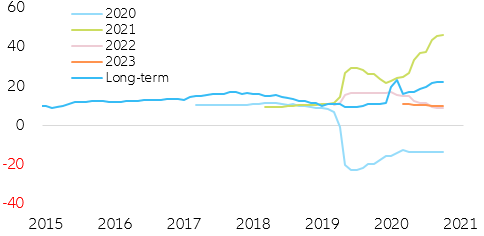
Figure 15 – US EPS growth expectations by year (in y/y%)
Sources: IBES, Refinitiv, Euler Hermes, Allianz Research
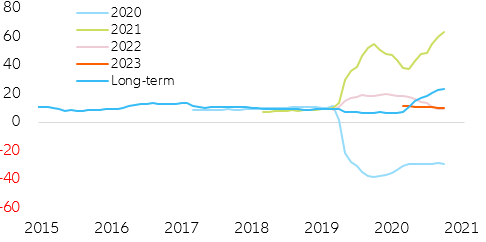
Figure 16 – Eurozone EPS growth expectations by year (in y/y%)
Sources: IBES, Refinitiv, Euler Hermes, Allianz Research
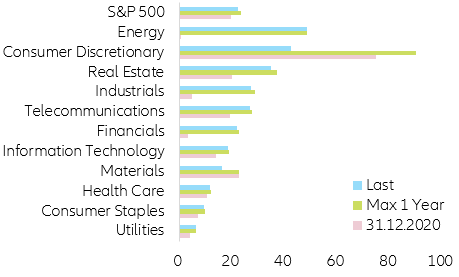
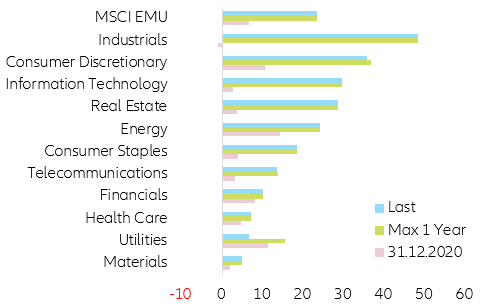
Following this premise, we expect a mild readjustment of long-term earnings expectations to historical averages ~10 to 15% yearly, which should go in line with our predicted equity market consolidation and return to historical average equity returns of ~6 to 7% yearly returns. In terms of sector divergence, when it comes to long-term EPS growth expectations a similar pattern can be found in the US and the Eurozone, with energy and consumer discretionary staying on the bright side while utilities and materials are expected to struggle moving forward (Figure 17 & 18).
Figure 17 – US long-term EPS growth estimates (in y/y%)
Sources: IBES, Refinitiv, Allianz Research
Figure 18 – Eurozone long-term EPS growth estimates (in y/y%)
Sources: IBES, Refinitiv, Allianz Research
Authors

Sector Advisor

Senior Investment Expert