China's economic slowdownCauses and consequences, at home and abroad

China’s great crunch: causes and consequences, at home and abroad

15 October 2021
EXECUTIVE SUMMARY

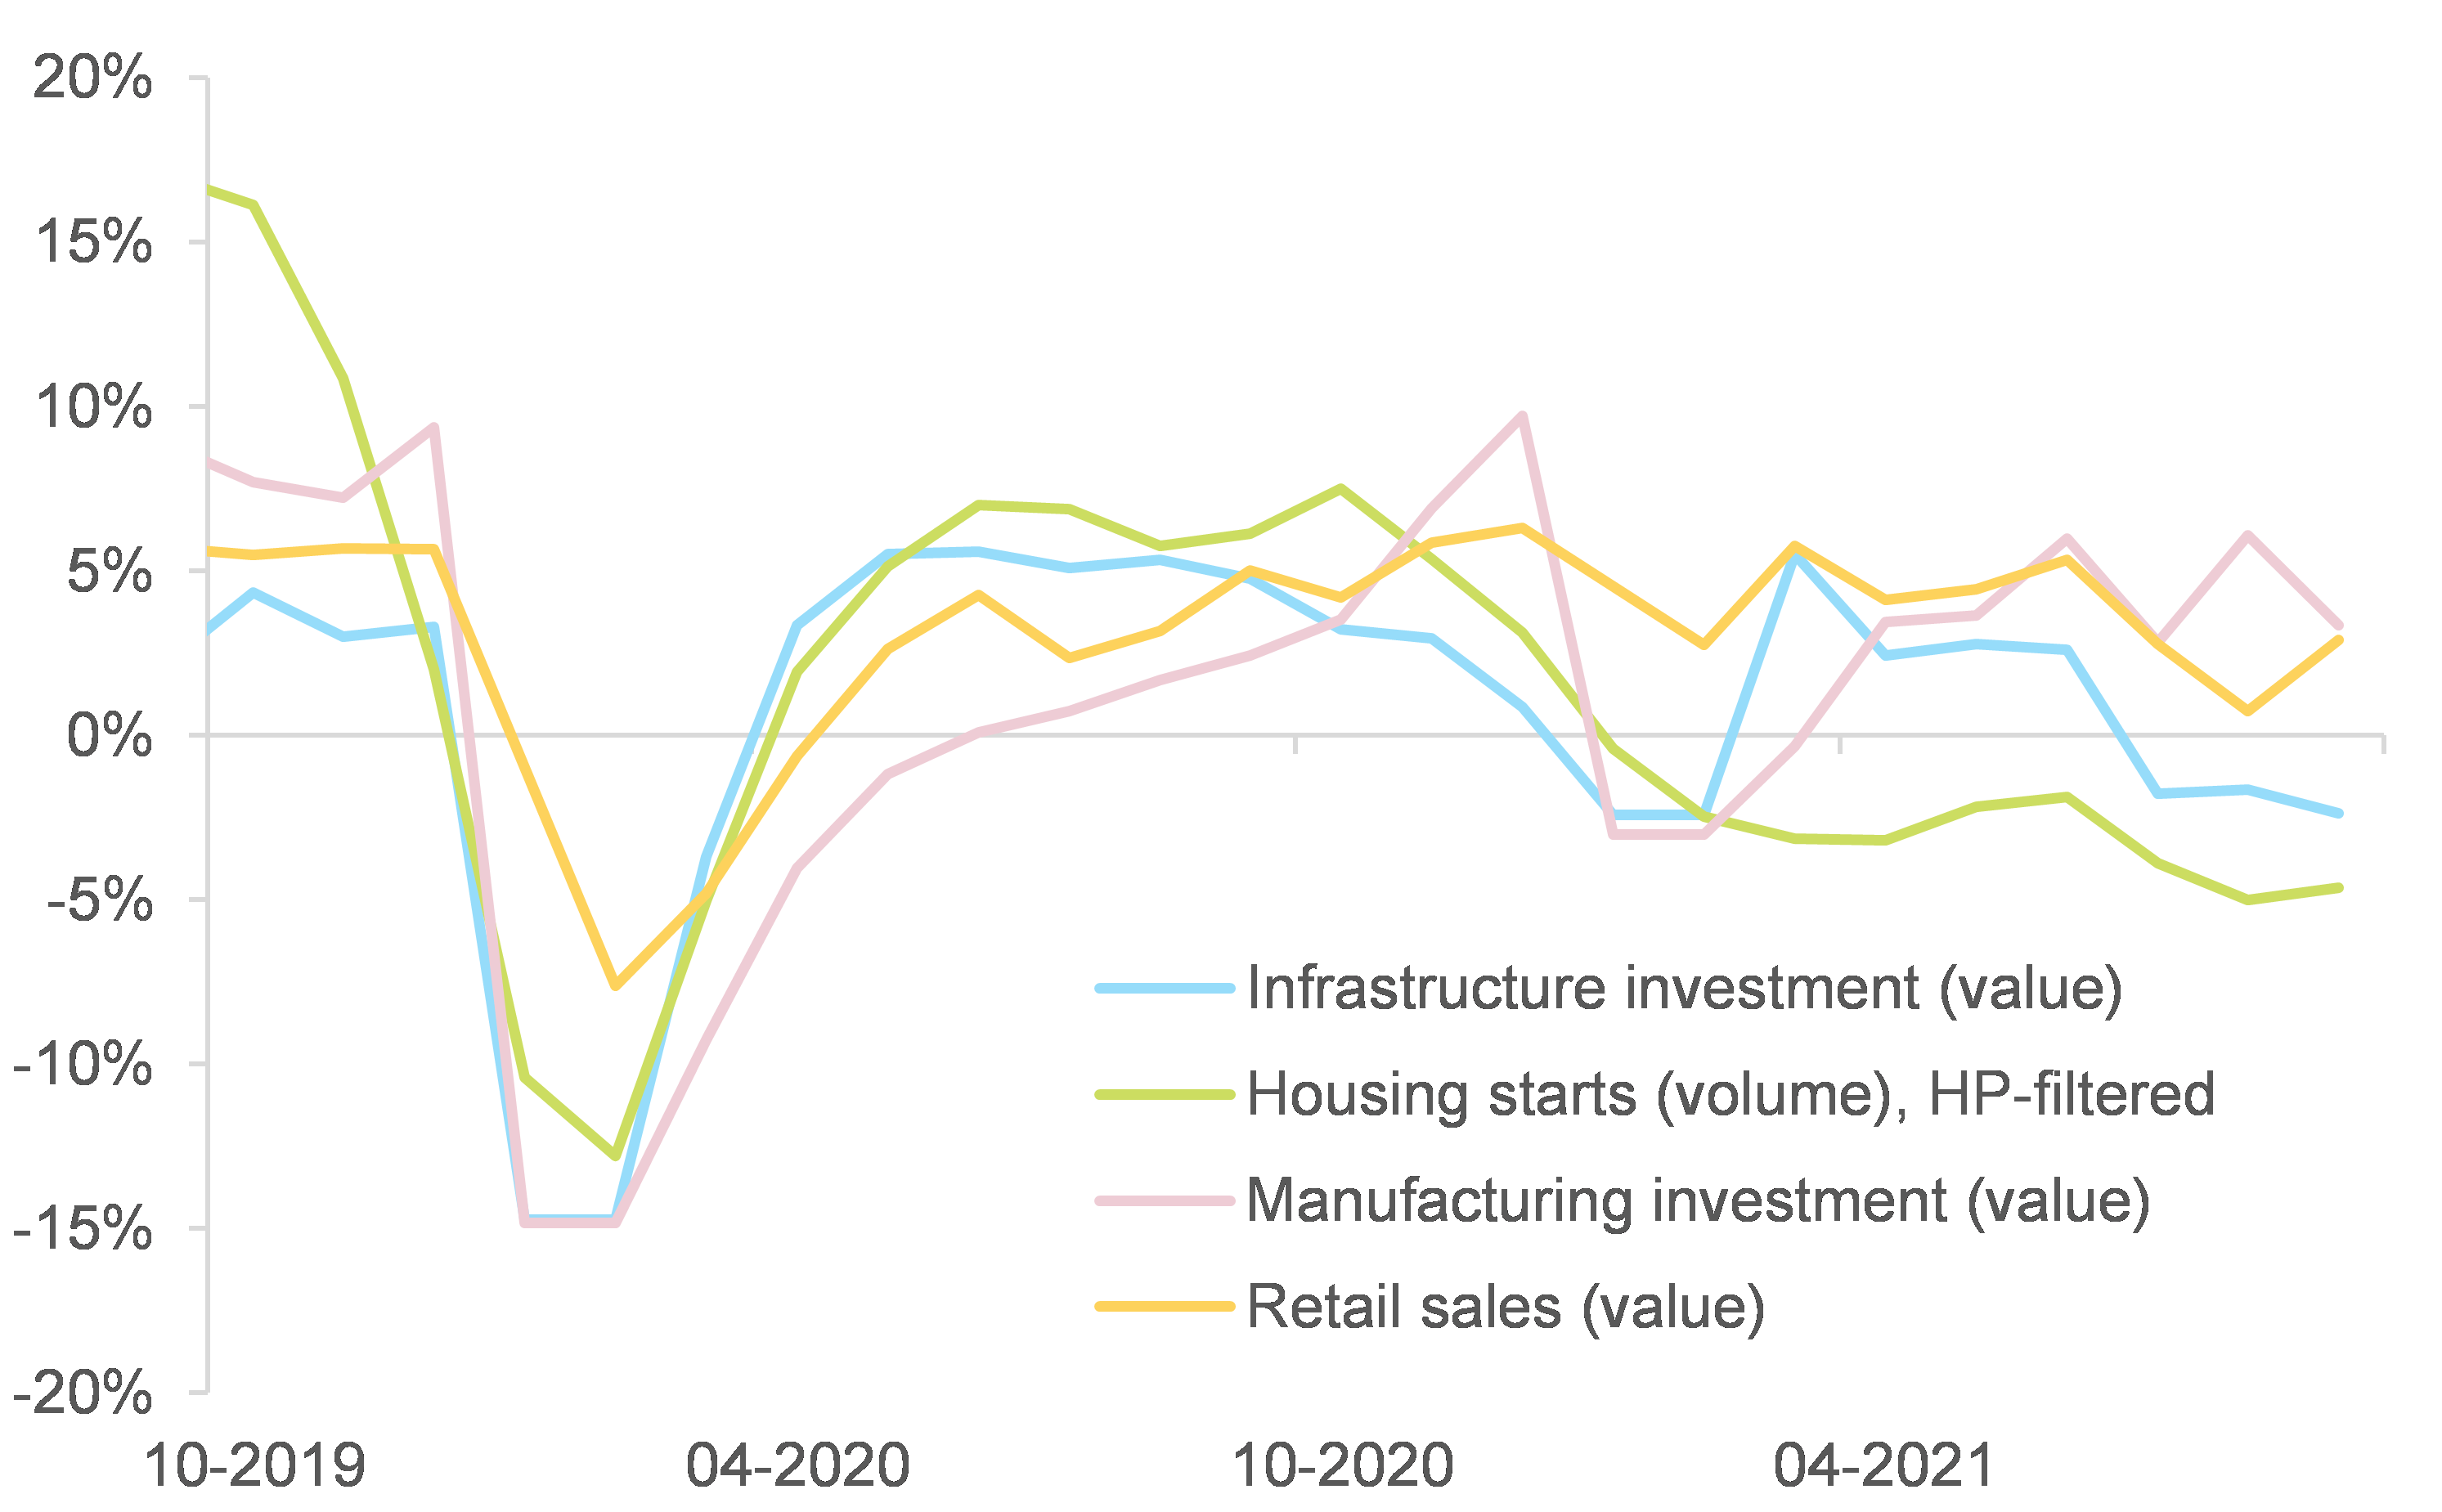
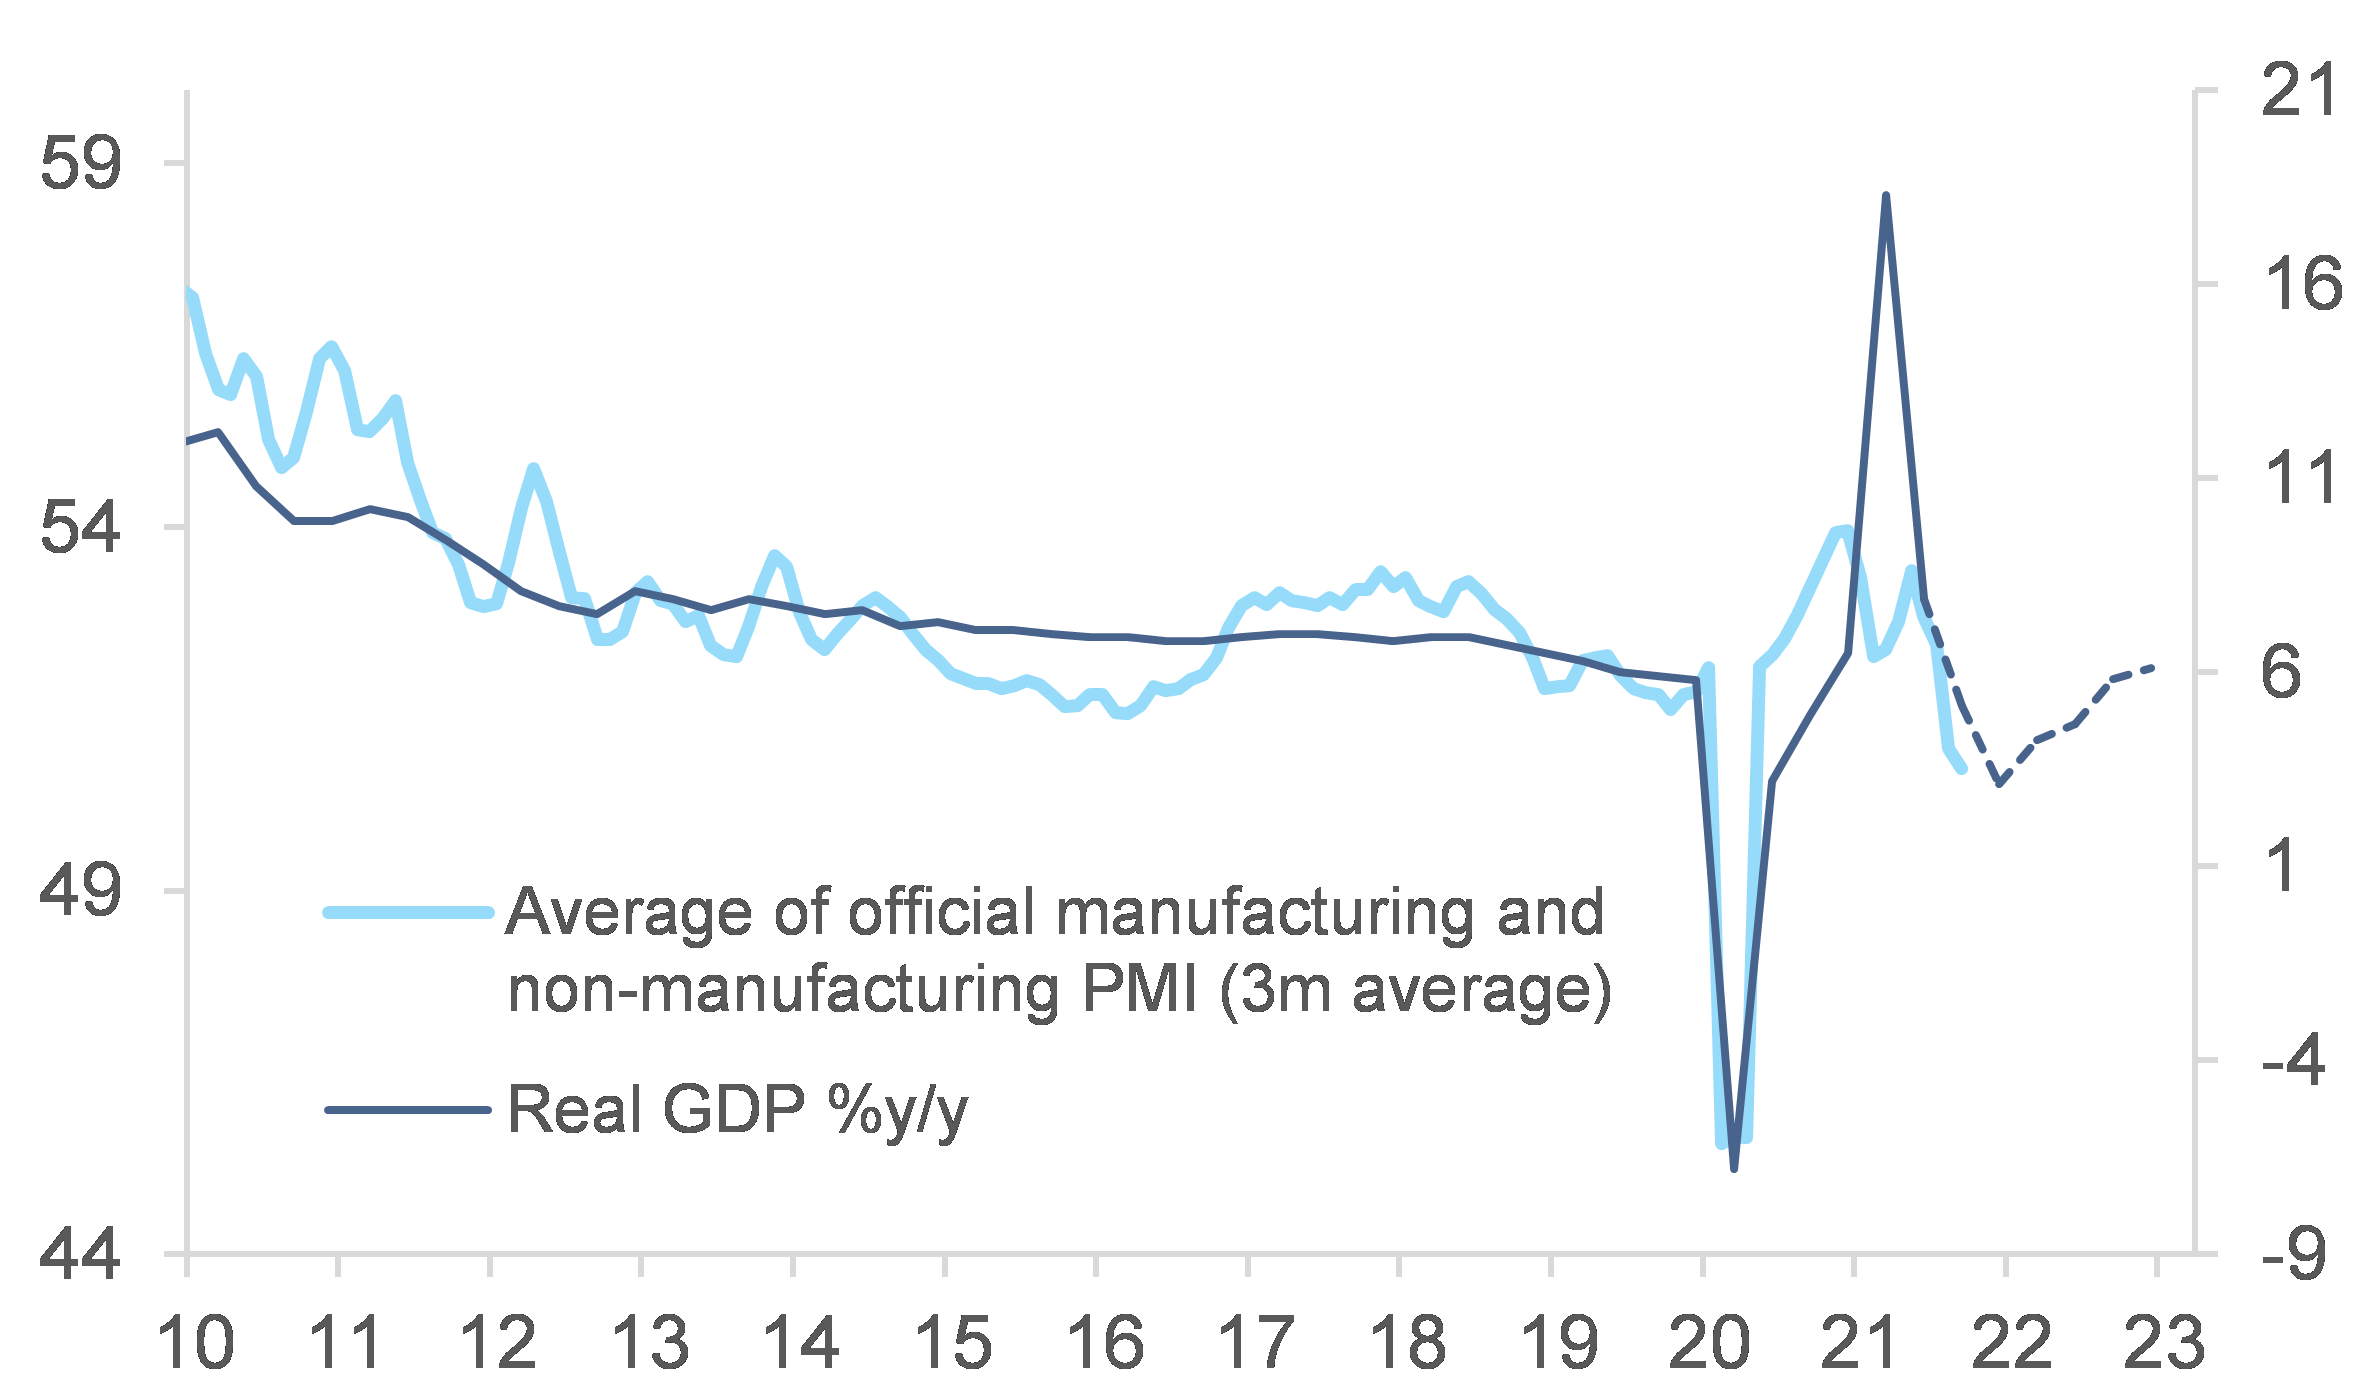
A mix of temporary and policy-driven crunches, the biggest being real estate, has sparked a sudden slowdown in China, which we expect to continue through Q4 2021 and the beginning of next year. As a result, we cut our GDP growth forecasts to +7.9% in 2021 and +5.2% in 2022, from +8.2% and +5.4%, respectively. This compares with consensus expectations at 8.1% in 2021 and 5.3% in 2022 as of October. Policy tightening and delta outbreaks have crunched cyclical activity but we do expect these factors to fade away. A recovery of services is likely going forward, although a return to normal will be hindered by the zero-Covid strategy likely to last well into 2022. In addition, “common prosperity” and increased regulatory scrutiny should keep industrial activity and the real estate sector under pressure. We expect at most a pause and/or softening of authorities’ communication in the regulatory crackdown against the real estate sector. This means that housing activity will remain weak and further defaults among real estate developers can be expected – even though policymakers have the means and intention to avoid a systemic crisis. Other areas of increased regulatory scrutiny include energy and local government finances, but they could be eased to mitigate the impact on short-term growth.

What could go wrong? The risk of policy mistakes has increased. We think risks remain tilted to the downside and much relies on policy coordination and reactivity to help the economy navigate the multiple crunches that are occurring at the same time. The main domestic risk comes from the real estate sector deteriorating further in a long-lasting way, with spillover impact on other sectors of the economy. Indeed, accounting for downstream and upstream sectors, final demand generated by real estate accounts for c.25% of China’s GDP and housing represents 78% of household assets, 40% of bank loans are backed by properties and land sales amount to roughly one-third of local governments’ gross revenues. The main external risk is geopolitical as renewed tensions emerged in the Taiwan Strait and with the US. The likelihood of an actual conflict remains extremely low and we continue to expect a status quo in US-China trade tariffs, although non-tariff barriers could increase. In the long run, the situation denotes the US’s intention to further deploy its containment strategy against China.

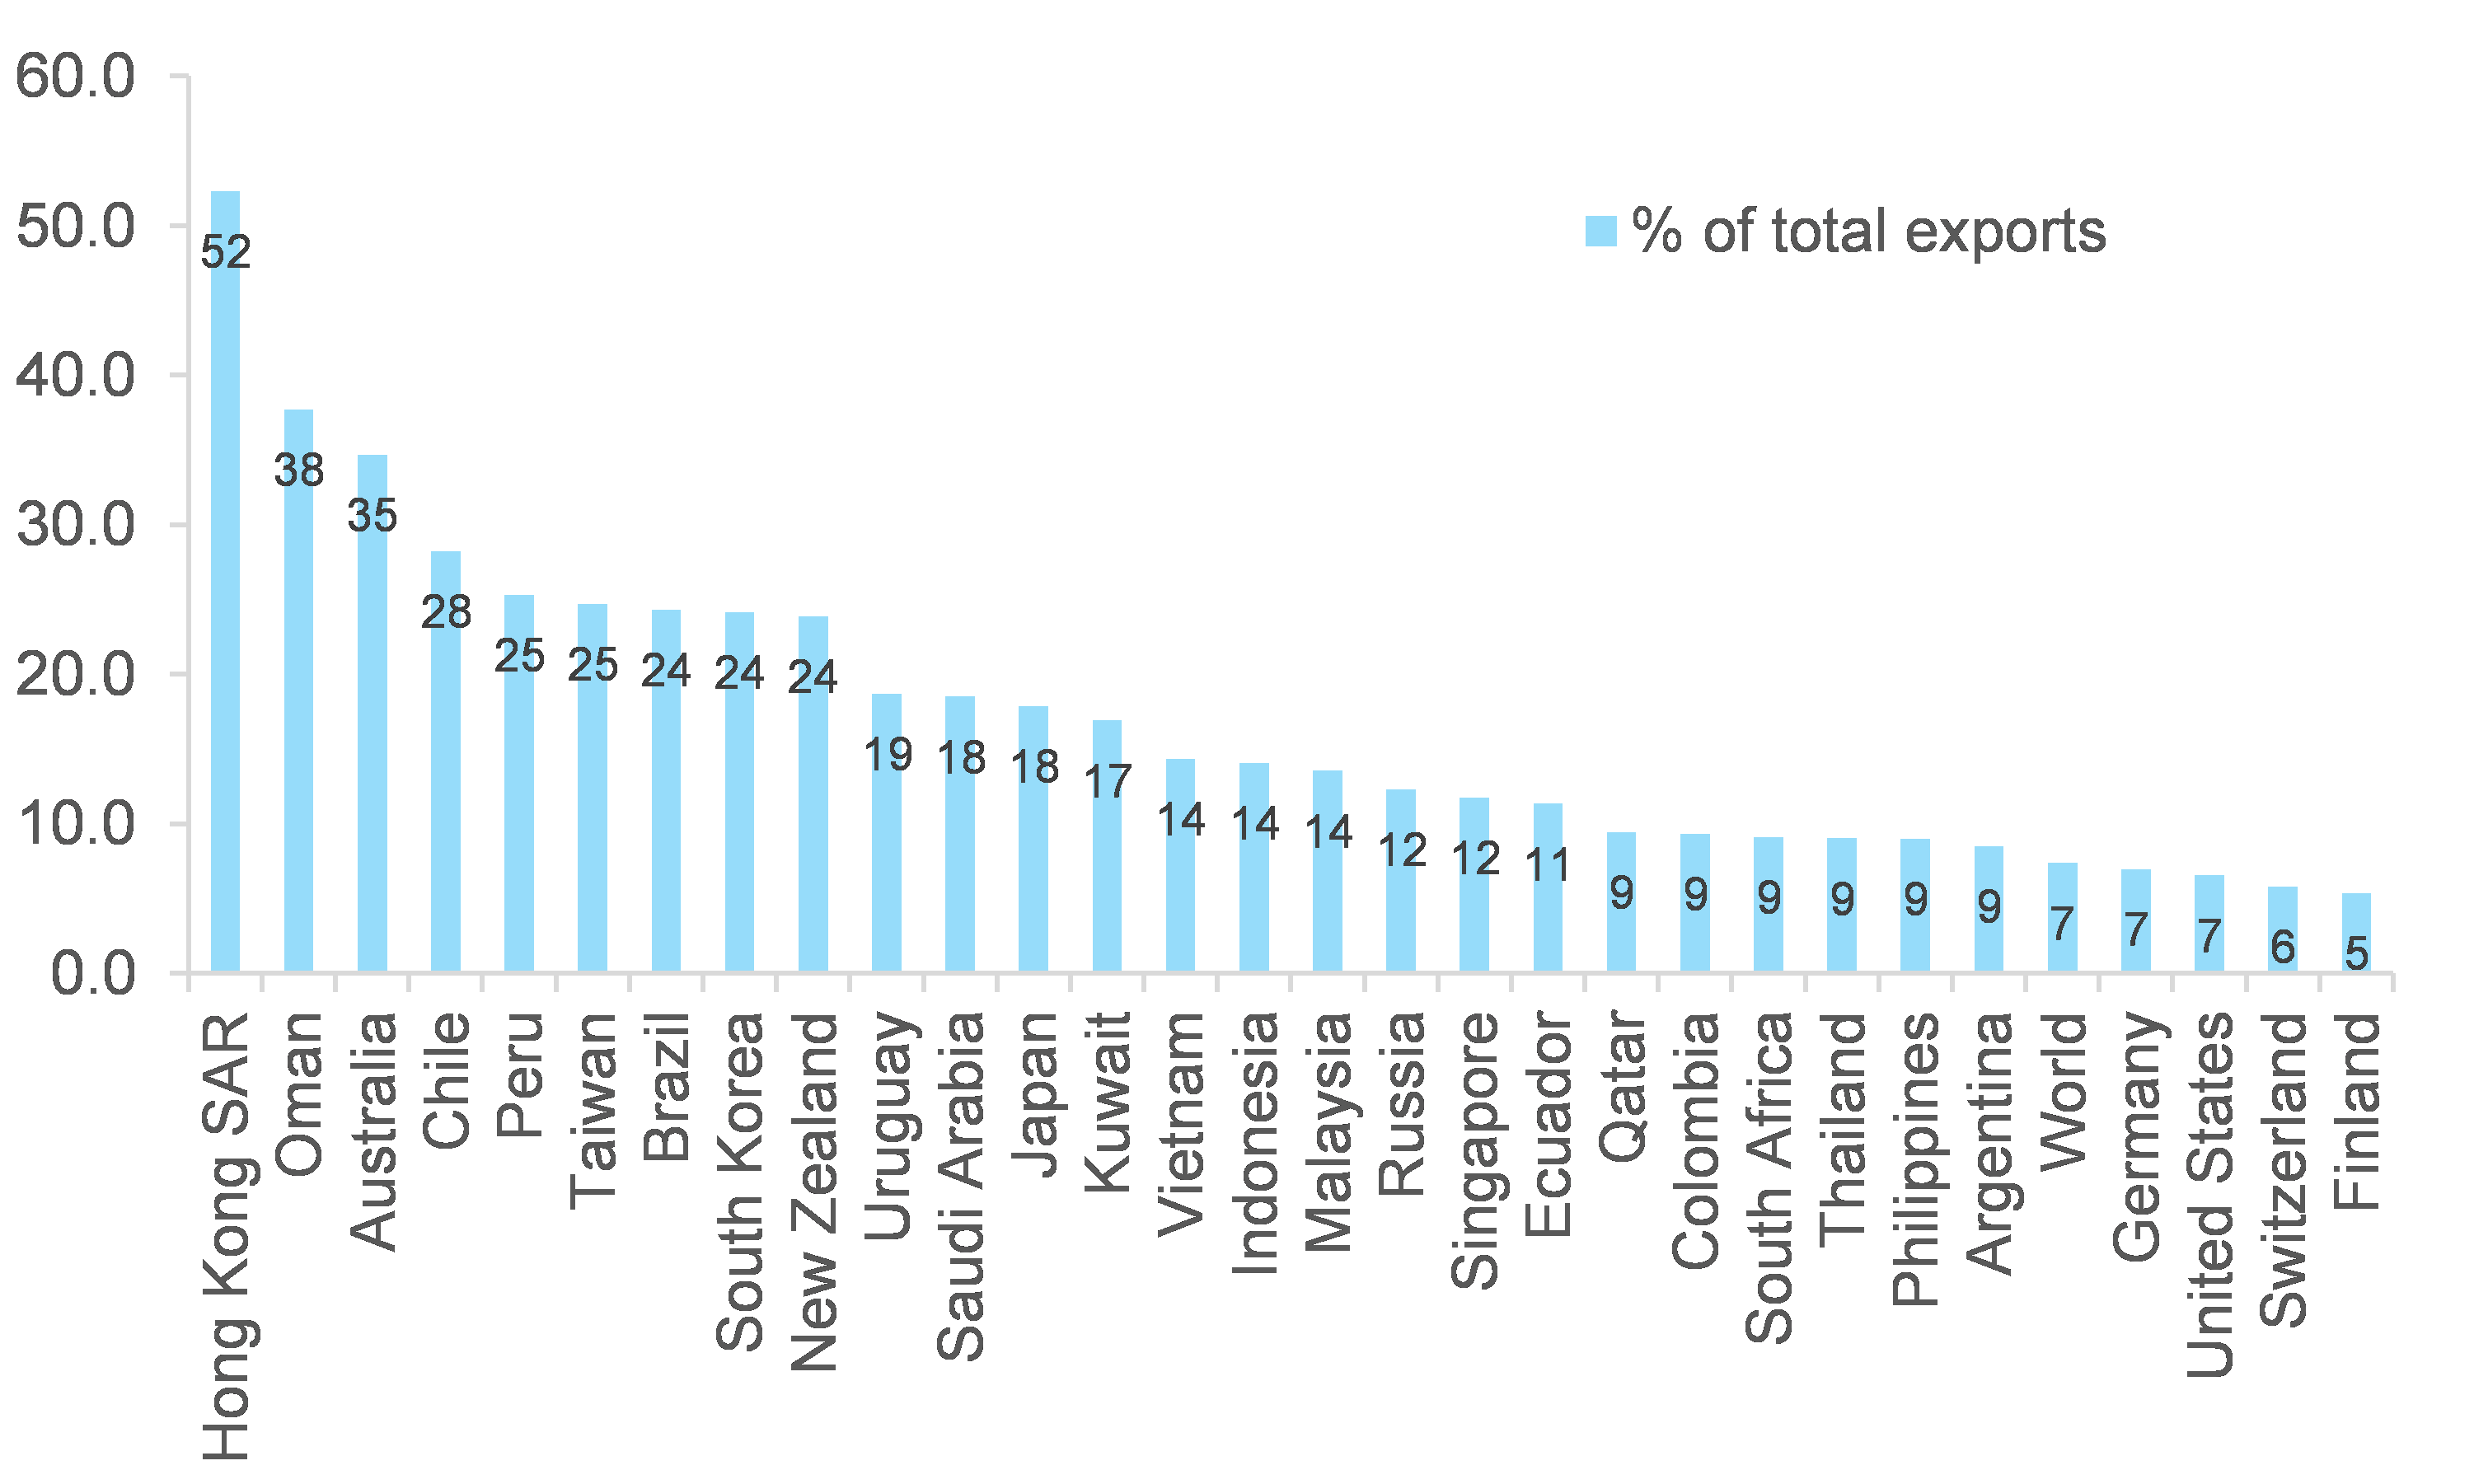
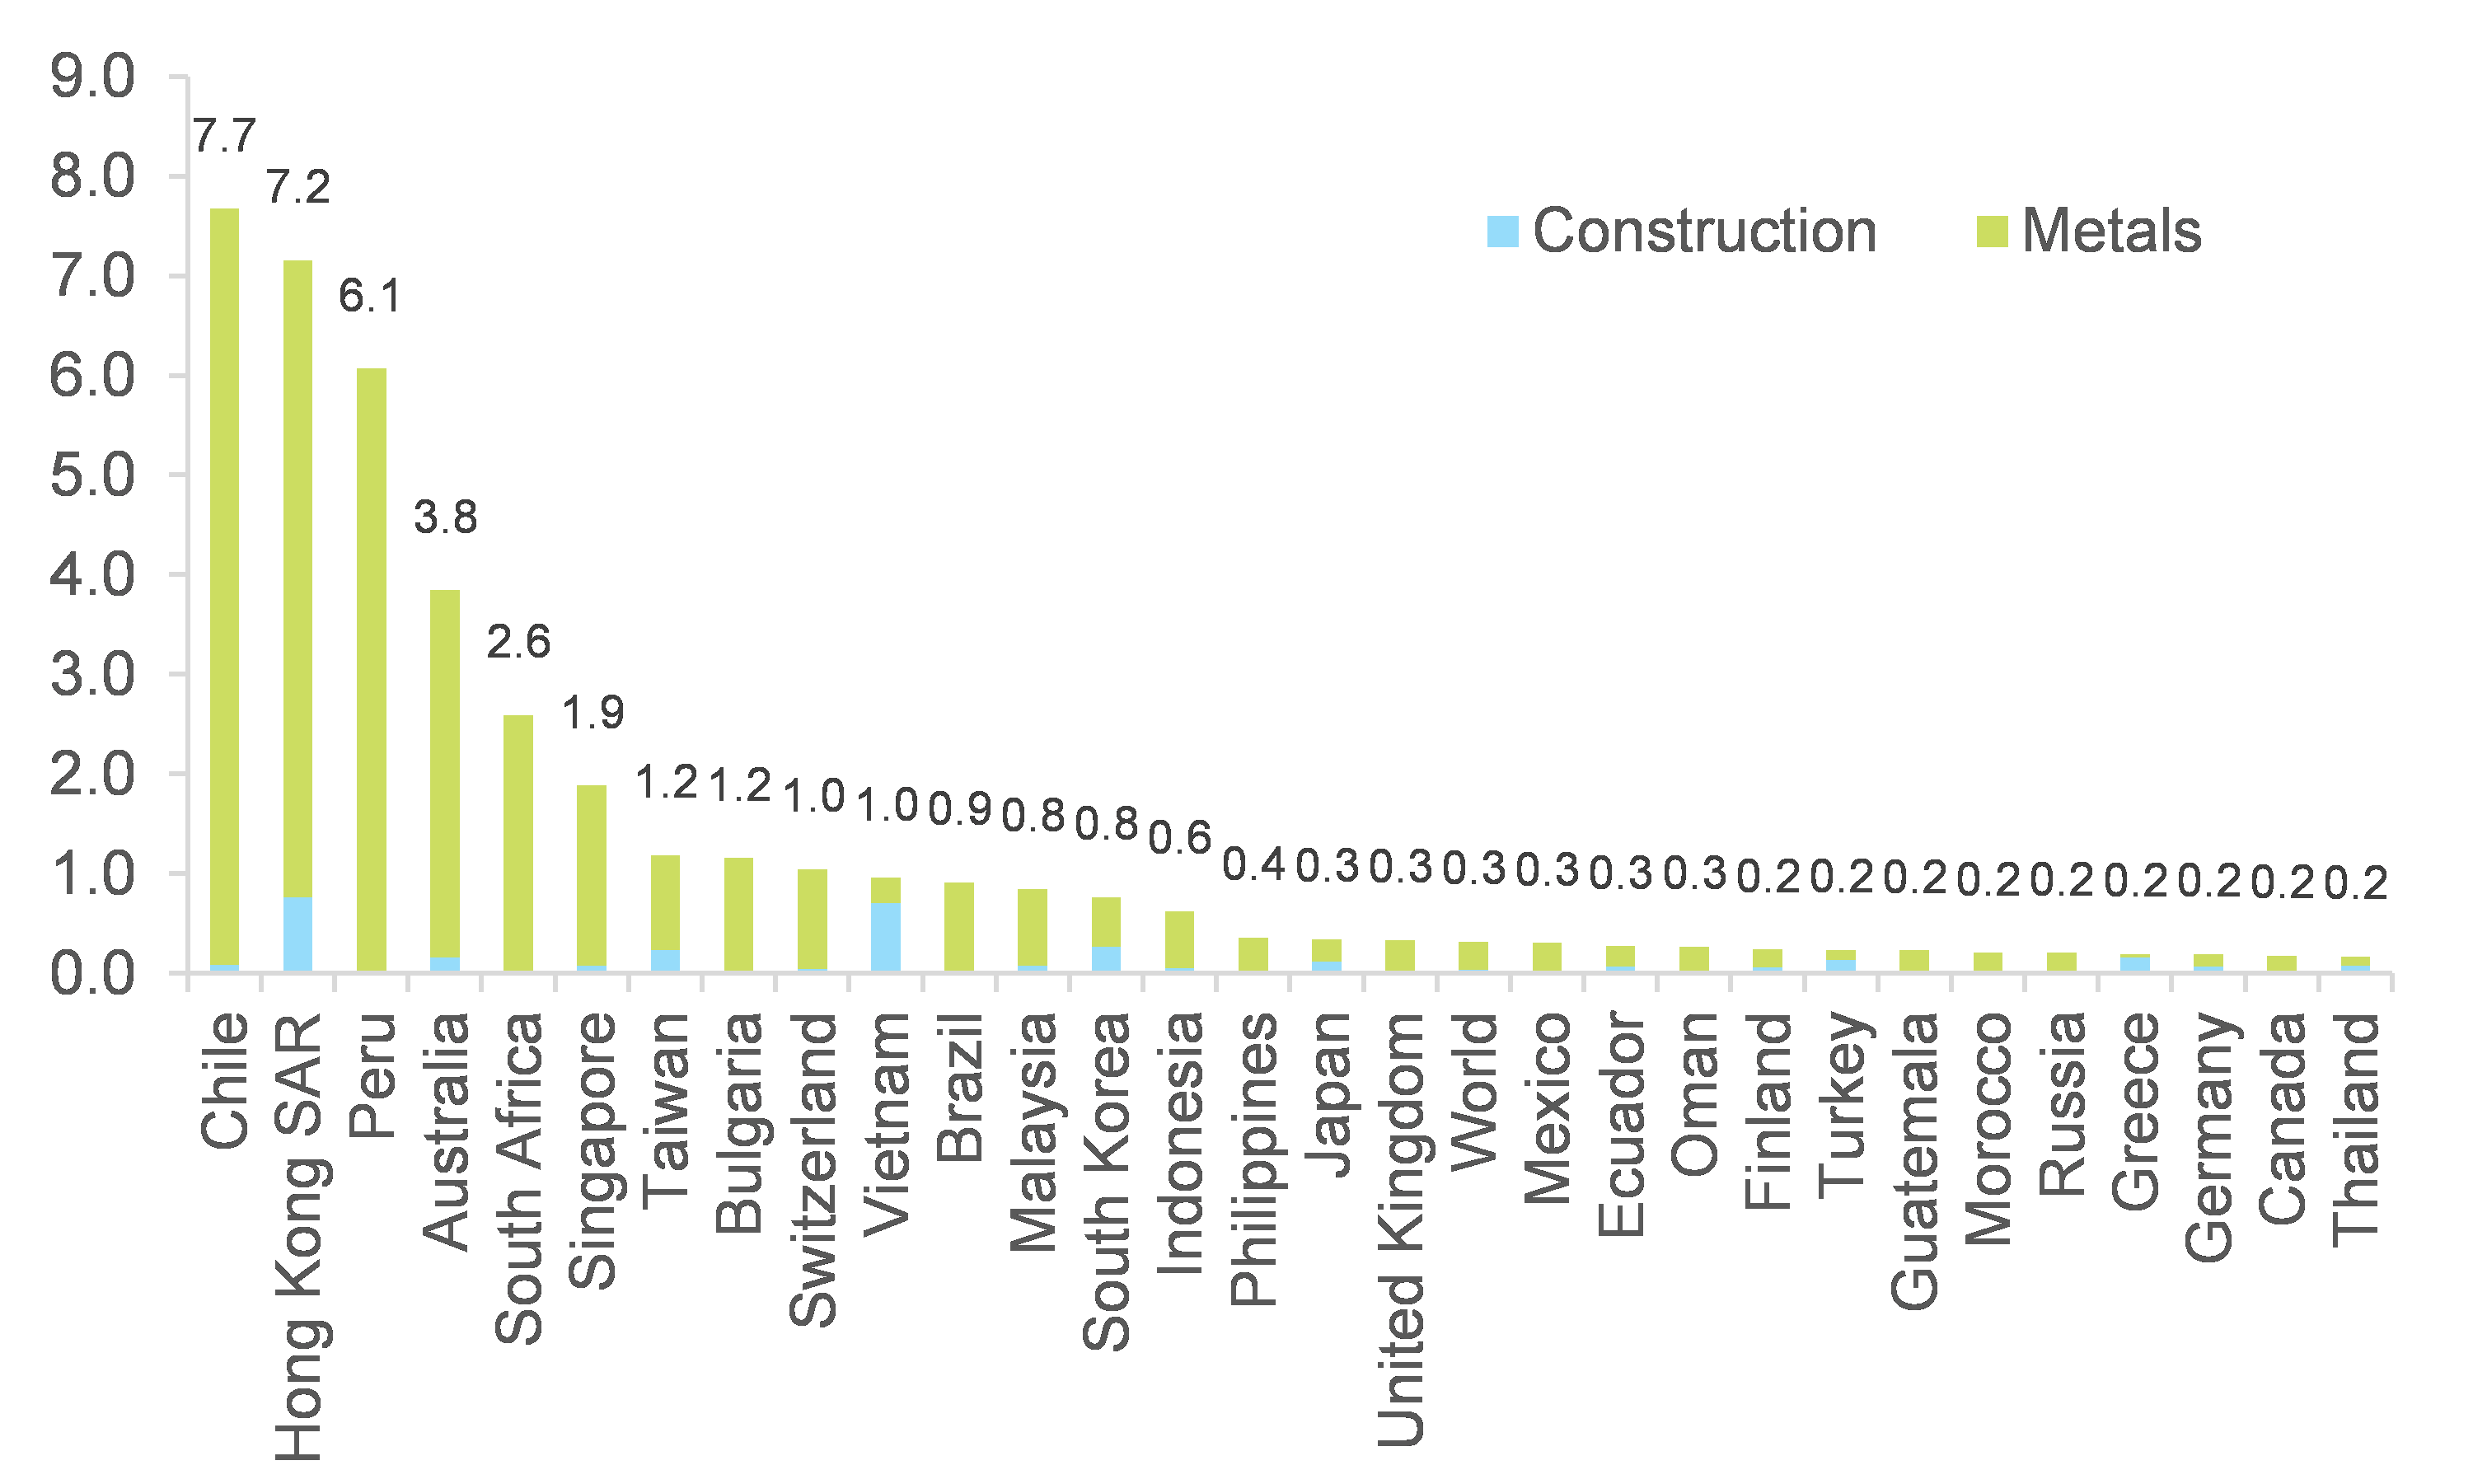
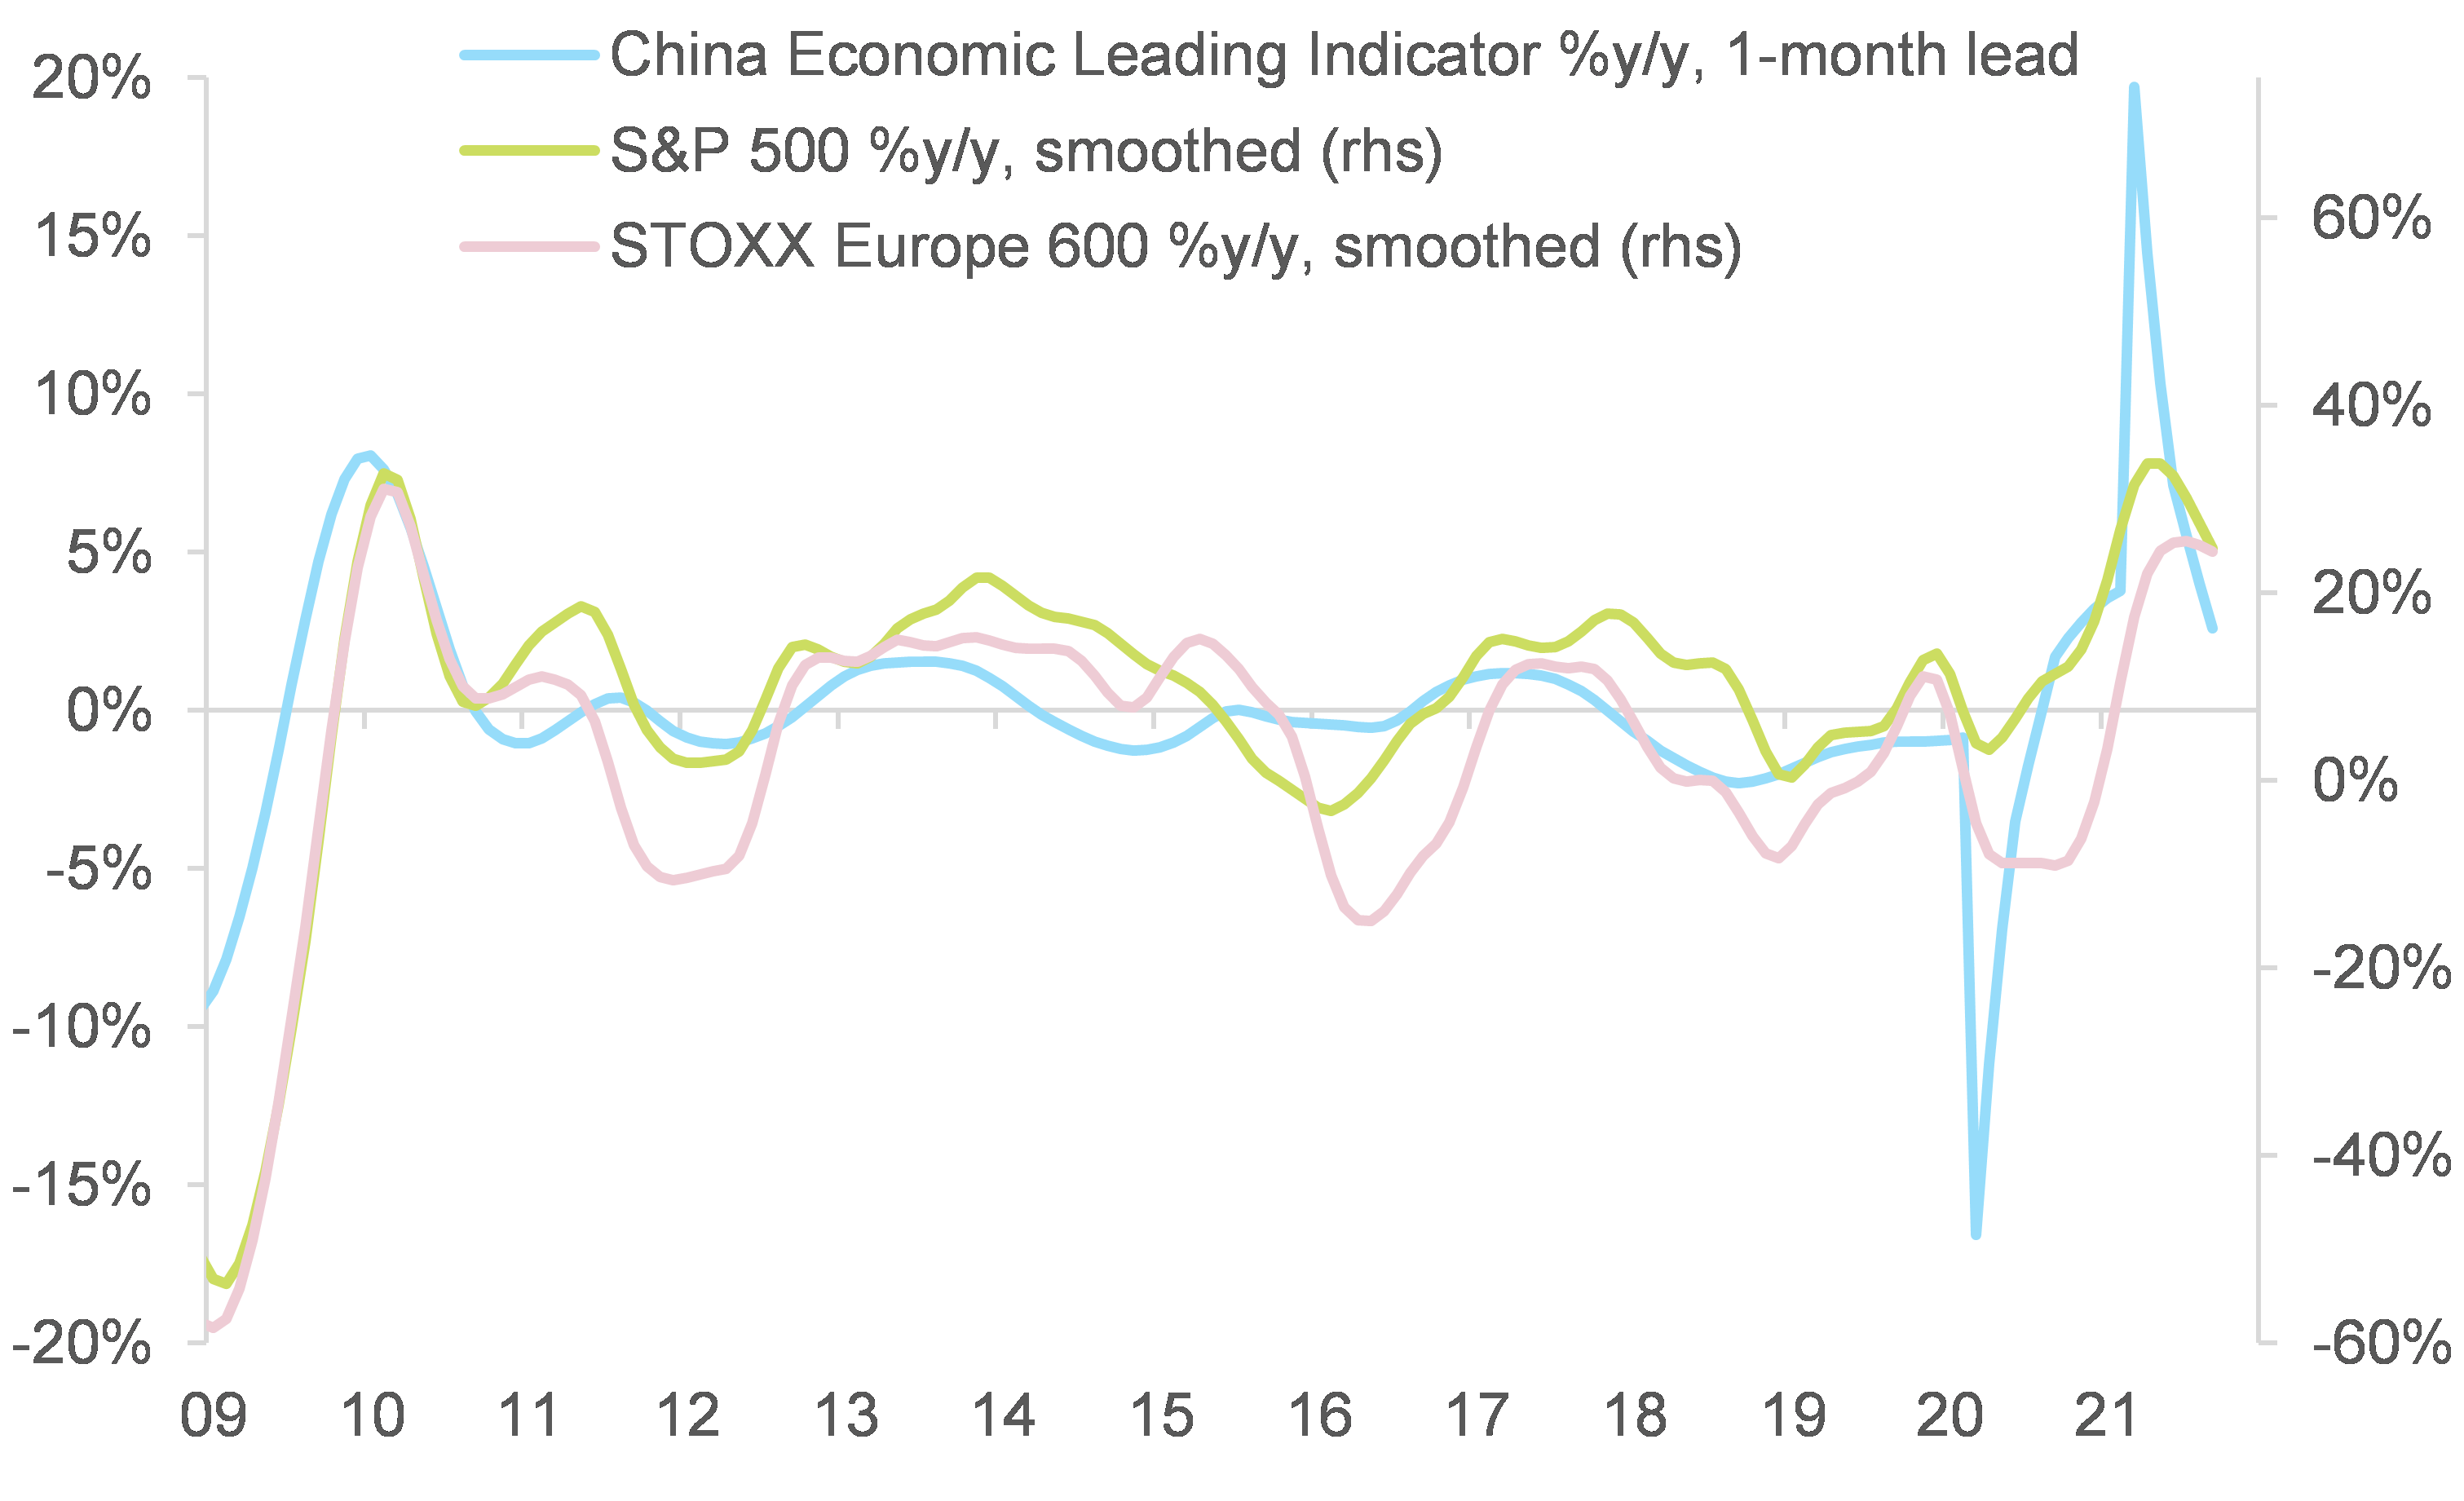
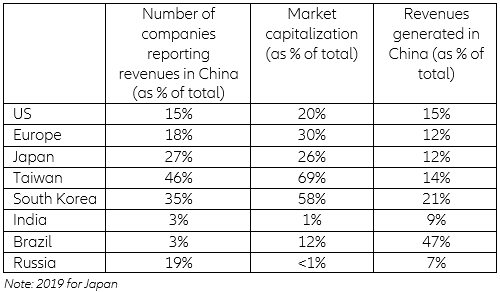
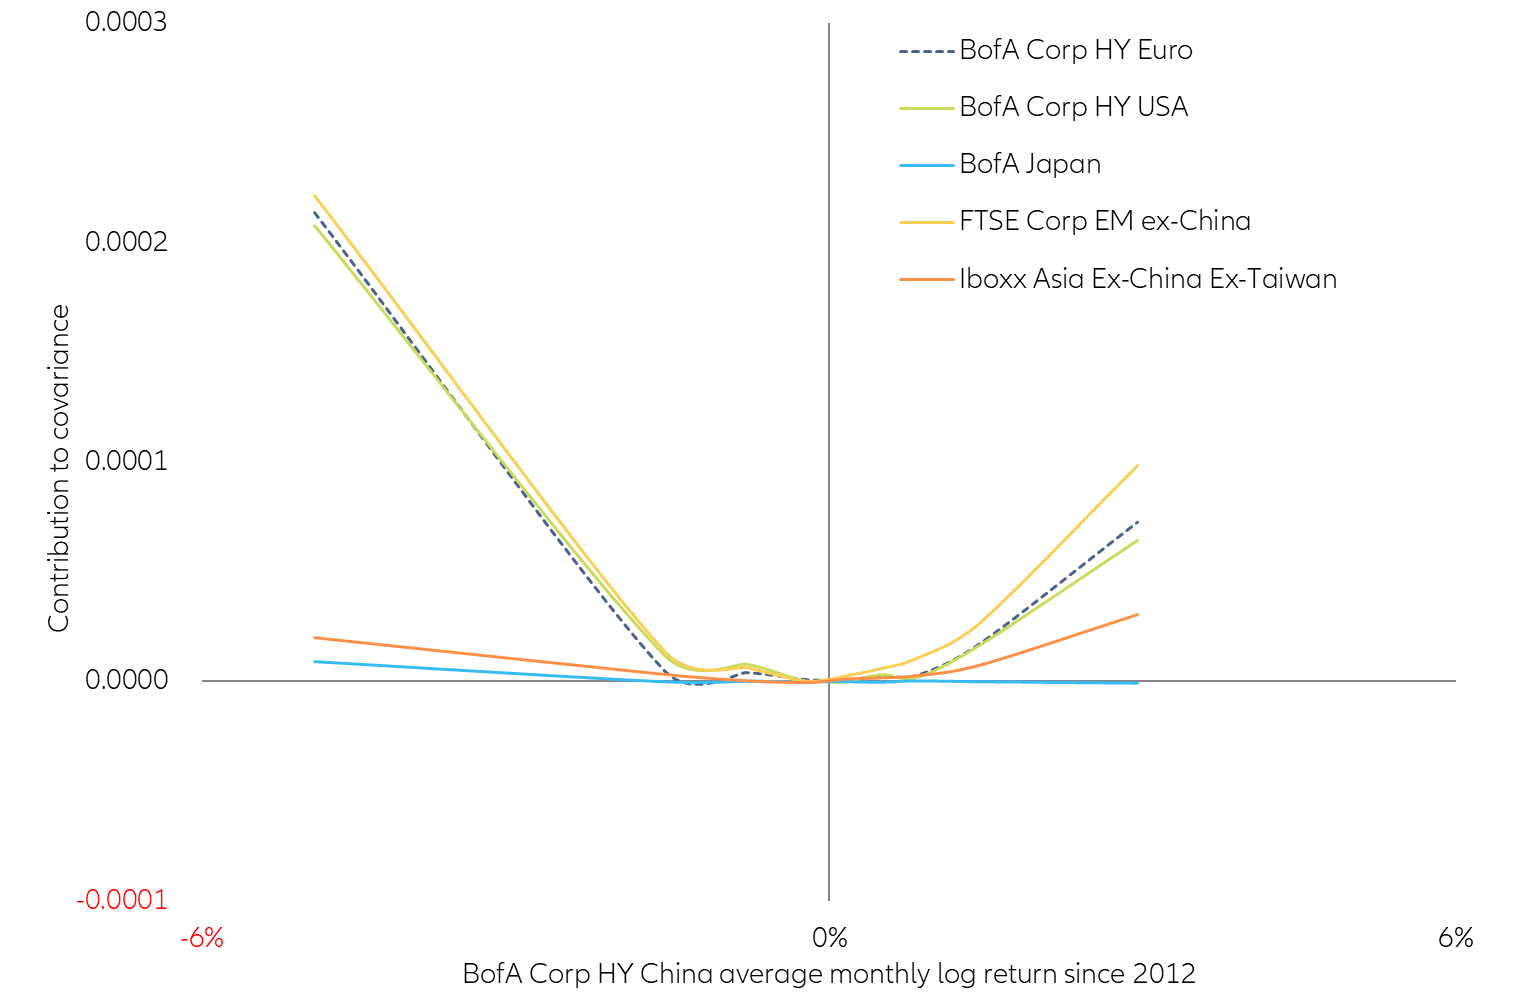
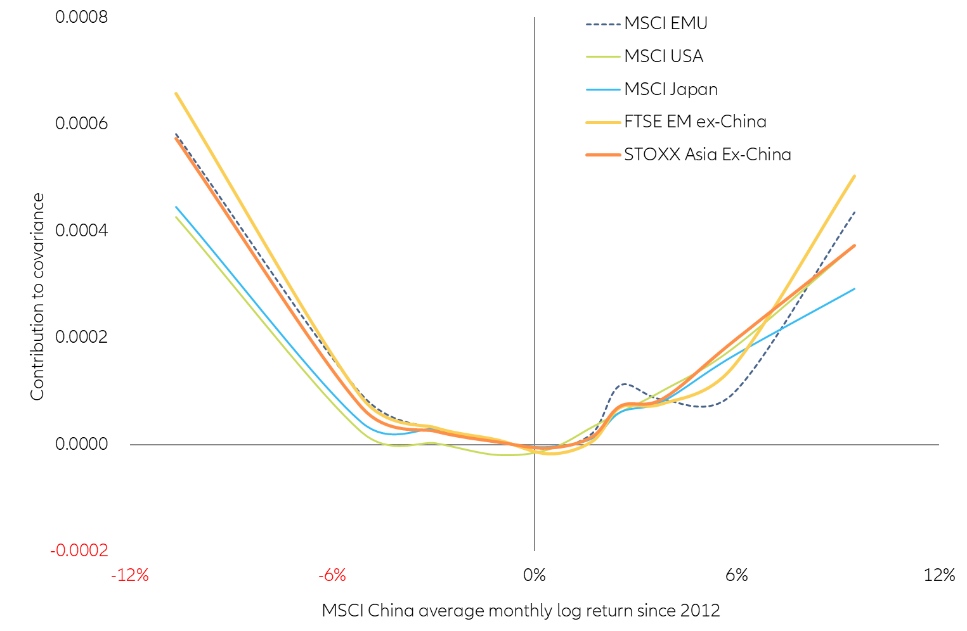
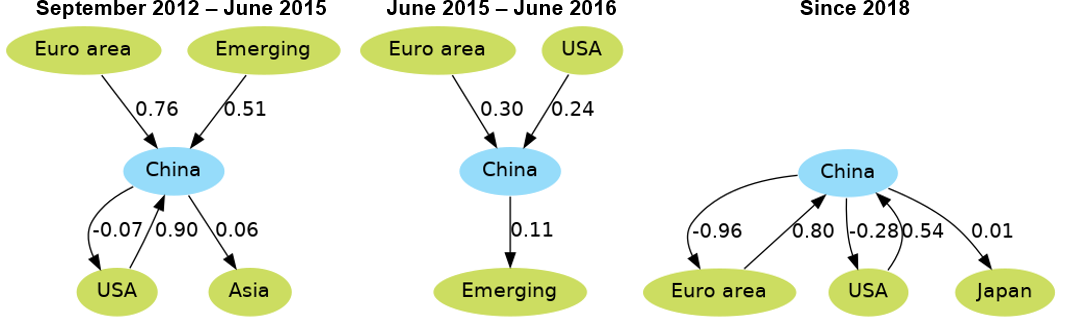
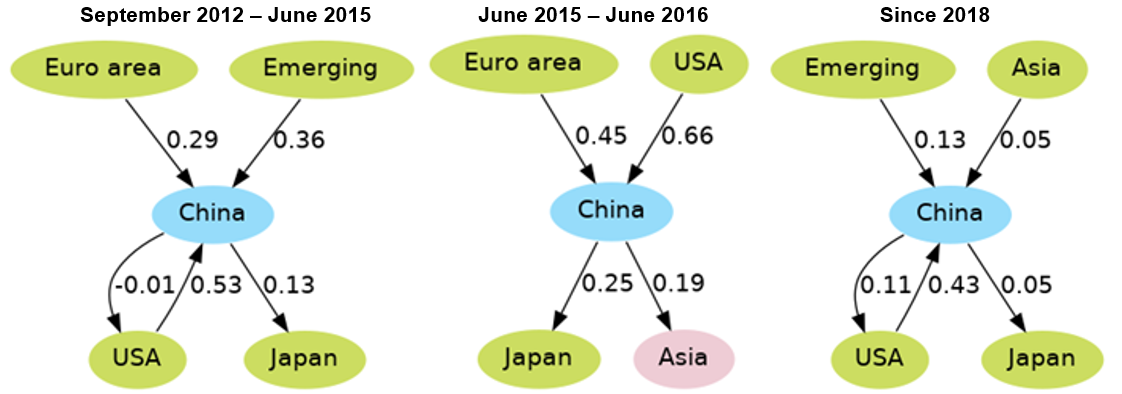
What does China’s slowdown mean for the rest of the world? From a global supply perspective, the Chinese economic slowdown could further raise the cost of trade and global input prices, lengthen delivery delays, and even worsen production shortfalls in the US and Europe. From a global demand perspective, exporters to China could suffer, particularly those exposed to the construction and metals sectors (i.e. Chile, Hong Kong, Peru, Australia and South Africa). Conversely, exporters of energy and more precisely thermal coal (particularly in Indonesia, Malaysia and Australia in Asia-Pacific) are likely to see rising demand in the context of the ongoing energy crisis in China. Beyond the short to medium term, countries dependent on Chinese demand will need to deal with its adjustment to a lower growth regime (average between +3.8% and +4.9% in the coming decade), and the ensuing risks. The changing economic model could also alter exporters’ exposures (heavy industry and construction vs. consumption and high technology goods). Looking at financial markets, we find that spillovers from China to the rest of the world are more likely in equities than corporate credit, but in both cases more likely in the event of significant negative performance in China. During the 2015 China market crash, a -10% drop in Chinese equities would have driven Japanese and Asian equities down by -2.5% and -1.9%, respectively, while Chinese credit bonds falling by -1% drove down EM credit by -11bps (all other things being equal). Since then, access to Chinese assets have opened further, meaning that a market rout in China could have even more damaging consequences, and potentially well beyond Asia and emerging markets.
The normalization of China’s economy is proving bumpier than expected, with a more sudden slowdown since Q3 2021. China quickly bounced back from the Covid-19 hit in Q1 2020, with GDP growth that year reaching +2.3% – a low level but among very few positive growth rates in the world in 2020. Since then, however, growth has been modest and monthly indicators suggest that momentum has slowed further over Q3 2021. Industrial production grew by +5.9% y/y on average in July-August and should slow further in September, compared with an average of +7.8% y/y in Q2 2021 (and +5.8% on average in 2019). Similarly, fixed asset investment (+8.9% ytd y/y in August vs. +12.6% ytd y/y in H1) and retail sales (+5.4% y/y in July-August vs. +13.9% in Q2) also slowed down more than expected. The breakdown shows a particular slowdown within property and infrastructure investment, even when compounding the growth rate over two years (see Figure 1).

Figure 1: Monthly activity indicators, two-year CAGR (%)
Sources: National Bureau of Statistics of China, Euler Hermes, Allianz Research
What explains the slowdown? Policy tightening, delta outbreaks and regulatory shocks

China’s policy mix was intentionally tightened from Q4 2020, but should ease going forward to help the economy navigate ongoing concerns. GDP exceeding the pre-crisis trend as soon as Q4 2020, strong external demand and signs that the domestic economic recovery was becoming more broad-based in H2 2020 laid the ground for authorities to consider normalizing the policy mix  and turning their focus to tackling long-term vulnerabilities, rather than boosting short-term growth.

As a result, fiscal policy tightened, with slowing government expenditures and even a balanced budget in the first half of this year. Weak amounts of local government special bonds issued in H1 2021 also resulted in a visible slowdown in infrastructure investment. An acceleration of bond issuance has occurred since then, and should continue, given that there is still space ahead in the annual quota . We also expect the management of local government implicit debt to turn more gradual to avoid impeding local governments’ capacity to support the economy in the current difficult cyclical context.

On the monetary side, easing reached a peak in October 2020, as measured by our proprietary credit impulse index (see Figure 2). The index declined into tightening territory in April 2021 and total credit growth is at the lowest level since December 2018. Tighter credit conditions along with regulatory measures led to a clear slowdown in the housing sector. Monetary policy has shifted towards easing again since H2 2021, with a 50bp cut in the reserve requirement ratio (RRR) in July and open market operations by the PBOC more recently (see Figure 3). We expect such actions to continue in the coming months (particularly as Evergrande-related strains remain), along with another 50bp cut in the RRR before the end of the year. Credit growth could stop its downwards trend and stabilize, but a sharp rebound is unlikely, given regulatory pressures in the real estate sector.

The aim is thus to help the economy navigate ongoing concerns, not to engineer a full rebound. Indeed, Chinese policymakers are moving on from a “countercyclical adjustment” framework to a “cross-cycle adjustment” framework, where the policy mix is eased cautiously so as to avoid stimulus now becoming financial risks later on.

Figure 2: Manufacturing PMI and credit impulse (proprietary index)
Sources: National Bureau of Statistics of China, PBOC, Euler Hermes, Allianz Research
Figure 3: Central bank liquidity injections (RMB bn)
Sources: PBOC, WIND, Euler Hermes, Allianz Research
Temporary negative crunches take part of the blame, but we expect them to fade away. The unexpected materialization of downside risks (e.g. delta outbreaks and adverse weather events) have also weighed on economic activity. In July and August 2021, China experienced the largest and most geographically spread-out Covid-19 outbreak since Q1 2020. The continued zero-Covid strategy meant that sanitary restrictions along with consumer cautiousness led to a slowdown of mobility, with our holiday-adjusted 100 cities Traffic Index -3.4% below the 2020 levels on average in August, compared to +6.9% y/y in the first half of the year. Going forward, as in the aftermaths of previous waves of Covid-19, a recovery in consumer behavior can be expected in the coming months. Already in September, the services component of the official non-manufacturing PMI rebounded to 52.4 from 45.2 the previous month. The consumer recovery is underpinned by labor market indicators and saving rates almost back to their pre-Covid-19 levels. That being said, consumption and services remain at risk of experiencing a patchy recovery, subject to the sanitary situation. Indeed, we expect China to retain a zero-Covid strategy well into 2022 (despite good progress in vaccination: 155 doses administered per 100 people as of early October).

Increased regulatory scrutiny, most notably in the real estate and energy sectors, is the main drag on economic growth.  Stricter rules to contain indebtedness in the real estate sector were put in place in H2 2020 (in particular the “three red lines” – see more details in the Box). Regulation along with generally tightening credit conditions led to an inflection point in housing sector activity since the end of 2020 as well as ongoing worries about highly-leveraged developers that have both liquidity and solvency issues. Going forward, we think authorities are unlikely to scrap the restrictions put in place. This means economic activity in the housing sector is likely to remain soft in the coming quarters and further defaults by real estate developers are likely (see Figure 4), though a systemic crisis should be avoided. Regulatory attention has also focused on the energy sector this year, with rationing enforced to meet climate targets. Going forward, even though the energy rationing should be eased (to avoid further disruption and effects on popular discontent), industrial production will be negatively impacted and energy costs will rise in the coming months (early reports were already suggesting price increases of 5-30% in heavy industry). See the Box at the end of this section for more details on the regulatory crackdowns.

Figure 4: Bond redemption schedule of 10 selected risk real estate developers* (RMB bn)
* these are companies among the top 50 largest ones (in terms of assets) that cross or are close to crossing all of the “three red lines”.
Sources: Refinitiv, Euler Hermes, Allianz Research
In this context, we revise our China GDP growth forecasts on the downside to +7.9% in 2021 and +5.2% in 2022, from +8.2% and +5.4%, respectively, on the basis of the carryover from H1 2021 already at +7.4% but slower growth in H2 2021 (see Figure 5). The softness is likely to extend into the beginning of next year, while H2 2022 could be less worrying, with the critical 20th Party Congress to take place in autumn.

Figure 5: Real GDP growth (%y/y) and PMI surveys
Sources: National Bureau of Statistics of China, Euler Hermes, Allianz Research
Worries about the Chinese economic slowdown are likely to remain in the coming quarters, with risks still tilted to the downside. Our revised GDP growth forecasts assume the absence of a new significant Covid-19 outbreak to allow for the recovery in services to carry on, though industrial activity and the real estate sector should be under pressure in the coming few months. In particular, we would watch out for concerns in the real estate sector deteriorating further in a long-lasting way, the energy shortage spreading further and worsening, a patchy recovery of services (subject to the sanitary situation), fiscal spending failing to ramp up, the “common prosperity” goal scaring off private and foreign investment (in the short and long-term) and, externally, geopolitical tensions. Symmetrically to these downside risks to the economy, the possibility of more significant policy easing and changes to the regulatory environment are likely to depend on the labor market as social peace has been and remains the overarching target for authorities.

The key downside risk: real estate issues broadening and spilling over to other areas of the economy. Such a situation could be the result of policies remaining overly tight, and authorities’ communication and actions (e.g. on liquidity conditions and regulation) not being forceful and convincing enough. Weak confidence would thus last for longer, leading to a sharper slowdown in housing activity than expected, which in turn could impact the broader economy. Indeed, we estimate that, accounting for downstream and upstream sectors, final demand generated by the real estate sector accounts for c.25% of China’s GDP. Furthermore, housing represents 78% of household assets, 40% of bank loans are backed by properties  and land sales amount to roughly one-third of local governments’ gross revenues. A significant housing downturn could thus limit fiscal policy’s room for maneuvering and put pressure on the stability of some financial institutions – most likely smaller ones that are already the most vulnerable . That being said, a widespread banking or financial crisis remains unlikely in our opinion: the sector has gone through deleveraging and de-risking efforts over the past few years (both for on- and off-balance sheet exposures), lending standards for mortgages are tight in China compared to the rest of the world (most notably, Chinese homebuyers need to make an at least 30% down payment for most first-home purchases) and the central bank has demonstrated in the past that it can react quickly against stress episodes (e.g. liquidity crunch in June 2013).

Another downside risk: geopolitical tensions ramping up. Recent events have reminded us yet again of external risks that surround the Chinese economy. Renewed tensions emerged in the region as a record number of Chinese military aircraft flew into Taiwan’s air defense identification zone in early October 2021. Harsher language was also recently used on both sides of the Taiwan Strait. This comes in the context of US military forces holding military exercises in Asia-Pacific with allies, along with seemingly strengthening relationships with countries in the region (first meeting of the Quadrilateral Security Dialogue between the US, India, Japan and Australia in March 2021, AUKUS security pact reached in September 2021 between the US, the UK and Australia, etc.). The likelihood of an actual conflict erupting remains extremely low as all sides still deem the costs outweighing the benefits. However, the situation creates conditions for an accidental further escalation. It also probably denotes the intention of the US to further deploy its containment strategy against China, which started with the Obama administration and its geostrategic pivot toward Asia. Separately, US-China trade relations are unlikely to improve, as illustrated by the Biden administration’s agenda for trade with China revealed in early October. China is also falling behind regarding its Phase One Deal commitments, with imports from the US at 61% of the goal as of August 2021 . The resumption of bilateral discussions (including a long-awaited virtual summit meeting between President Biden and President Xi scheduled for the end of 2021) is marginally positive as it excludes the return of trade tensions at the level seen during the Trump administration. We continue to expect a status quo in US-China trade tariffs, although non-tariff barriers could increase.
From a global supply perspective, the Chinese economic slowdown could further raise the cost of trade and lengthen delivery delays. In particular, the electricity rationing measures are pushing production costs up, which in turn will raise the price of goods exported from China to the rest of the world and potentially pressure corporate margins, especially in Europe. Potential new outbreaks of Covid-19 in China could also risk pushing supply chain delays even longer. In addition, we do not expect sharp depreciation of the CNY that could compensate for these upward price pressures. Apart from price effects, slower industrial and manufacturing activity in China could worsen production shortfalls issues in the US and Europe.

From a global demand perspective, some commodity prices, emerging markets and exporters to China would suffer from the economic slowdown. A slower China is mostly negative for emerging markets, the Asia-Pacific region and some commodity exporters (see Figure 8). We find that Chile, Hong Kong, Peru, Australia and South Africa could be most at risk as exports to China in the construction and metals sectors account for more than 2% of their GDPs (see Figure 9).  Conversely, exporters of energy and more precisely thermal coal (particularly in Indonesia, Malaysia and Australia in Asia-Pacific) are likely to see rising demand in the context of the ongoing energy crisis in China.

Beyond the short to medium-term, countries dependent on Chinese demand will need to deal with its adjustment to a lower growth regime  (which started before Covid-19), and the ensuing risks. Indeed, our growth potential model suggests China’s GDP growth is likely to average between +3.8% and +4.9% over the coming decade (after +7.6% in the 2010s). China’s changing economic model could also alter exporters’ exposures in the long run, with those reliant on heavy industry and construction to comparatively lose out, while those related to consumption and high technology goods could benefit.

Figure 8: Exports to China, as % of total exports (2021E)
Sources: various, Euler Hermes, Allianz Research
Figure 9: Exports to China in the construction and metals sectors, as % of GDP (2021E)
Sources: various, Euler Hermes, Allianz Research
From a financial markets perspective, the Chinese economic slowdown could weigh on other equities, with a potential negative wealth effect on consumers. Worries about the Chinese economy and/or actual slowdown have in the past weighed on market performance in the rest of the Asia-Pacific region and the rest of the world (see Figure 10). Apart from sentiment contagion (which we analyze later in this section), this relationship isn’t surprising when considering for example equity indices, where constituent companies derive a share of their revenues directly from sales in China. More precisely, in 2020, 75 companies in the S&P 500 index (representing 20% of total market capitalization) and 100 companies in the STOXX Europe 60 index (representing 30% of total market capitalization) reported sales in China (see Figure 11). Among these companies, China represented 15% of total revenues in the US and 12% in Europe . Beyond Asia-Pacific and emerging markets, a Chinese economic slowdown could thus weigh on capital markets in the US and Europe, which could in turn impact households and private consumption through a negative wealth effect. Indeed, we find that securities amount to 25% of households’ financial assets in Germany, 28% in France, around 40% in Italy and Spain, and as much as 55% in the US (primarily equities) .

Figure 10: China economic activity vs. US and Europe equity performance
Sources: Refinitiv, Euler Hermes, Allianz Research
Figure 11: Listed companies’ revenues generated in China
Note: 2019 for Japan
Sources: Refinitiv, Euler Hermes, Allianz Research
Could stress episodes in Chinese capital markets spill over to the rest of the world? Chinese offshore corporate bonds are more at risk, while sentiment contagion to other markets is more likely for equities than corporate credit. In both asset classes, however, a spillover is more likely in the event of significant negative performance in China. China’s corporate bond market has been under pressure over the past few months and we expect further defaults among risky real estate developers in the short-term, especially on offshore bonds (i.e. denominated in foreign currencies). Problems are likely to remain contained to the real estate high-yield space (see Figure 12) and valuations of risky real estate developers. The Chinese real estate sector overall has a weight of just c.2% in the MSCI EM and JPM CEMBI indices. To analyze the possible spillover effects of Chinese markets to other financial markets, we look at the bivariate cumulative distribution function (hereinafter “copula”) of Chinese assets performance with their counterparts from different geographies. This kind of analysis allows us to identify whether two given variables (in this case monthly log returns) behave similarly at different points of the distribution.

Figure 12: FTSE bond index, yield (%)
Sources: FTSE, Euler Hermes, Allianz Research
When applying the copula analysis to Chinese high-yield bonds and other bonds from different geographies, we find the highest co-movements at the left tail (i.e. in situations of large negative performance) with corporates in the US, the Eurozone and emerging markets. The covariance rates are positive but even for the aforementioned regions, the synchronization does not appear very strong. After applying the same analysis to the equities markets, the picture varies within certain geographies. Conversely to corporate bonds, at the left tail of the distribution, co-movements in equities with the rest of Asia are more significant than with other regions. But again, across all geographies, all the covariances are positive and the contributions are bigger in the left tail. When comparing with corporate credit, the co-movements in equities are greater (taking China as the pivoting point), which indicates that the markets for equities are more interconnected. That being said, our analysis also shows that even a month with up to -6% returns in the MSCI China would not necessarily come along with a similar negative performance in other markets. However, the copula has some limitations when it comes to detecting which assets lead and which follow (if such relationships exist). We address this issue by building a contagion analysis next, where we explore the relationship of Chinese capital markets with other markets in an event of significant stress or crash (not our central scenario).

Figure 13: Bivariate cumulative distribution – BofA Corp HY Chinese bonds vs. regional bond indices
Sources: Bloomberg, Refinitiv, Euler Hermes, Allianz Research.
Figure 14: Bivariate cumulative distribution. MSCI China $ vs. relevant equity indexes from other geographies.
Sources: Refinitiv, Euler Hermes, Allianz Research.
In a scenario where things go wrong in China, financial spillovers on the rest of the world would be more significant and far-reaching, probably beyond Asia and emerging markets. Having established the existence of a relationship, we now carry out a TYDL contagion analysis, as in Marais & Bates (2006) , allowing us to identify in which way the cross-geography correlations usually go (i.e. whether A precedes B, or B precedes A). Additionally, we have split this analysis into three different periods: 1/ September 2012 to June 2015, 2/ June 2015 to June 2016 (covering the Chinese equities crash) and 3/ after 2018. This separation allows us to analyze not only the direction of the movements, but also how it changes over time.

Corporate bond markets: When looking at the direction of spillover effects (Figure 15) in this space, we find that before 2015, Chinese markets were influenced by the Eurozone, US and other emerging markets while having a very limited impact on the US and Asia. During the 2015 crash, spillovers from Chinese credit were directed towards the EM credit space and Eurozone and US markets were less impactful on China. In other words, Chinese credit bonds falling by -1% in 2015 drove down EM credit by -11 bps – all other things being equal. However, we do not believe this episode is a fully relevant example of potential spillovers in the event of a future crisis: Since 2018, Chinese credit has become more important and intertwined with developed markets (Eurozone, US, Japan). In our view, a crisis in China could now have more damaging consequences and potentially reach well beyond the EM space.
 
Figure 15: Corporate bond markets relationships and sensitivities to China
Sources: Refinitiv, Euler Hermes, Allianz Research.

Equity markets: A similar contagion analysis in this space yields similar conclusions. The 2015 crash in China led to a regional story: Our analysis finds that a -10% drop in Chinese equities would have driven Japanese and Asian equities down by -2.5% and -1.9%, respectively (see Figure 16). Nevertheless, the role of Chinese equities in global markets has changed quite a bit since 2018. Indeed, whereas before 2015 China had a limited impact on other markets (mostly spillovers towards Japan), since 2018 it has been less influenced by other markets (“received” elasticities are down) and most importantly, Chinese equities now have a sizeable impact on US markets – which set the tone for global equities. This is consistent with the increasing liberalization of Chinese capital markets, with the foreign ownership of Chinese equities and bonds rising 2.5x between the beginning of 2016 and beginning of 2018 (and around 6x by the beginning of 2021). As such, our analysis leads us to believe that a crash in Chinese financial markets today could result in a broader and stronger fallout for global markets.

Figure 16: Equity markets relationships and sensitivities to China

Figure 16: Equity markets relationships and sensitivities to China
Sources: Refinitiv, Euler Hermes, Allianz Research.
Could concerns over China’s real estate sector act as a wake-up call for other countries? We find no other companies that present a risk with magnitude similar to Evergrande. An additional form of financial spillovers, even if a widespread sentiment contagion is avoided (be it in equities or in corporate credit), is at the real estate sector level. Ongoing events have put the sector under strict scrutiny not only in China, but also in the rest of the world. Fueled by uncertainties surrounding the post-Covid recoveries – even more uncertain is the long-term footprint that the crisis will leave on the sector, given the shift to working from home – and rising real estate prices, the events in China have created a “hunting for the next default” mindset.  

Within this context, we perform a “sanity check” by testing whether the more than 600 real estate companies listed worldwide would comply with the “three red lines” set out by Chinese authorities. We focus specifically on real estate developers (237 out of the more than 600 total), measuring not only the performance with regard to the “three red lines” but also considering the size of the company (its assets) and the size of the country it operates in (to gauge whether it is of systemic size).  

Our analysis shows that there are other big indebted real estate developers in other parts of the world that would not meet the “three red lines”. Figure 17 shows the liabilities-to-assets and net-debt-to-equity ratios of those companies. Taking into account indebtedness level and size, at a country level, there could be systemic concerns outside China but in general if we make a global comparison, none of them (alone) has the same harmful potential than the risk of an unstructured settlement of the current situation in China. However, we should monitor developments in Canada where two real estate developers cross the “three red lines”, Germany (three developers) and Japan (three developers). Some other countries should also be monitored, however to a lesser extent: Belgium, Denmark, Estonia, Poland, Cyprus, Saudi Arabia and Vietnam. In each of these countries, one developer has crossed the “three red lines”.

Figure 17: Global real estate developers’ indebtedness ratios
Note: the size of the bubble is total assets adjusted by the GDP of the country. When not from the US, currencies have been converted to USD using the exchange rates on 11 October 2021.
Sources: Refinitiv, Euler Hermes, Allianz Research