The UK intends to lower its global import tariff by -2.2pp to 2.8% post its EU exit, the second lowest tariff among G-20 countries after Australia. These new tariffs will apply to imported goods from countries with which the UK will not have a Free Trade Agreement (FTA) on 01 January 2021. Transport and aeronautical equipment are the categories that register the highest drops in tariffs. The new Most Favored Nation (MFN) Tariff Schedule established by the UK at the WTO in the context of Brexit is clearly more advantageous than the current one. The share of duty-free products in total imports, without taking into account the impact of FTAs, will increase from 47% to 60%, and the MFN tariff will thus decrease by -2.2pp to 2.8%. For agricultural products, the tariff is planned to fall by -1.6pp to 7.5%, while for non-agricultural products the reduction is higher at -2.2pp to 2.5%. We calculate that import tariffs on intermediate goods and capital goods will be more than halved at 1.1% and 1.3%, respectively. Tariffs for consumption goods will remain high – above 6.0% – but will fall by -2.0pp (see Figure 1). Transport and aeronautical equipment (aircraft, spacecraft and their pieces) will see their tariffs drop by -2.7pp to almost 0%, while ships, boats and floating structures, as well as railway and tramway locomotives will become duty-free under the new tariff schedule (see Figure 2). Textiles, leather and footwear, non-electrical machinery and transport equipment are the sectors with the highest drops in tariffs.

Figure 1 – Trade-weighted average MFN import tariffs (current v. new), by product types
Sources: WTO, Euler Hermes, Allianz Research
Figure 2 – MFN import tariffs (current v. new), by product, WTO labelling
Sources: WTO, Euler Hermes, Allianz Research
As for Brexit, we continue to expect that the UK will have an FTA with the EU by end-2021, and successful negotiations with third-party countries. Given the Covid19-related delay in the current negotiations with the EU, our baseline scenario (80% probability) is an extension of the transition period to the end of 2021, delaying the implementation of these tariffs by one year. We expect the UK to sign a comprehensive FTA with the EU whereby almost all goods would be duty-free. Moreover, the UK has secured 20 FTAs (9% of UK imports) that will be implemented at the same time as the EU exit, while 19 are still under negotiation (7% of UK imports). We take the assumption that the UK will be able to secure most of these FTAs on 1 January 2022. The U.S. and China are not part of the FTAs under negotiation. As a result, we estimate that in our “Soft Brexit” scenario, 34% of imported goods will be taxed under the new trade policy at the WTO . Also note that non-tariff barriers (administrative and logistics) between the UK and the EU would significantly increase, even under the most favorable of both scenarios. They are estimated at 10% ad-valorem post Brexit – but cannot be explicitly taken into account in our calculation hereafter. We assume that the exit from the EU, with an FTA, will further push down the GBP by -3% against the EUR, given the rise in non-tariff barriers, the end of passporting rights for financial services and reduced foreign investments in the UK similarly to the post-2017 period.

According to our calculations, the aggressive trade policy pursued by the UK could lead to a +2.2% increase in import prices over a year, and be negative for competitiveness abroad. Research has proved that price competitiveness is decisive for the U.S., while non-price competitiveness is more important for China and Spain. For the UK and 
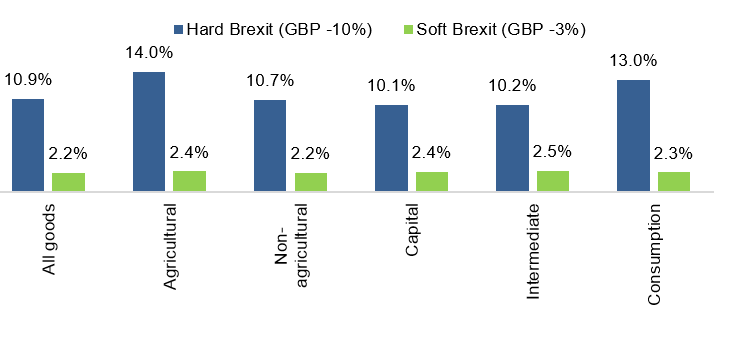
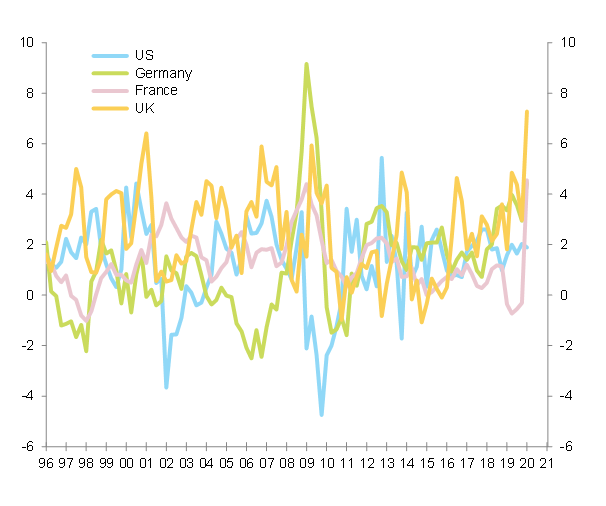
France, for example, both price and non-price effects offset each other . Our analysis looks at the short-term effects of the mix between the currency depreciation and the reduction of trade barriers. It does not include further medium-run currency correction. In case of a Hard Brexit, import prices would increase by +10.9% (see Figure 3). Though a lower GBP should in theory boost export volumes, this J-curve effect may not work for 
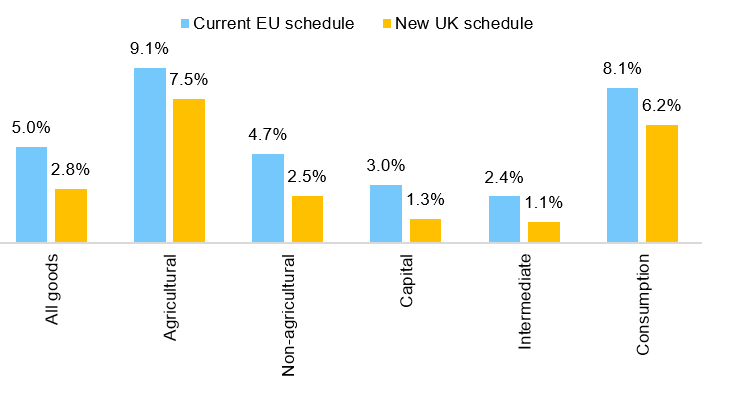
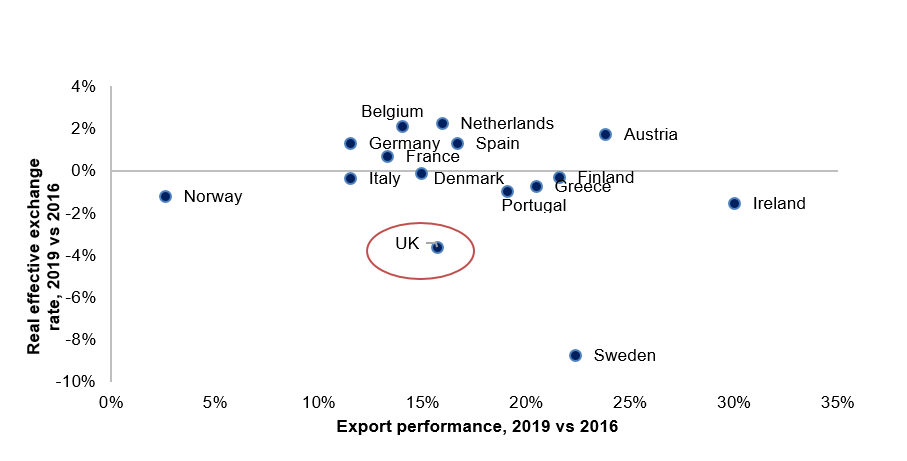
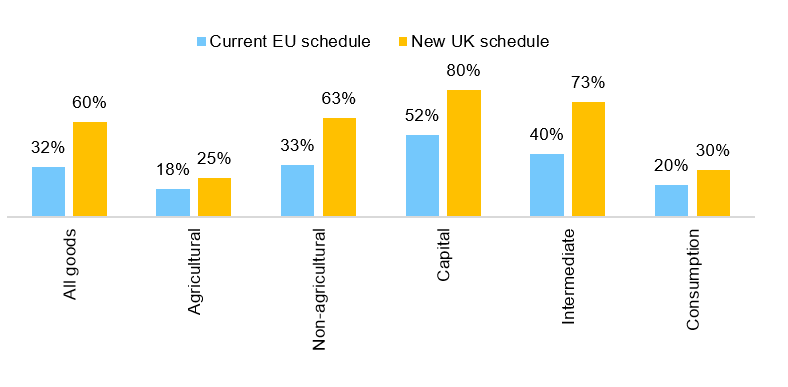
the UK because of its unique economic model. In recent years, though the GBP has lost -3.6% of its value in real terms, exports rose by +15%, while the Euro appreciated and exports from Austria, Spain and the Netherlands increased by +24%, +17% and +16%, respectively (see Figure 4). Capital goods represent more than 16% of total UK imports. While 52% of capital goods imported from MFN countries are duty-free under the current schedule, this share could jump almost +30pp to 80% under the new tariff schedule (see Figure 5). In a Soft Brexit scenario, capital goods import prices would increase by +2.4% (v. +10.1% in a Hard Brexit).

For imported consumption goods, prices are expected to rise by +2.3%, resulting in a +0.7pp increase in inflation, given an average of 30% import intensity in consumption. Consumption goods represent 21% of UK imports. Looking at the consumer basket of goods and services in 
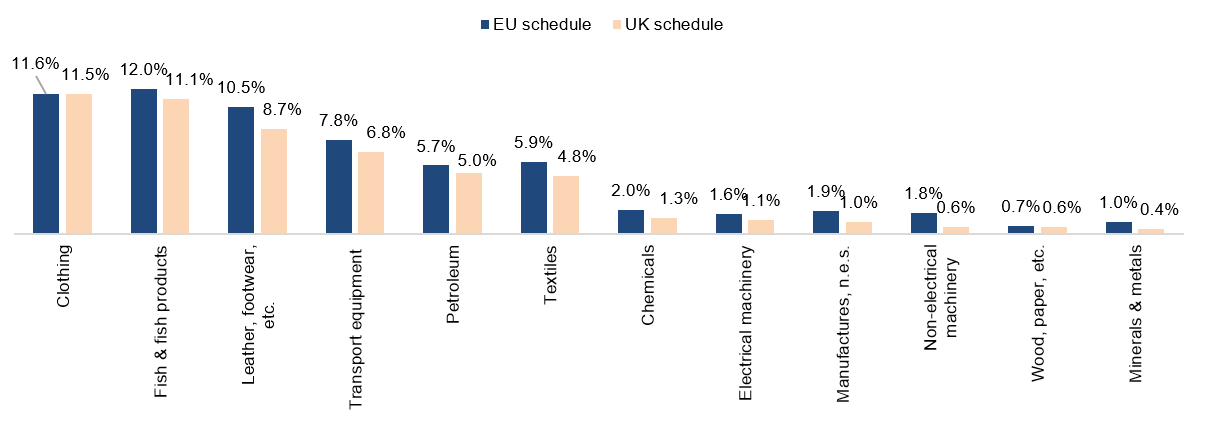
the UK, we can see that goods with a high import intensity associated to them (above 30%) will have their trade-weighted average MFN-tariff drop by close to -2pp. In contrast, those with a low import intensity (below 30%) will see their trade-weighted average MFN-tariff drop by only -1.2pp. Under a Hard Brexit hypothesis, imported consumption goods prices would surge by +13.0%, and inflation would jump by a daunting +4pp.

Figure 3 – Changes in import prices under both Brexit scenarios (Hard v. Soft)
Sources: Euler Hermes, Allianz Research
Figure 4 – Export volume and real effective exchange rate changes, between 2016 and 2019, by country
Sources: Euler Hermes, Allianz Research
For intermediate goods, the expected price increase will be higher: +2.5% under our trade and currency assumptions - and +10.2% for a Hard Brexit – indenting corporate margins further. The UK is indeed highly dependent on foreign value added for its domestic production, notably that which is to be exported: 52% of imported goods into the UK are intermediate goods (including primary goods), while more than 15% of the value-added in UK gross exports is of foreign origin. Keeping import prices in check involves halving import tariffs (the average import tariff is expected to fall from 2.4% to 1.1%) and increasing the duty-free share of intermediate goods imported from MFN countries by +33pp to 73% (see Figure 5).  The UK’s trade hub model entails an increase of +0.8pp in export price growth from an increase of +1.0pp in import price growth, which dents price competitiveness abroad further.

Figure 5 – Duty-free shares in total imports from MFN-countries
Sources: WTO, Euler Hermes, Allianz Research
For the UK, labor costs and productivity matter more. We calculate that a +1pp increase in labor productivity growth increases export volume growth by +1.1pp (ceteris paribus). The UK’s trade choices may miss the elephant in the room. Research  confirms the positive correlation between the level of trade with a country and that of FDI flows coming into the country, as well as between the latter and productivity. Productivity is also at risk as Brexit has already affected immigration into the UK (-13% between 2016-19, with -68% for immigration from the EU countries) and should continue to do so over the coming years. Decreasing immigration could mean a shortage of skills and higher labor costs. Keeping UK companies’ competitiveness would require an ambitious immigration policy to avoid wage increases above +3% y/y as was the case in 2019. Over the past few years, the UK has suffered from a lack of competitiveness compared to peers in terms of labor costs (see Figure 6). During this time, UK companies have taken a hit on their margins in order to keep prices under control and remain competitive abroad. Their margins have lost -2pp of the value added since end of 2015 (against -0.9% for the EU-27) and the Covid-19 crisis is expected to cut them further by -5.0pp in 2020, which gives companies very little leeway in the future to absorb increases in input costs.

Figure 6 – Unit labor costs (y/y, %)
Figure 5 – Duty-free shares in total imports from MFN-countries
Sources: National sources, Euler Hermes, Allianz Research
Ana Boata
Head of Macroeconomic Research
Anita Poulou
Research Assistant