EXECUTIVE SUMMARY

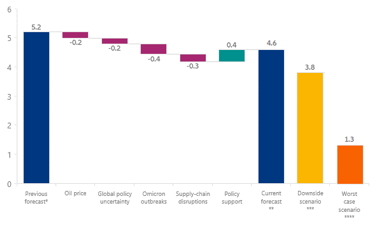
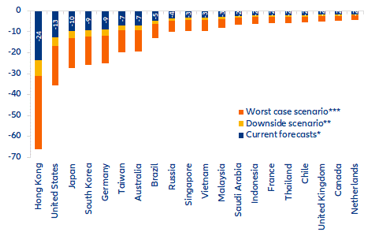
  • With provinces accounting for nearly a quarter of GDP under partial or full lockdown, the cost of China’s zero-Covid policy is climbing. We expect that omicron outbreaks in Q1 and April will have cost -0.4pp of GDP growth in 2022. While the PBOC should implement one more cut in the policy rate in Q2 2022, and additional public investment of c.3% of GDP is planned for the year, policy support will not be enough to cushion the blow to domestic demand. As a result, we cut our forecast for GDP growth to +4.6% in 2022, down from +4.9% expected a month ago. In a downside scenario where the Shanghai lockdown lasts for two months, and other large cities are also affected, China’s 2022 GDP growth would slow to +3.8%. In a worst-case scenario where the Q1 2020 shock is repeated, China would grow by only +1.3% this year. On top of the domestic sanitary situation, further downside risks could arise from a worsening of US-China tensions.
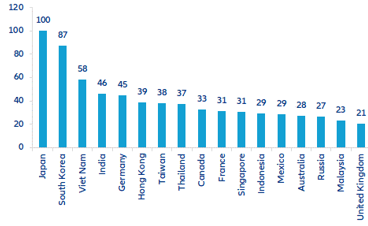
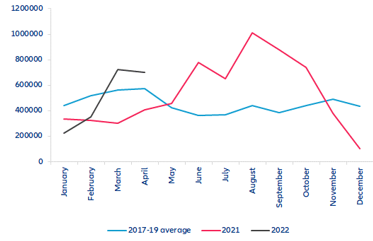
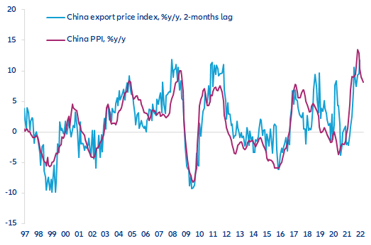
  • What does this mean for the rest of the world? A contraction in global trade in volume in Q2 2022 is now highly likely, as seen during summer 2021 and as suggested by our proxy for global demand-inventories mismatch. Slower Chinese demand implies an export shortfall amounting to USD140bn for the rest of the world. On the supply side, a sudden stop in China’s industrial activity would pose risks to global output, especially in the electronics and automotive sectors. In addition, congestion in Chinese ports suggests that global shipping delays are likely to remain elevated throughout 2022, though they will remain below the highs seen in 2021. Continued supply-chain disruptions will create further inflationary pressure globally: We estimate that current domestic bottlenecks in China is likely to lead to 0.2pp rises in the y/y inflation rates in the US and Eurozone in Q3, all else equal.
  • What does this mean for markets? We expect Chinese and EM assets to remain under pressure for the rest of 2022. Stringent anti-Covid measures and the risk of further US-China tensions, which has been exacerbated after the invasion of Ukraine, will keep weighing on market sentiment. Factoring together the outlook on Chinese assets, their interlinkage with global markets and foreign companies’ dependence on Chinese demand, we believe that EM equity markets could revisit 2022 lows. However, ongoing headwinds being successfully managed could lead to a positive 2023 for emerging market risky assets as a combination of relatively cheap valuations and renewed tailwinds could positively surprise markets.

The cost of China’s zero-Covid policy is climbing and policy support will not be enough to cushion the blow.

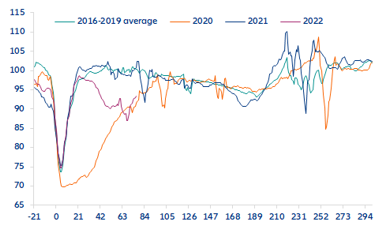
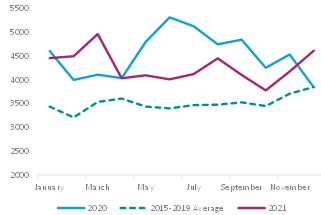
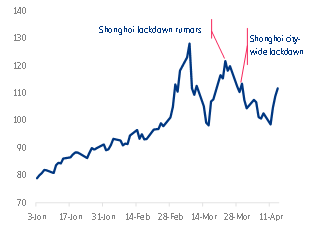
China is facing the worst outbreaks of Covid-19 since the first quarter of 2020. As authorities continue to follow a zero-Covid policy, provinces summing up to nearly 25% of national GDP have been under partial or full lockdown in March-April. This compares with 18% during the worst week of 2021 (in August) and 63% during the worst 20 days of 2020 (over January-February). The impact on mobility is visible: National mobility has dropped by -10% y/y in the first half of April – though this is roughly half the size of the shock observed in February-March 2020. High-frequency data (see Figure 1) show traffic congestion was down by -1.6% y/y on average in Q1 2022, -6.8% in March and -10% in the first half of April. Assuming a return-to-normal from May, Q2 2022 mobility would drop by -1.7% y/y, compared to the -17.7% drop seen in Q1 2020 (-21.3% in February-March 2020) and -3.7% in August 2021.

Figure 1: China traffic congestion index * (100 = Chinese New Year)

Figure 1: China traffic congestion index * (100 = Chinese New Year)
* population-weighted average of 100 cities
Sources: Refinitiv, Allianz Research
In this context, we are revising our 2022 GDP growth forecast for China to +4.6%, down from +4.9% expected a month ago, and +5.2% expected in January (see Figure 2). Activity data released this week show a resilient headline Q1 2022 GDP (at +4.8% y/y from +4.0% in Q1 2021) but mask the fact that March was much weaker than January-February, with a clear omicron-related shock on consumption (retail sales contracted by -3.5% y/y in March, after +6.7% in the first two months of the year). For the rest of 2022, in our new central scenario, we assume that the lockdown in Shanghai will last for a month and that mobility at the national level will return to a range more in line with pre-pandemic conditions in May. This would imply that omicron outbreaks year-to-date will have cost 0.4pp of GDP growth in 2022. Our estimate is aligned with recent academic research , which finds that the city of Shanghai being under a full-scale lockdown for a month will knock 2.7% of China’s aggregate income – an impact of -0.2pp on yearly growth. In a downside scenario where the Shanghai lockdown lasts for two months, and other large cities are also affected, China’s 2022 GDP growth would slow to +3.8%. In a worst-case scenario where the Q1 2020 shock is repeated, China would grow by only +1.3% this year.

Figure 2: 2022 China GDP growth forecast (%)
* Before Ukraine war and omicron outbreaks in China
** Mobility returns to normal in May (one-month lockdown in Shanghai)
*** Two-month lockdown in Shanghai and additional large cities
**** Repeat of Q1 2020 shock
Source: Allianz Research

Further policy support will only partly compensate for the shock to domestic demand. After a year of tightening, the policy mix quickly reversed to easing mode from Q4 2021. Since the beginning of this year, both fiscal and monetary policies have been relaxed, with tax cuts, larger public spending, a more dovish stance on the property market and policy rate cuts. Such policy support has resulted in a recovery in the credit impulse (see Figure 3), which remains in negative territory as of March but is clearly on a rising trend. The most recent move is the PBOC announcing a cut to the reserve requirement ratio (RRR) for all banks by 25bp (with an additional 25bp cut for selective smaller banks), effective from 25 April.

Going forward, we continue to expect one more cut in the policy rate (-10bp to the one-year MLF rate) in Q2 2022. In line with the comprehensive guidelines released by the PBOC on 18 April, we expect the central bank will increase liquidity provision and enable a continued recovery of credit growth throughout the year, in part by relaxing macroprudential measures related to the real estate sector and local government financing vehicles. Lending programs targeted to specific sectors or types of companies (e.g. SMEs, high-technology, transportation sector, etc.) will also be stepped up. Further rate cuts are not to be ruled out in H2, especially if the economic situation deteriorates more than currently anticipated. The PBOC is wary of the risk of inflationary pressures, but they remain limited for now and are unlikely to become an obstacle against further monetary easing, with core inflation likely to remain low, given the weak private consumption expected in 2022. On the fiscal side, along with tax and fee cuts for companies, additional public investment of c.3% of GDP is planned in 2022. It is most likely to be front-loaded in Q2 to at least partly compensate for the Covid-19 shock to domestic demand, and leave room for additional stimulus in H2 if needed.

Figure 3: China credit impulse and breakdown

Figure 3: China credit impulse and breakdown
Sources: National sources, Allianz Research
The larger-than-expected omicron-shock is exacerbating the growth mix of the Chinese economy, where private consumption and real estate investment lag and manufacturing and infrastructure investment are tailwinds, a story that we had expected for long . Our revisions to China’s 2022 economic outlook thus concern not only headline GDP growth but also the breakdown (see Figure 4). The growth contribution from private consumption is expected at just 1.6pp in 2022, compared with 3.7pp in 2021 and 3.1pp on average in the 2010s. Investment is likely to contribute by 1.3pp (compared with 3.3pp on average in the 2010s), pressured by a real estate sector that remains weak. Government consumption should contribute to GDP growth by 1.6pp in 2022, up from 1.4pp in 2021 and on average in the 2010s. Finally, while before the pandemic they tended to constitute a weight on overall growth (-0.2pp contribution in the 2010s), net exports are expected to contribute positively again in 2022 (0.2pp after 1.7pp in 2021 and 0.6pp in 2020), as both exports and imports should grow at a slower pace this year. That said, risks to China’s exports performance is on the downside, as US-China tensions never really disappeared. President Biden’s administration could decide on potential import quotas on Chinese products, in a politically sensitive context in both countries (US mid-term election and 20th Party Congress in China in November) and as the invasion of Ukraine could fuel fresh decoupling momentum.

Figure 4: China GDP growth and contribution breakdown
Sources: Allianz Research

What does this mean for the rest of the world?

A contraction in global trade in volume is likely in Q2 2022, as seen in summer 2021 and as suggested by our proxy for global demand-inventories mismatch. In our 2021 global trade report , we had estimated that 75% of the Q3 2021 contraction in global trade volume was explained by production shortfalls (supply issues), with the rest coming from logistic bottlenecks. The Chinese economic slowdown pressures global trade through the demand, supply and logistics channels. While we still expect global trade in volume to grow by +4.0% in 2022 (vs. +6.0% expected before the invasion of Ukraine), risks are clearly on the downside and depend on the sanitary situation in China.

Looking at the demand channel, a slower Chinese economy will create an exports shortfall of USD140bn for the rest of the world. This comes on top of the USD480bn exports to Russia and Eurozone lost as a result of the invasion of Ukraine . The exports shortfall could rise to USD185bn if our downside scenario materializes, and even USD345bn in the worst-case scenario. In absolute USD terms, Hong Kong, the US, Japan, South Korea and Germany would lose out the most (see Figure 5).

Figure 5: Export shortfalls by country (USD bn), depending on China economic scenario

Figure 5: Export shortfalls by country (USD bn), depending on China economic scenario
* Mobility returns to normal in May (one-month lockdown in Shanghai)
** Two-month lockdown in Shanghai and additional large cities
*** Repeat of Q1 2020 shock
Sources: Allianz Research
Given China’s important position in global value chains, a sudden stop in local industrial activity would pose risks to global output, especially in the electronics and automotive sectors. Overall, it is estimated that USD1.3trn worth of Chinese inputs are used in the rest of the world (or 1% of world excl. China output), with Japan, South Korea, Vietnam, India and Germany the most exposed. The industrial specialties in the Chinese provinces currently affected by lockdowns, along with company reports, suggest that the electronics and automotive sectors could be among the most affected. The manufacturing of semiconductors and chips do not seem to be interrupted at this stage, but firms positioned in the segment of assembly and final-good production are slowing down.

Figure 6: Amount of Chinese inputs used in respective economies’ output (USD bn)
Sources: OECD, Allianz Research
In addition, delays in global shipping are likely to remain elevated throughout 2022. Lockdowns in China are not only affecting the provinces or cities concerned, but are also creating logistical bottlenecks domestically (e.g. due to stringent controls over trucks going across provinces). This means that congestion in major ports is also visible, even though they remain operational, thanks to the closed-loop system in which workers do not have contact with the general public. The volume of container vessels anchored outside Chinese ports has been above normal in March and April 2022 (see Figure 7), with the average monthly surplus amounting to 2.7% of annual throughput. This compares with 3.7% on average in H2 2021, when global supply-chain bottlenecks were most acute. As such, the historical relationship between Chinese port congestion and global suppliers’ delivery times suggests that the latter should remain elevated throughout 2022, but below the 2021 peaks.

Figure 7: Total volume of container vessels anchored outside Chinese ports (TEU)
Sources: Refinitiv, Allianz Research
This new shock to global supply chains could be the cause for further global inflationary pressures. Using the suppliers’ delivery time index of China’s manufacturing PMI as a proxy for domestic supply-chain bottlenecks, we find that a -1pp decline in the index (as observed in March) implies a +1.1pp increase in producer prices growth two months later. In turn, producer prices tend to lead China’s export prices by two months (with a +0.9pp sensitivity) – see Figure 8 – and the latter tend to show a correlation with inflation in the rest of the world. Already in H2 2021, we had found that production shortfalls in China accounted for about one-third of elevated inflation in the US and the Eurozone (1.5pp to 2.0pp). The global demand context is not entirely the same this time round, but the ongoing logistics shock from China already amounts to three-quarters of that in H2 2021.

Figure 8: China producer prices and export prices
Sources: National Bureau of Statistics of China, Allianz Research
When it comes to global commodity prices, China is not in the driving seat but it does have the potential to drive sharp swings. Chinese growth in the 2000s was associated with what at that time was qualified as a commodity ‘super-cycle’. Last year, we underlined that we do not believe that all the necessary factors are currently at play in order to have a new super-cycle . The current tensions on commodity markets and the consequent high prices are due to strong demand and a supply-demand mismatch exacerbated by the ongoing war in Ukraine. In fact, as recently as April 2020, China was able to massively import in order to boost reserves (see Figure 9) at a bargain price without reviving commodity markets, which were still in oversupply and worried about the global economy (e.g. Brent prices averaged about 43 USD/barrel).

Figure 9: Chinese monthly crude oil imports (millions of tons)
Figure 8: China producer prices and export prices
Sources: Refinitiv, Allianz Research
However, China’s role is far from being completely benign. Indeed, in recent weeks, markets have been worried about a repeat of 2020 as a major shock in China would send a shockwave to global commodity markets. In late March, as soon as the first rumors of a lockdown of Shanghai broke out and were denied by local authorities, oil markets reacted quite sharply (-2.9% on 24 March, see Figure 10). The city-wide lockdown announced at the end of March also led to another sharp correction (-5.4% on 31 March). Looking ahead, oil markets should brace for more volatility as the situation unfolds in China.

Figure 10: Crude oil prices (Brent USD/barrel)
Sources: Refinitiv, Allianz Research
What does this mean for capital markets?

The risk to Chinese assets is more geopolitical than cyclical. In our view, the downside risks of ongoing lockdowns alone would have limited further impact on Chinese assets, although this varies depending on asset classes and sectors. We think that the main risk as of today is not weaker growth expectations or asset price overvaluation but rather geopolitical tensions with the US (especially when considering the position of a Western investor).

From a domestic perspective, in theory the zero-Covid policy could have disruptive effects on the functioning of production chains. However, this does not seem to be the main worry for markets for now, as evidenced by the sectoral performances. While telecommunications and technology were among the sectors least affected by the severe selloff between December 2019 and March 2020, they have now become the most hit by the drop in Chinese equities experienced since mid-February 2022. Furthermore, the starting points are different, as valuations have corrected significantly since February 2021, with markets having discounted most of the expected impact of renewed lockdowns (see Figure 11).

Figure 11: Equity markets performance since 2020 (100 = Dec 2019)
Sources: Refinitiv, MSCI, Allianz Research
With markets having already priced in most of the zero-Covid policy impact, geopolitical tensions remain a key source of market volatility. China remains a country that has only recently taken measures to open its capital markets to foreign investors, with still a long way to go. Should geopolitical tensions (especially with the US) escalate, it could lead to a market reversal with foreign investors being forced out of their positions. It is precisely the openness and increasing interconnectedness of the global financial system that could make the situation deteriorate. In other words, even though the main transmission channel from China to the rest of the world remains through its current account and global supply chains, the increasing presence of foreign capital in the country could also play a key role as an additional source of volatility.

Since countries tend to trade with their neighbors, most East Asian countries particularly vulnerable to both the economic slowdown and the possibility of broad-based emerging market outflows. In this regard, Brazil, India, South Korea, and Taiwan remain most at risk of a Chinese slowdown and further market correction (Figure 12).

Figure 12: Equity market betas vs Chinese equities (15y rolling)
Sources: Refinitiv, Allianz Research
However, developed markets are not fully insulated from a Chinese slowdown or escalating geopolitical tensions. Looking at the share of revenues that developed market companies derive from China, an average of 15% of revenues seem to be at stake. However, the revenue exposure is varied across sectors, with the materials, industrials and technology sectors being most exposed to China. This high revenue exposure in certain sectors is particularly worrisome for US equities as last year’s equity rally was led by a handful of technology stocks, which could come under pressure should the Chinese economy or the US-China relationship deteriorate (Figure 13).

Figure 13: Share of sales revenue derived in China* (%), 2021.
* Only companies that reported 2021 revenues for China separately are considered. This accounts for between 15-30% of the companies listed (either by number of companies or market capitalization), although the share is higher for the sectors selected.
Sources: Refinitiv, Allianz Research.
Moving to the fixed income spectrum, the immediate impact of a slowing Chinese economy will be seen in the continued monetary policy divergence between the US and China as the former tightens to contain inflation and the latter loosens to support its economy. Looking at sovereign debt, the US-China yield differential is about to turn positive (this has already happened for some maturities), which may reduce the appetite for Chinese government bonds and potentially lead to further capital outflows. Such a scenario could rapidly lead to depreciating pressures building up on the CNY. Looking at corporate debt, especially CNY-denominated, monetary easing by the PBOC has managed to reduce pressures on indebted companies4 balance sheets by helping some overcome the effects of lockdowns and supply-chain bottlenecks. Offshore credit market problems are still tied to real estate developers and the limited room for maneuver that Chinese authorities have to support companies’ debt-servicing capacity.

Looking at the intrinsic differences between onshore and offshore Chinese equity markets, the current divergence reflects the risks derived from US-China tensions. Taking the onshore market as an example, a market that is still restricted to foreign investors, the market correction has been much milder than that of those trading in Hong Kong, and even milder than those trading in the US. Reemphasizing the current focus on geopolitical relations, the worst movements in Chinese asset classes did not take place after the Ukraine invasion or the new wave of lockdowns but after the SEC announced a more exhaustive audit of Chinese stocks – a movement that quickly reversed after Chinese authorities made a pledge for transparency. All in all, the current price movements across asset classes show that the economic slowdown has already been priced in while the rise in geopolitical tensions is still on the horizon and will keep markets on alert in 2022 (Figure 14).

On a positive note, if both US and Chinese policymakers successfully manage the current economic and geopolitical crises, emerging market assets could see a positive 2023.

Figure 14: Performance of selected Chinese equity indexes vs. S&P 500 (31/12/2020 = 100)
Sources: Refinitiv, Allianz Research