What to watch:
In focus – Earnings recession to catch up with corporates
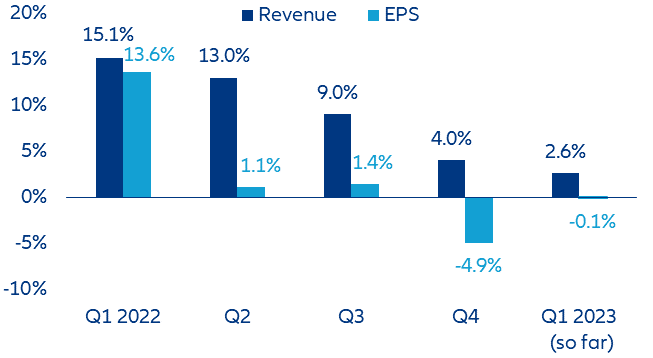
- All that glitters is not gold in the Q1 earnings season, with US earnings already in recession. While 62% of companies in Europe and the US beat estimates during the Q1 season, this is mainly because of already lowered analyst estimates. Even if revenue rose year-over-year (+2.6%), profit growth remained in negative territory (-0.1% y/y) and a corporate recession is looming, at least for the US, where earnings have already fallen back for two consecutive quarters. APAC firms went in the opposite direction: China’s reopening raised hopes for a stellar recovery in the first quarter but 59% of Chinese companies disappointed the market.
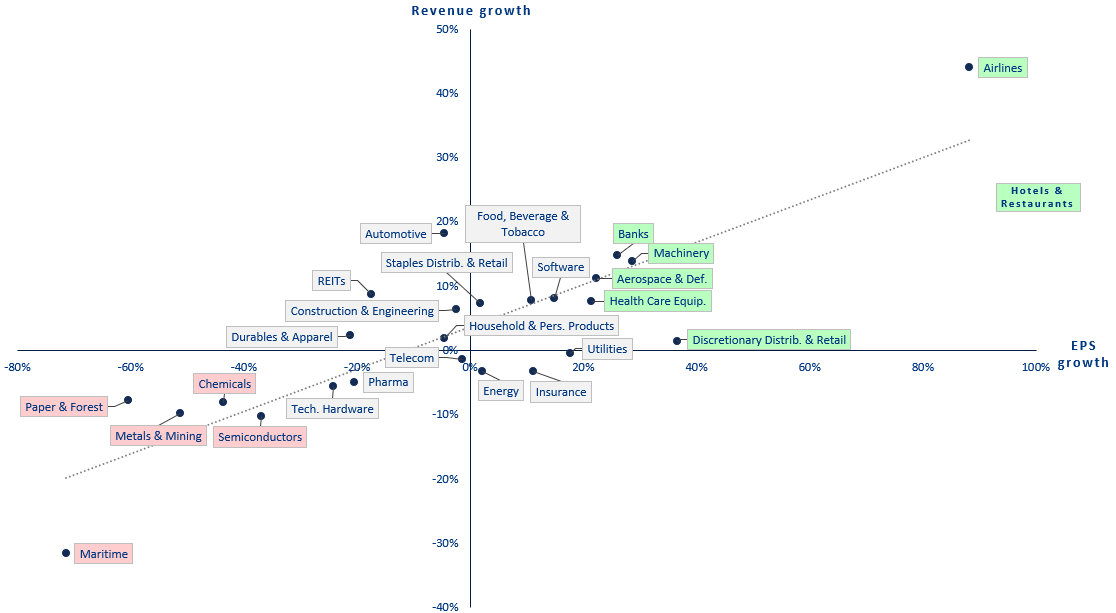
- In line with expectations, two sectors in particular had a big quarterly setback as earnings continue to normalize: maritime and energy. Overall, 10 out of 26 sectors managed to increase both sales and EPS, while eight sectors reported y/y declines. Basic materials posted the worst performance. European firms are losing two tailwinds as pricing power fades and the USD weakens. An earnings recession is on the cards for the back-to-school season in fall as the transmission of monetary policy tightening will be fully effective. Nevertheless, as anticipated in Q4, with pricing power fading for many sectors, companies worldwide had been preparing for a gloomy 2023 via staff rightsizing, operational restructuring plans and other cost-saving measures. This together with significantly lower energy bills should prevent a sharp earnings recession in the coming months.
- Corporate guidance has deteriorated for full-year 2023 as only 25% of firms made upward revisions over the season. However, a mild recovery is expected from the beginning of next year. For Q1 2024, nine of the 11 sectors in the S&P 500 are expected to achieve profit growth: communication services (+20.5% y/y), utilities (+17.7%) and industrials (+15.9%) are expected to post the highest EPS growth rates.
OPEC+ – divided and cornered in its own inflationary trap
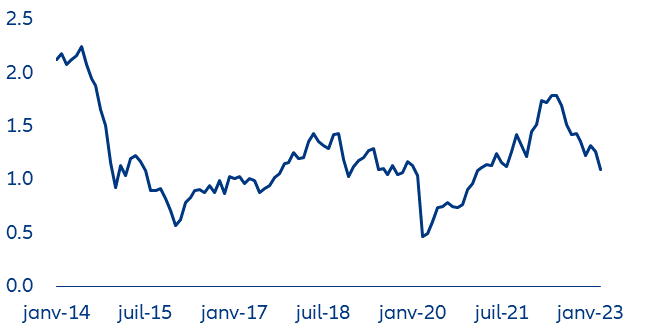
The next OPEC+ meeting on 04 June could reveal the first cracks in the group’s common stance on oil output, which would increase upside risks on oil prices. Fears of recession and a higher-than-expected availability of oil have pushed prices down more than 25% from last year’s highs. As most OPEC+ countries are net importers of manufactured goods, they are now cornered into their own inflationary trap. Today, a barrel of oil can buy half as much as it could in March 2022, when it could buy almost two times the core goods and services of the OECD Consumer price index (CPI).
Figure 1: Real Oil Price Index
Sources: Refinitiv, Allianz Research. Note: The index is obtained by dividing the price of a barrel of crude Brent by the core CPI for the OECD.
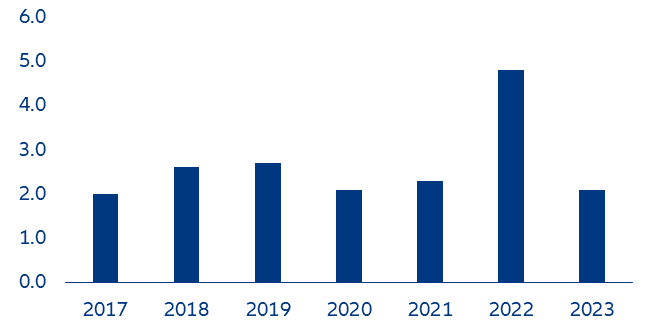
With oil prices down and declining revenues, some countries are heading towards a rough period, especially Russia. Oil revenues have become a lifeline amid heavy sanctions and a deteriorating macroeconomic environment. The country has also been under-complying with its quotas in an attempt to keep revenues afloat (Figure 2). With Asia being flooded by cheap Russian oil,
Saudi Arabia has also started implementing discounts to preserve its market share in the region.
Figure 2: Russian energy revenues for the four first months of the year (RUB trn)
Sources: Russian finance ministry, Allianz Research
BRICS summit – China holds the keys to turning the group into a powerhouse
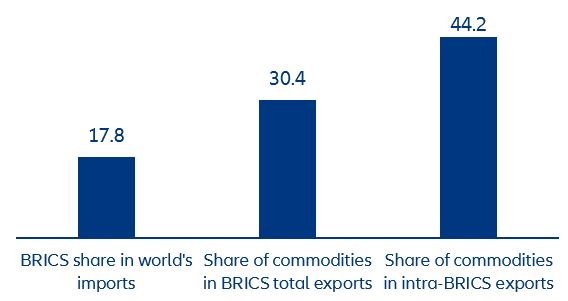
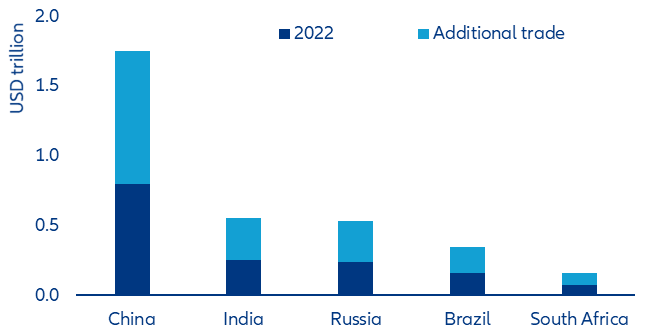
A greater trade integration between the BRICS countries could raise the group’s relevance far beyond its economic or financial weight. BRICS countries account for around 42% of the world’s population, 26% of global GDP and 18% of international demand (see Figure 3). The inventor of the BRICS acronym, Jim O'Neill, recently asked what the relevance of the club would be without one of the world’s largest economies. In 2022, China represented 53% of intra-BRICS trade. Although the “BRIS” (i.e., BRICS ex-China) share of the world’s GDP is just 8% and its share of global demand is only 7%, China’s trade balance with the BRIS was negative by USD4bn in 2022, which underlines how the champion of global trade in manufactured goods benefits from trading with its BRIS partners. Indeed, the BRIS group is particularly strong in the export of raw and semi-finished materials, which are crucial for China’s manufacturing sector.
Figure 3: BRICS share of global imports and respective commodities shares (% of total)
Sources: ITC Trade Map, Allianz Research calculations
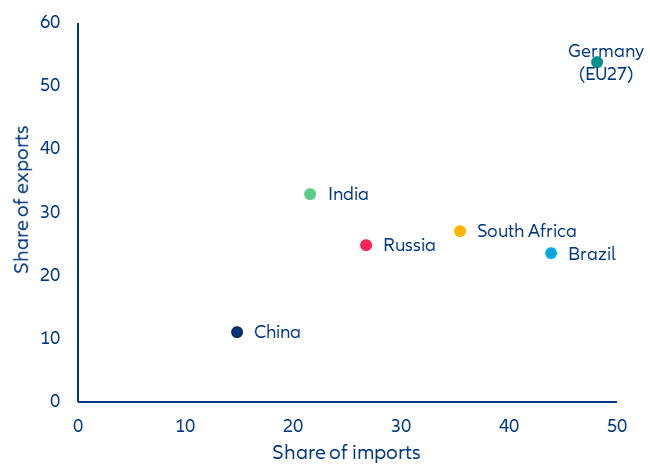
China holds the keys to take the group to the forefront of the global economy. Looking at BRICS countries’ trade complementarity, i.e. the average of the share of partner(s) in a country’s imports and exports compared to the rest of the world, it is clear that the BRIS subgroup relies far more on China for exports and imports than vice versa (Figure 4). Comparing BRICS’ trade complementarity with that of
Germany vis-à-vis the EU (i.e. a free-trade zone), the gap is telling. China opening up its markets to BRIS countries, increasing investment flows within the group and reducing overall tariff and non-tariff trade barriers are necessary steps if the group means business.
Figure 4: Trade complementarity in intra-BRICS trade and that of Germany with the EU27
Sources: ITC Trade Map, Allianz Research
Boosting trade complementarity within the group could have an estimated USD1.8trn effect, roughly doubling its current value. Enabling factors include the creation of a free-trade zone; the integration of value chains that go beyond commodity trade; the improvement of infrastructure; the willingness to forego some fiscal revenues from tariff barriers to allow the expansion of value-added sectors and, by extension, of the economy as a whole, and the adoption, as recently postulated, of a common currency. While this is a long-term simulation, it is nevertheless an important phenomenon to monitor, given existing supply dependencies.
Figure 5: Potential trade gains across BRICS countries from enhanced trade conditions
Sources: ITC Trade Map, Allianz Research
The EU Critical Raw Materials Act – recycling to the rescue?
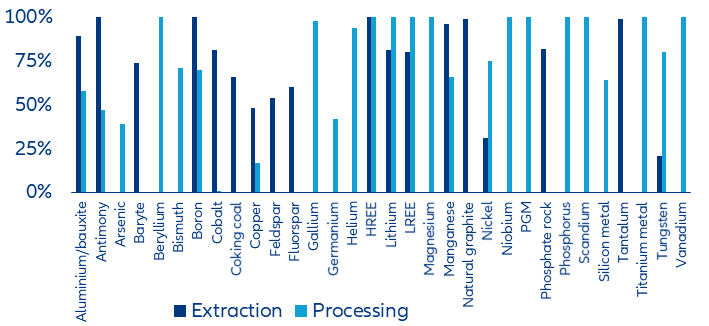
Can the EU Critical Raw Materials Act close the supply gap? Raw materials such as aluminum, lithium, cobalt, rare earth elements and nickel are essential for building renewable energy technologies and accelerating the green and digital transitions. As a result, the International Energy Agency estimates that the demand for cobalt, natural graphite or lithium for clean energy and other sectors will increase about six times in the next 10 years. However, at the extraction stage, the EU is completely import-dependent for three critical materials and more than 80% import-dependent for 10 materials. At the processing stage, EU economies are entirely dependent on imports for 11 materials and 80% dependent for three more. To secure supply for 51 materials, the EU Critical Raw Materials Act aims at strengthening all stages of the European value chain and to diversify EU imports to reduce strategic dependencies (Figure 6). However, scaling up domestic capacities in extraction or processing will require the general availability of respective mineral deposits, massive investments, time, technological upscaling and social consensus on the exploitation of the environment at home.
Figure 6: EU import-dependencies by raw material at extraction and processing stage (in %)
Sources: EU Commission (2023), Allianz Research. Note: HREE are heavy rare earth elements, LREE are light rare earth elements, PGM are platinum group metals.
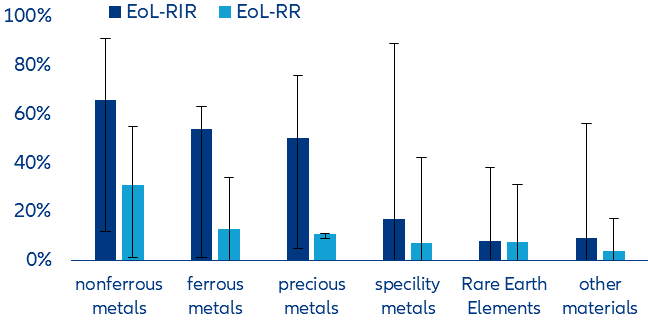
In this context, increasing recycling rates could come to the rescue – but there’s a long way to go. As of today, only 16 of the EU-defined critical or strategic raw materials are recycled to a certain extent, while 35 raw materials are currently hardly or not at all included in the circular economy. In the EU, the recycling rate at the end of the product life cycle (EoL-RR, i.e. the proportion of a material in the waste stream that is actually recycled) averages between 0% to 55%, depending on the critical raw material. However, there are big differences between raw materials. Some specialty metals such as rare earths, lithium or arsenic are hardly ever recycled, on average less than 7% (Figure 7). Other materials such as graphite, phosphorus or helium are currently recycled at 4% on average. Rare earth elements also show rather low recycling rates: around 7% on average. Individual materials such as barite, coal or silicon metals are almost impossible to recycle because they change their chemical form during processing or, as for coal, are consumed. But other material groups such as nonferrous metals, ferrous metals or precious metals show higher possible input and recycling rates. Still, input rates may differ tremendously from recycling rates. While input rates are on average 66% for nonferrous metals, the EoL-RR is only 31%. For precious metals, the input rate is 50% while the recycling rate is only 11%. Therefore, to meet future demand and comply with the targets set out by the EU, recycling capacities within the EU must be significantly improved. And to enable higher recycling rates, recycling options for critical raw materials must also already be considered in the manufacture of products.
Figure 7: EoL– recycling rates vs. recycling input rates (average, min. and max., in %)
Sources: EU, Bio Intelligence, UNEP, Allianz Research. Note: light blue bars are the average recycling input rates, while the dark blue bars are the average end-of-life recycling rates. Crossbars depict minimum and maximum recycling rates.
To achieve the defined targets, extensive investments in research and innovation are necessary. In the EU, central implementation tools are missing and not provided by the Critical Raw Materials Act. So far, it has not been sufficiently coordinated with other legislation and regulations such as taxonomy, chemicals law, the Ecodesign Regulation or supply-chain due diligence. Moreover, an urgently needed financing offensive for the development and expansion of domestic projects on the extraction, processing and particularly recycling stages of critical raw materials is still missing. Especially with a view on recycling, extensive investments in research and innovation are necessary to develop processes and technologies to be able to achieve the defined recycling targets and support increasing demand for critical materials in the future.
In focus – Earnings recession to eventually catch up with corporates
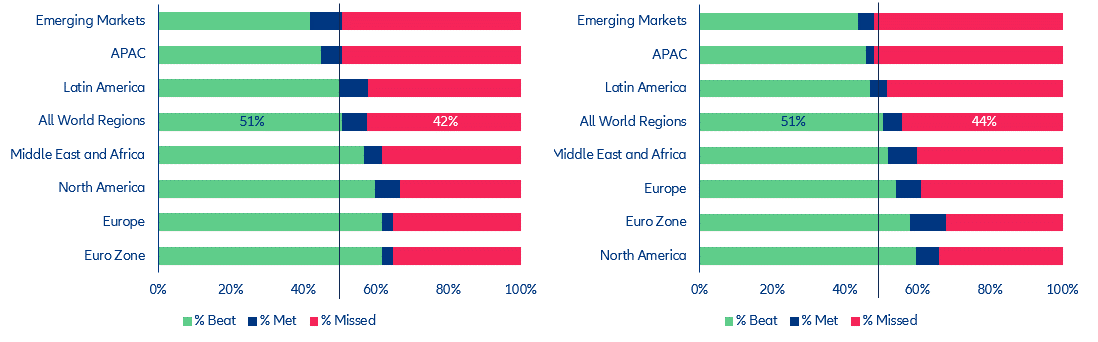
All that glitters is not gold in the Q1 earnings season. Even if 51% of companies at the global level outperformed expectations, this is not as impressive as it might seem considering that analysts had sharply cut their estimates just before the season started, a practice that has become quite common in recent quarters. This was particularly true in the US, where 62% of firms beat forecasts for EPS growth as the consensus moved from growth of +1.4% y/y in January to a drop of -5.1% y/y in April. In addition, 76.9% of S&P 500 companies exceeded EPS expectations, compared to the long-term average of 66.3% in terms of upside surprises for the index. However, APAC firms went in the opposite direction: China’s reopening raised hopes for a stellar recovery in the first quarter but 59% of Chinese companies disappointed the market.
Business deterioration persists and will continue to be a concern over the next two quarters. Even if revenue is still rising year-over-year (+2.6%), profit growth remains in negative territory (-0.1% y/y) and a corporate recession is looming, at least for the US, where earnings have already fallen back for two consecutive quarters (Q4: -2.8% and Q1: -0.7%). As anticipated in Q4, with pricing power fading for many sectors, companies worldwide had been preparing for a gloomy 2023 via staff rightsizing, operational restructuring plans and other cost-saving measures, which, together with a significantly warmer-than-expected winter that lowered energy bills led earnings to fall this quarter less than initially expected. Still, as costs cannot be reduced infinitely, profits are set to fall in coming quarters.
Figure 8: Q1-2023 revenue (left) and earnings (right) expectations by region
Sources: : Refinitiv (as of 22 May 2023), Allianz Research
Figure 9: Global quarterly revenue and EPS growth rates
Sources: Refinitiv (as of 22 May 2023), Allianz Research. Note: Average figures for Q1 2023: 90% of companies listed on the stock market have published their results to date.
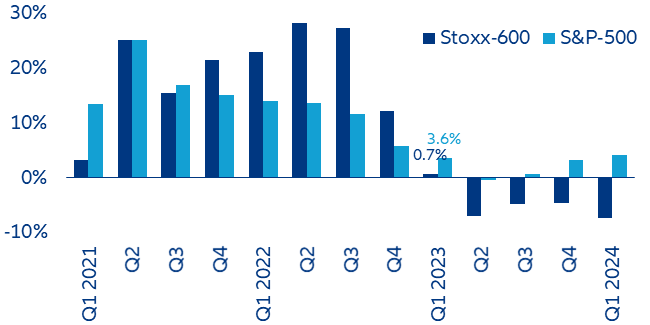
European firms are losing two revenue tailwinds as pricing power fades and the US dollar weakens. Indeed, Q1 sales growth of the S&P 500 (+3.6% y/y) is projected to outpace that of the Stoxx 600 (+0.7% y/y), something not seen since Q3 2021. This suggests that the sales boom experienced by European companies throughout 2022 has come to an end and further revenue declines are on the cards through the rest of the year (Figure 10).
Figure 10: Quarterly revenue growth rates (y/y%) for companies in the S&P 500 (US) and the Stoxx 600 (Europe)
Sources: Refinitiv Eikon (as of 23 May 2023), Allianz Research.
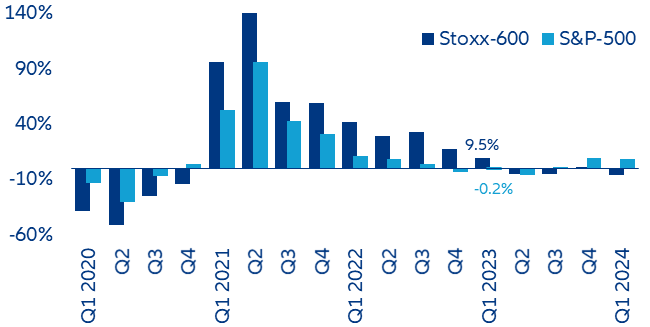
However, earnings growth in Europe seems likely to hold up a bit longer, at least for another quarter (Figure 11). With a surprise factor of 12.1% (above the 5.8% long-term average), EPS for companies in the Stoxx 600 grew by +9.5% y/y in Q1. While this is significantly lower than the prior quarter (Q4: +17.9% y/y), it is better than the decline already observed at S&P 500 companies (-0.2% y/y). Besides the fact that monetary policy cycles are not completely synchronized between
the US and Europe, the continued contraction in the S&P 500 is also explained by its lower diversification. As seen in Figure 12, EPS for technology and healthcare sectors fell -9.4% y/y and -14.8% y/y, respectively, in Q1, and these sectors together represent 53% of the index’s market capitalization. Although the sectors with the worst performance this quarter are utilities (-22.4% y/y) and materials (-22.2% y/y), these represent only 5% of the S&P 500’s market capitalization.
Figure 11: Earnings growth rates (y/y%) for companies in the S&P 500 (US) and the Stoxx 600 (Europe)
Sources: Refinitiv Eikon (as of 23 May 2023), Allianz Research.
Figure 12: Historical, current and future earnings growth rates for sectors in the S&P 500
Sources: Refinitiv Eikon (as of 19 May 2023), Allianz Research.
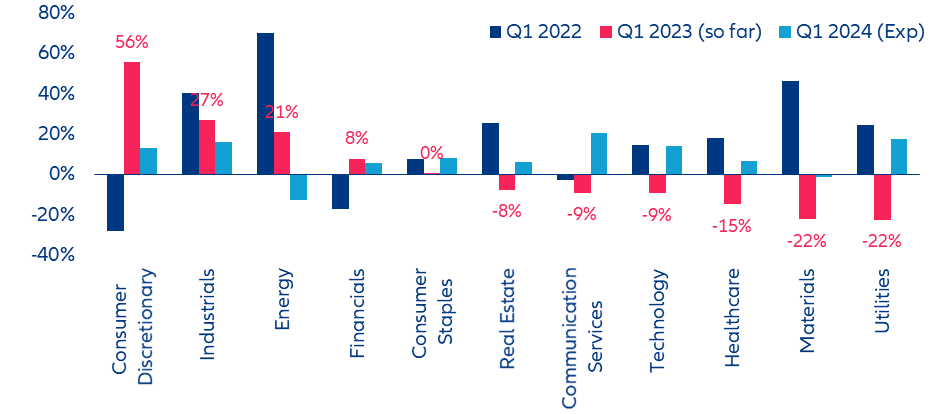
Outperformers from 2022 continued to see earnings normalization in Q1 2023, while companies in the basic materials continued to suffer. Although it was anticipated, two sectors in particular had a big quarterly setback: maritime and energy. After both enjoyed an exceptional boom justified by rising oil prices and never-before-seen shipping freight rates for much of 2022, sales in these sectors fell by –31.6% and -3.3% y/y in Q1, respectively. However, this merely suggests that business is returning to normal.
Figure 13: Revenue and EPS growth (y/y %) in Q1 2023 by sector, all listed companies worldwide
Sources: Refinitiv Eikon (as of 22 May 2023), Allianz Research.
Basic materials, which includes metals & mining, chemicals and paper, continued to struggle as EPS slumped by -46.9% y/y in Q1, after falling by -45.9% y/y in Q4 2022. China’s reopening is not providing the much-needed and expected recovery for the metals & mining sector in particular. With the notable exception of metals linked to the energy transition, prices of most metals are not likely to recover in the short-term, given the looming recession.
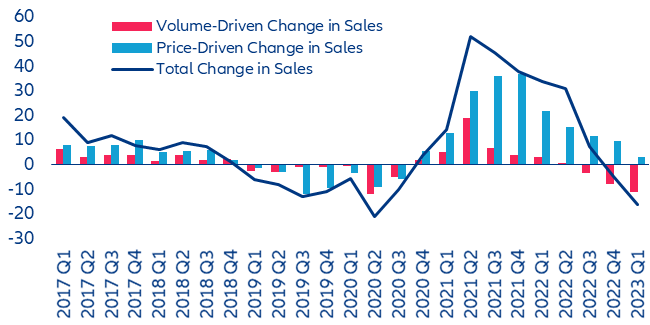
Sales fell for the second consecutive quarter in the chemicals sector (-4.7% y/y in Q4 and -16.0% y/y in Q1), particularly in base chemicals (-29.2% y/y) and in intermediate & derivative chemicals (-18% y/y). In contrast, plastic, resins & fiber managed to grew by +5.5% y/y. The deterioration is largely explained by continuously waning demand, which has negatively impacted both price and sales volumes. Even if natural gas prices have receded from recent highs, they continue to be responsible for the deterioration of margins in the sector. As a result, the sector’s earnings prospects for 2023 remain at risk. We expect Europe's chemical firms to continue lagging behind US peers.
Figure 14: Changes in sales in the global chemicals sector
Sources: Bloomberg, Allianz Research
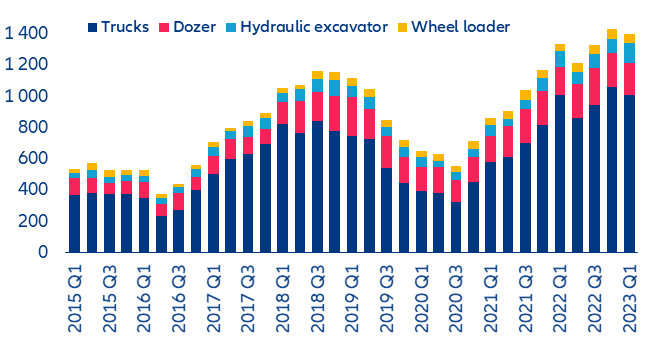
On the bright side, the positive trend continued for companies manufacturing capital goods as cash-rich corporates continued to spend on capex. However, production is likely to peak in Q2 as new orders fade. Revenues for the aerospace & defense industry grew by +11.2% y/y, mainly boosted by commercial aircrafts and parts & engines segments, for which new orders already exceed pre-pandemic levels as airlines need to replace old fleets and expand capacity. Pent-up demand after a period of supply-driven production shortages is also boosting activity and strengthening backlogs for companies in the machinery industry, which recorded y/y growth of +13.9% for sales and +28.6% for earnings. Agricultural and mining equipment have also seen more unit deliveries recently. Although 2023 capex plans are on hold for the mining sector, capex increased by +15% on average in the last two years, with a notable increase in demand for trucks, which explains the current business activity.
Figure 15: Global shipments of machinery equipment used in the mining sector
Sources: Bloomberg, Allianz Research
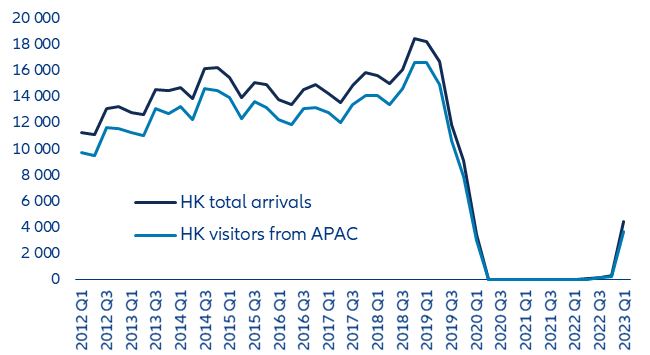
Consumer services (mostly hotels & restaurants) and airlines led growth for a second quarter in a row as travel spending remains strong despite higher airfares and lodging tariffs. Bumping booking numbers for the coming summer season are giving these sectors a boost. According to IATA, global passenger traffic showed strong growth in March, with industry-wide revenue passenger kilometers (RPKs) increasing by +52.4% y/y and reaching 88% of March 2019 levels. On top of steady demand, airlines also continue to benefit from the drop in jet-fuel prices, which have declined by around -26% YTD and represent near 30% of airlines’ operating costs. While domestic and international tourism in China has finally resumed, it is still well below pre-pandemic levels (Figure 16). For example, in Q1, the numbers of visitors to Hong Kong was 22% the level observed in Q1 2019 (16.6mn).
Figure 16: Hong Kong inbound visitors per quarter (thousands)
Sources: Bloomberg, Hong Kong Tourism Board, Allianz Research
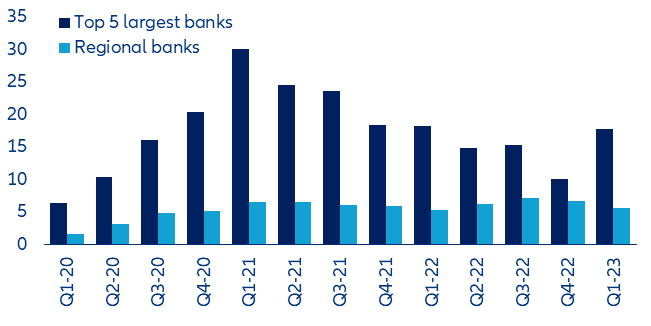
Despite the recent US banking turmoil, the sector outperformed the market as banks gained more from borrowers paying more interest. EPS jumped by +26% y/y worldwide (+54.2% in Europe and +49.4% in the US). Nevertheless, the flight-to-safety phenomenon evidenced by the USD230bn of deposits being withdrawn from small and regional banks at the end of March pushed their EPS down by -16.5% q/q, while earnings for the five largest US banks soared by +74.4% q/q.
Figure 17: Quarterly EPS (USD) of US banks
Sources: Refinitiv Eikon, Allianz Research
Looking ahead, overall business performance is not likely to improve in the very short-term, though 2024 is expected to be a recovery year. Of the American companies that decided to update their guidance over the season, 47% revised downward their expectations for the full-year 2023, 28% kept them neutral and only 25% made upward revisions. However, nine of the 11 sectors represented in the S&P 500 are expected to achieve profit growth in Q1 2024: communication services (+20.5% y/y), utilities (+17.7%) and industrials (+15.9%) are set to post the highest EPS growth rates.
Authors
Ludovic Subran
Allianz Investment Management SE
Maria Latorre
Allianz Trade
Jasmin Gröschl
Allianz Investment Management SE
Luca Moneta
Allianz Trade
Ano Kuhanathan
Allianz Trade