European fragile SMEs

European SMEs: 7-15% at risk of insolvency in the next four years

01 September 2021

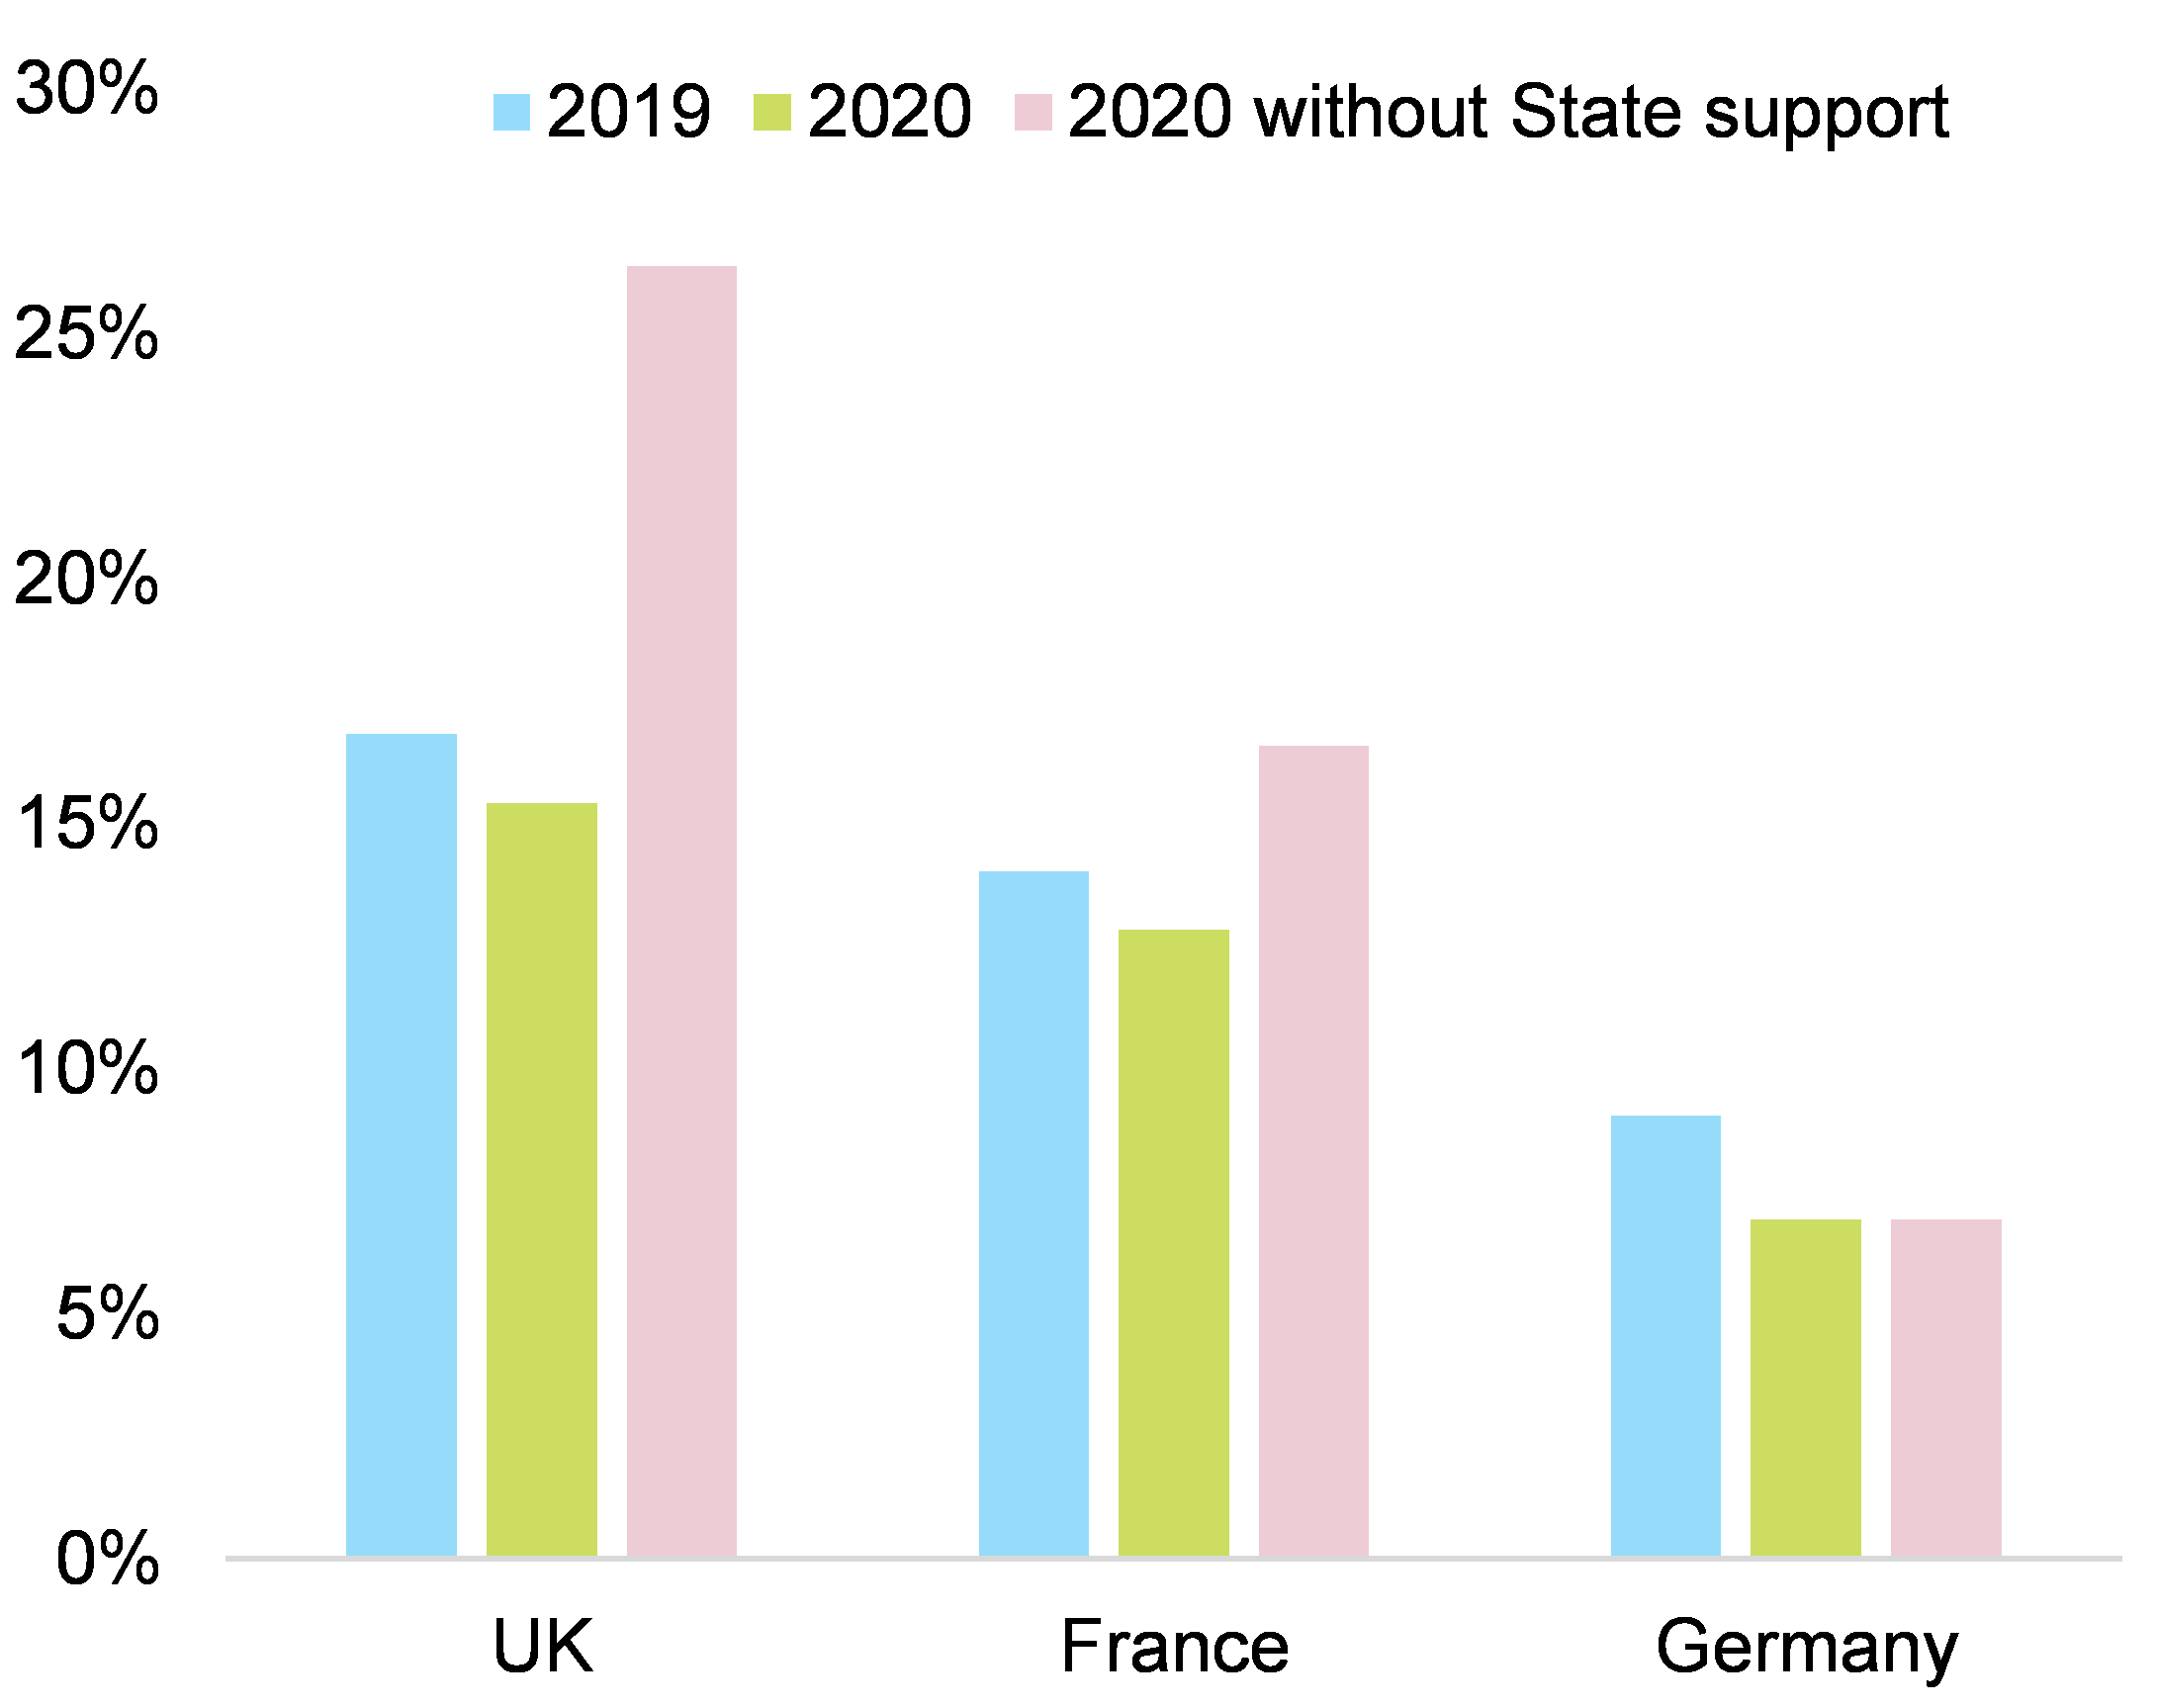
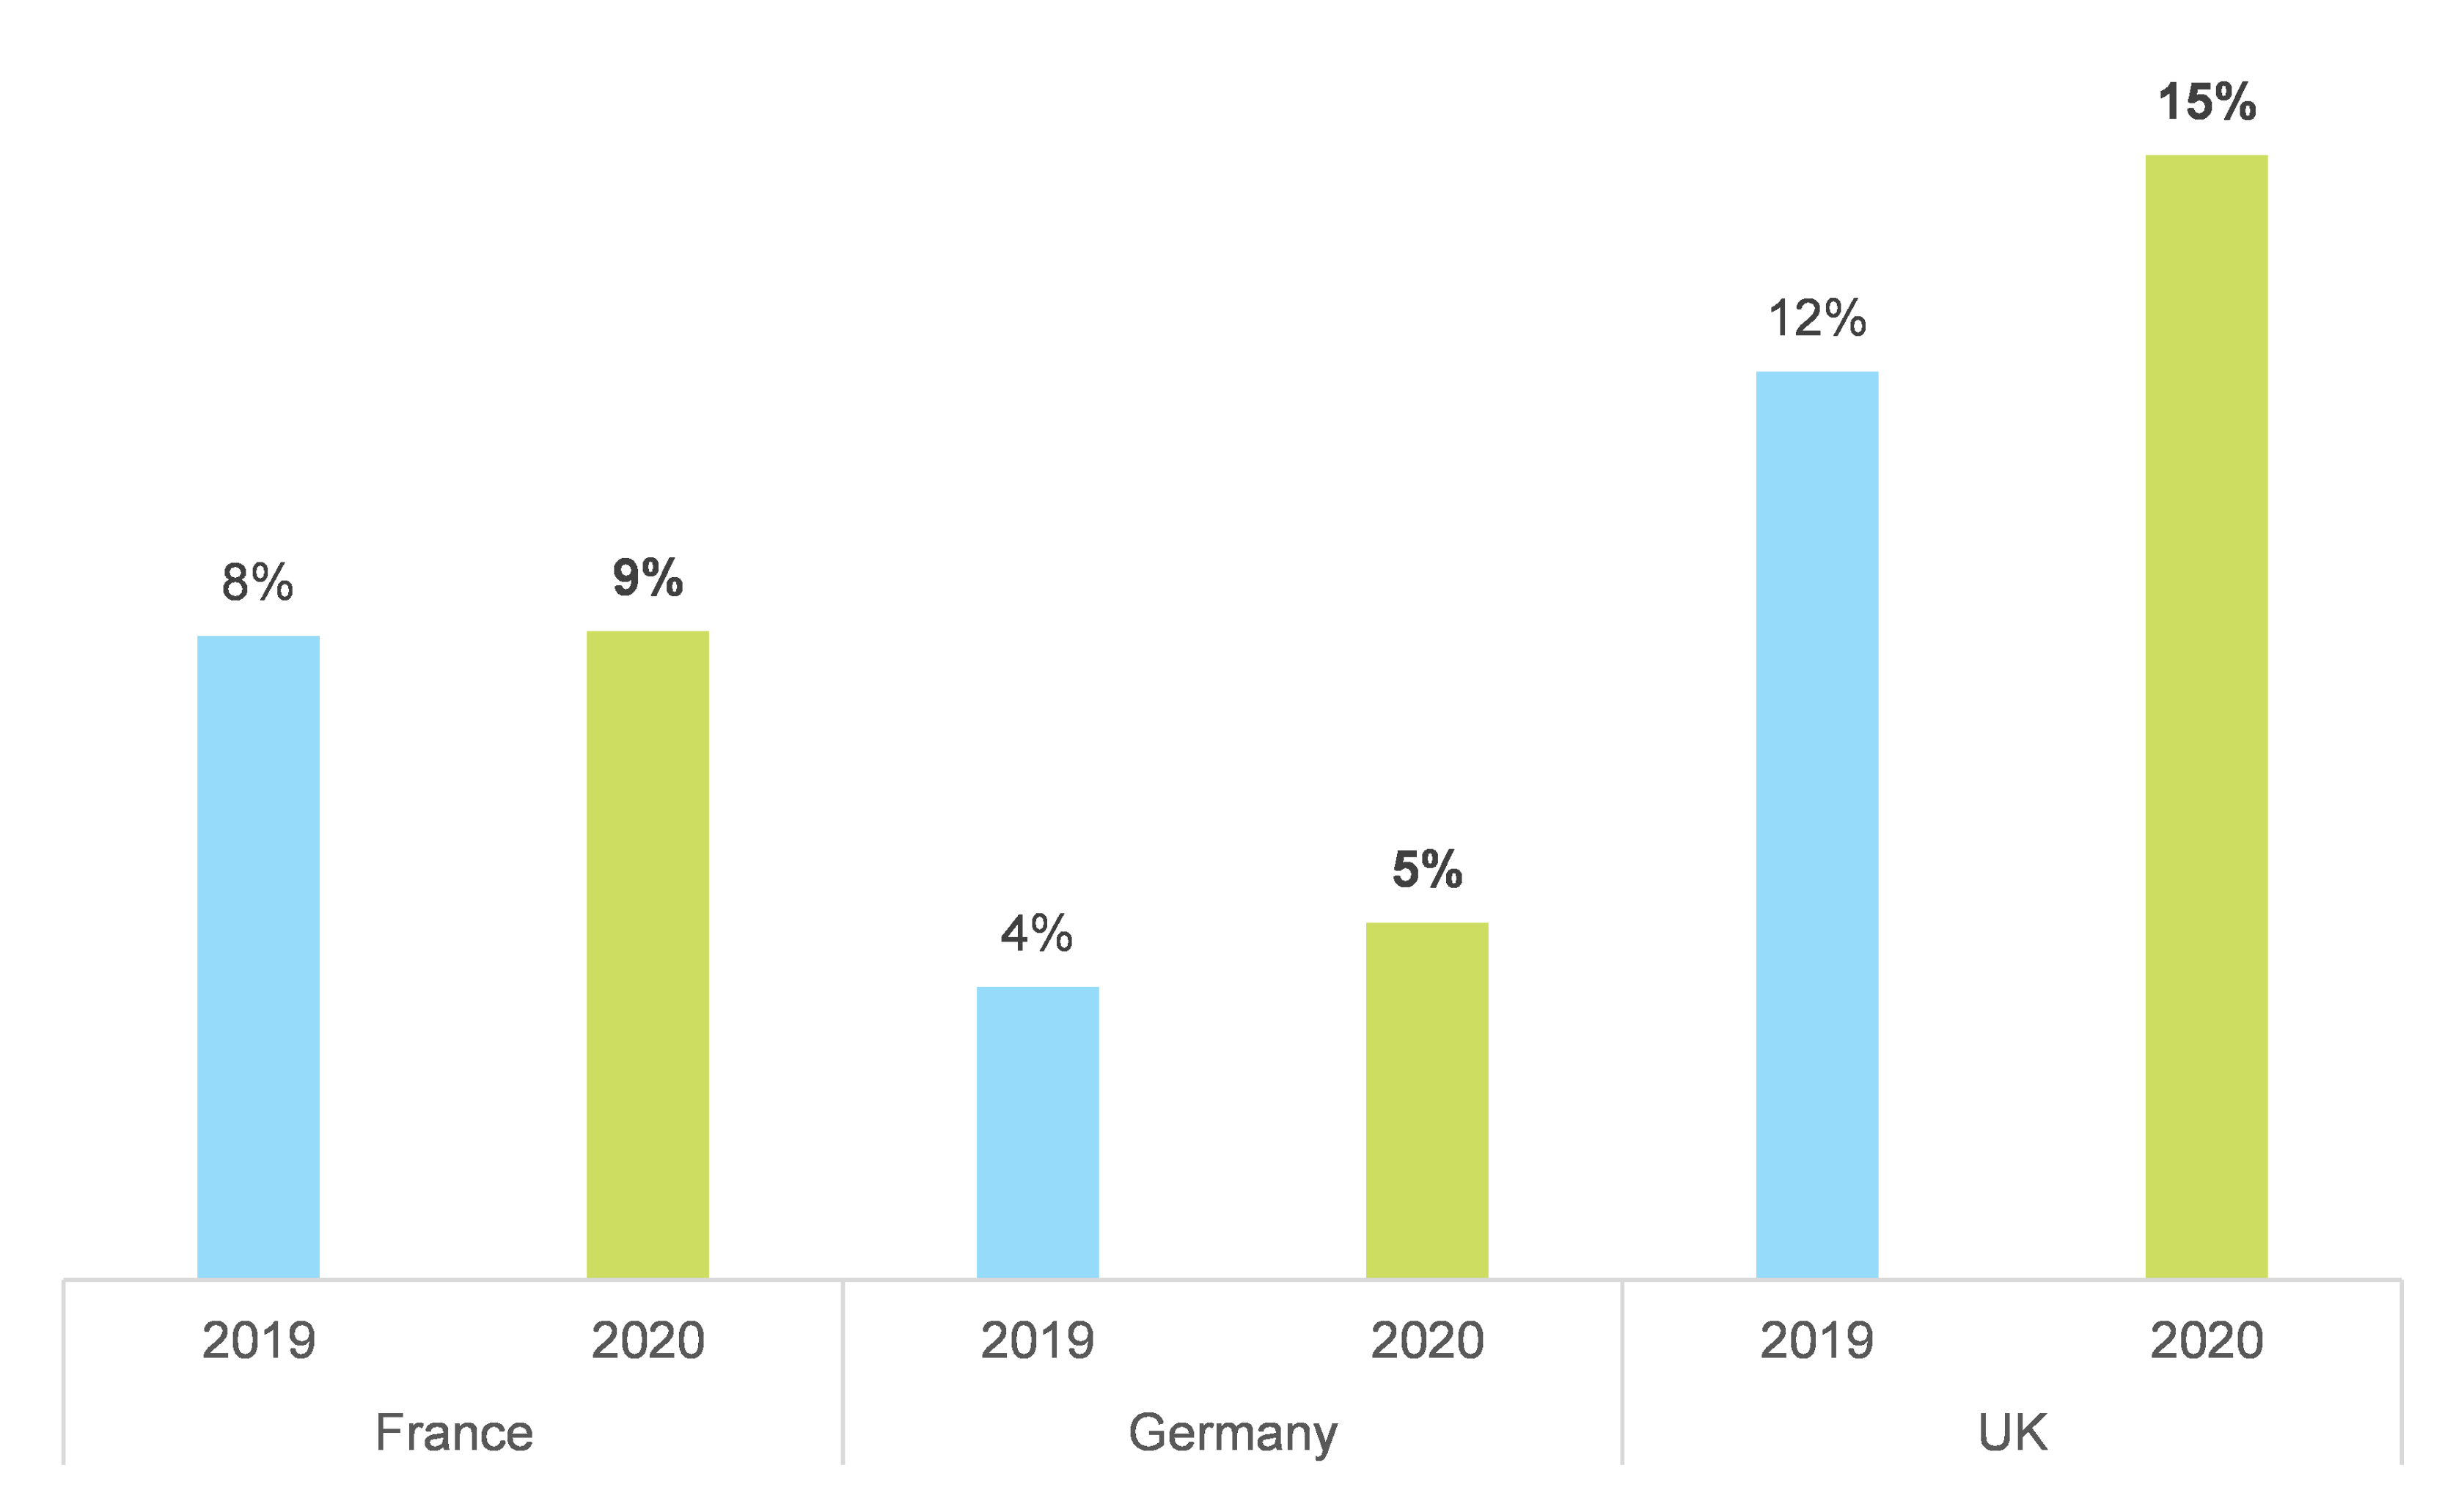
In 2020, state support softened the blow of the Covid-19 shock, reducing the number of fragile SMEs by more than 8,000 in Germany, France and the UK. Yet, we find that 7%, 13% and 15% of SMEs in the three countries are still at risk of insolvency in the next four years. Our past research has identified three leading indicators that can help detect corporate distress four years before a bankruptcy: profitability, capitalization and interest coverage. Applying these criteria to close to 525,000 SMEs, we find that 7% of total SMEs are at risk in Germany, 13% in France and 15% in the UK. This compares with 9%, 14% and 17%, respectively, in 2019, which means that state support not only cushioned the blow of Covid-19 but overcompensated for it, with direct subsidies (including partial unemployment schemes) and tax deferrals fully covering non-financial corporates’ losses in value added from 2020.

Without state support, the share of fragile SMEs would have been much higher in France and the UK, at 17% and 26% respectively (see Figure 1), as margins would have lost more than -5pp. Interestingly, in Germany, the share would have remained relatively stable despite a shock of close to -3pp for margins from peak to trough. This is because fragile SMEs in Germany have worse financial indicators (profitability, capitalization and interest coverage) compared to those in France and the UK. Hence, in the absence of state support, these fragile SMEs would have been more likely to transform into zombies and thus become insolvent faster.

Figure 1 – Share of fragile SMEs in 2020

Figure 1 – Share of fragile SMEs in 2020
Sources: Euler Hermes, Allianz Research
Which sectors are the ones to watch? Automotive, transport equipment, services, retail, construction and energy appear the most exposed. By looking at SMEs at the sector level, we see many discrepancies within countries and sectors in different countries. If we look at our three leading indicators in Germany for our entire sample, automotive suppliers, electronics and machinery and equipment had weaker metrics in 2020 than in 2019 on all three indicators. Automotive suppliers saw two out of the three indicators worsen as well in France and the UK, whereas manufacturers proved to be more resilient (see Figure 2).

Figure 2 - Leading indicators by sector and country, evolution in 2020
NB: in red when the indicators have deteriorated in 2020 vs. 2019, in green when the indicators have improved. Sources: Euler Hermes, Allianz Research
The top three sectors which account for the highest share of fragile SMEs in Germany are automotive suppliers, transport equipment and services, with automotive manufacturers not very far (see Figure 3). Electronics and paper are also sectors where the share of fragile SMEs is higher than the country average. In France, automotive suppliers, transport equipment and energy are on top of the list, mainly due to deteriorating profitability and capitalization. However, agrifood and services also account for a higher share of fragile SMEs compared to the country average. In the UK, it is mainly energy, automotive suppliers, construction and retail.

Figure 3 – Fragile SMEs by sector, % of total companies by sector
Sources: Euler Hermes, Allianz Research
As public support comes to an end, SME payment terms and Days Sales Outstanding will rise. Since mid-2020, we have frequently highlighted the trend of corporate cash-hoarding. In some countries, cash has increased more for large companies than SMEs (Germany), while for others the cash accumulation was higher for SMEs ( the UK, Italy, Spain). For France, the distribution was relatively balanced between large companies and SMEs. We pursue this exercise on our proprietary database by measuring SMEs’ ability to pay short-term obligations (i.e. those to be paid within one year) as a proxy for cash positions. We find that the average current ratios have increased in all three countries under consideration (see Figure 4). The average French SMEs are the ones that increased their cash positions the most.

Figure 4 – Average current ratios for SMEs in 2019 and 2020
Sources: Euler Hermes Allianz Research
Interestingly, in some countries such as France, it appears that all SMEs managed to get their hands on more cash. On the other side of the Rhine, SMEs with already strong positions managed to strengthen them further whereas weaker firms were cut off from access to cash: We see that the share of corporates with current ratios close to zero has increased (see Figure 5). Such a phenomenon could indicate that the unwinding of state support schemes could prove be quite challenging for French SMEs. However, in Germany, those SMEs that are cash-less have more to fear.

Figure 5 – Current ratio distributions among French and German firms in 2019 and 2020
Sources : Euler Hermes, Allianz Research
This stronger SME cash position is also confirmed by our analysis of Days Sales Outstanding (DSOs). Indeed, we find that SME DSOs have remained stable in Germany while they decreased in France and the UK (see Figure 6) in line with the cash positions.

Figure 6 – DSO, change in 2020, SMEs vs large corporates
Sources : Euler Hermes, Allianz Research
But there is some good news: While SMEs are more indebted after the Covid-19 crisis, public support helped improve their interest coverage ratios. In 2020, total non-financial corporate debt increased more in France (+14.3pp of GDP) compared to Germany (+5.0pp) and the UK (+6.3pp). At the same time, equity remained stable. For SMEs in particular it is interesting to look at debt-to-equity ratios to understand their vulnerability following the crisis. Looking at our proprietary data of financial statements, we find that SMEs’ debt-to-equity ratios have increased much more in France compared to the UK while they decreased slightly in Germany (see Figure 7). However, when looking closer at the distribution of debt-to-equity ratios for German SMEs, we see that the average decrease in debt-to-equity is mostly because in 2020 unlike 2019, there were very little SMEs with extremely high ratios. Actually, the median ratio slightly increased from 1.22 to 1.23.

Figure 7 – Average debt-to-equity ratios for SMEs in 2019 and 2020
Sources : Euler Hermes, Allianz Research

Despite the additional debt, SMEs were able to strengthen their interest coverage ratios (see Figure 8). On one side, the low interest rates on new loans played a significant role. In France for example, the interest rate on new loans of up to EUR1 million, a proxy of SME financing, has decreased by -40bp since the start of the crisis from already the lowest level within the Eurozone (1.3% in July 2021). This compares to -10bp in Germany to 1.9%. Furthermore, the resilience of profitability (see Figure 9) plays a significant role. Looking at direct subsidies (including partial unemployment schemes) and tax deferrals, state support covered fully the losses in value added of non-financial corporates from 2020. In addition, a majority of corporates have made significant efforts to keep cost pressures in check. Interestingly we note that some UK SMEs managed to reach EBITDA-margins levels that they could reach in 2019 (see Figure 10).

Figure 8 – Change in average debt and coverage for SMEs between 2019 and 2020

Figure 8 – Change in average debt and coverage for SMEs between 2019 and 2020
Sources: Euler Hermes, Allianz Research
Figure 9 – EBITDA-margin for SMEs in 2019 and 2020
Sources: Euler Hermes, Allianz Research
Figure 10 – EBITDA-margin distribution for SMEs in the UK in 2019 and 2020
Sources: Euler Hermes, Allianz Research