EXECUTIVE SUMMARY

In 2022, the record bear run across asset classes has eliminated any diversification benefits, leaving investors with no place to hide. Realized and expected monetary policy moves drove most of fixed income and equity performance. In 2023, fixed income should regain some attractiveness from a risk-adjusted perspective and may prove interesting in the current volatile environment. However, the next three to six months, the high macroeconomic uncertainty will continue to expose tactical investors to elevated short-term market volatility and possible short-term losses.

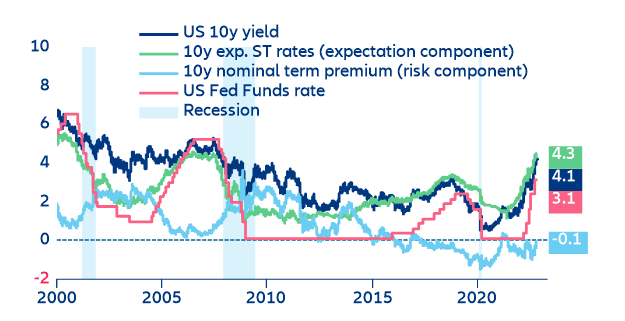
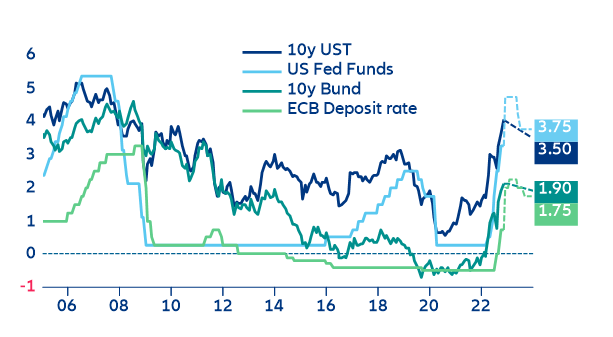
  • Monetary policy expectations are driving most of the sovereign yield curve. The historically timid but meaningful policy pivot penciled in our scenarios for H2 2023 should exert downside pressures on both ends of the sovereign curve, leading towards a “price positive” market readjustment. The risk component (the component more attached to fundamentals and mid- to long-term economic expectations) is having a close to negligible effect. In the second half of 2023, long-term yields should start falling towards our targeted 3.5% and 1.9% for the 10y UST and 10y Bund, respectively. Beyond 2023, yields should start stabilizing and fundamentals (the so-called risk component) should once again kick in, with yields slowly increasing towards 4-5% for the 10y UST and 2-3% for the 10y Bund in the mid- to long-run.
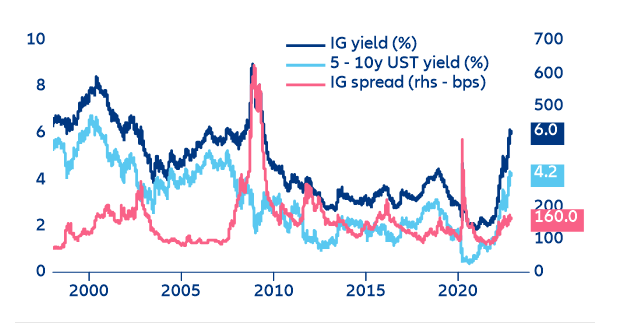
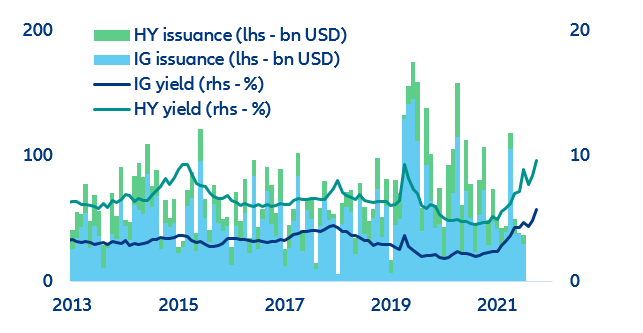
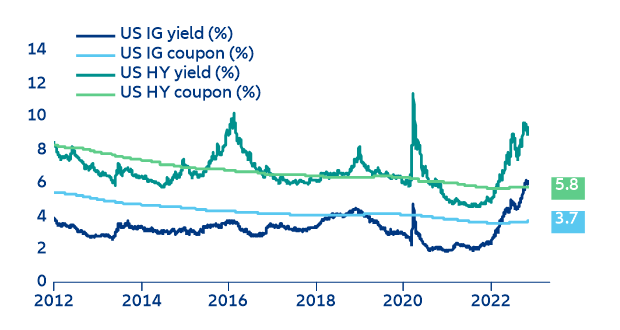
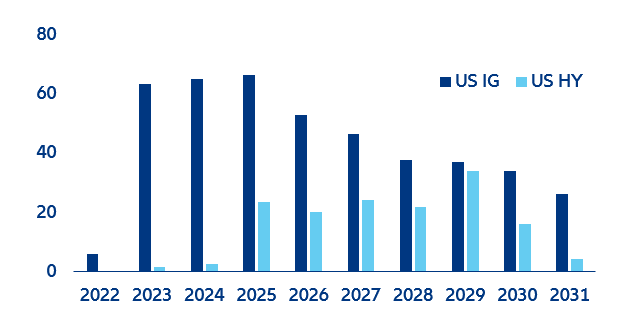
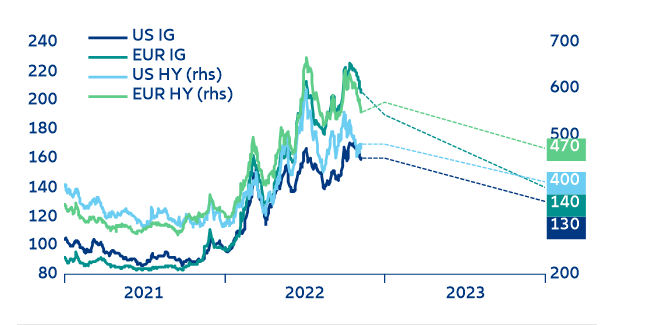
  • The current widening of corporate credit spreads has remained moderately muted — and to a certain extent inconsistent with the equity-market meltdown. Moving forward, we remain constructive on corporate credit, warranting a quality bias. The current price performance of corporate credit can be mostly attributed to the global pick-up in sovereign yields and implicitly to monetary policy changes. At the same time, the overall increase in corporate credit yields and subsequent increase in financing costs has led to a slowdown in primary markets, with corporates refraining from raising cash. This situation, however, should not pose a big risk for corporates moving forward as the bulk of financing needs will kick in only in 2024-2025. It would take around three to four years for broad credit markets to experience a notable increase in interest expenses, allowing quite some time for financial conditions to readjust. At the same time, decent fundamentals and overpriced fallen angels probabilities tend to further skew the range of possible outcomes positively. Numerically, we expect further compression in 2023, with both US and Eurozone investment grade spreads landing at levels close to 130-140bps. For high yield, after some pressure until Q1 2023, we expect spreads to compress towards 400-460bps in 2023.
  • Short-term risks in equities still outpace the upward potential vis-a-vis fixed income. The coincident behavior between equity valuations and the long end of the sovereign curve has triggered a sharp readjustment in fundamental valuations, correcting some accumulated long-term market imbalances, which may still prove insufficient to warrant a long repositioning. We forecast US and EUR equity markets to lock in an overall -15% correction in 2022. Nonetheless, in H2 2023, equity markets should regain some terrain on the back of abating inflation, renewed economic momentum and the expected policy pivot which should, in turn, lead to an upper-single-digit performance in 2023 and allow for some potential pick up vis-a-vis fixed income. However, and until H2 2023, equity markets do not really look as attractive as fixed income since their current vulnerability to changes in market sentiment make them extremely volatile.

2022, the year that diversification takes a break

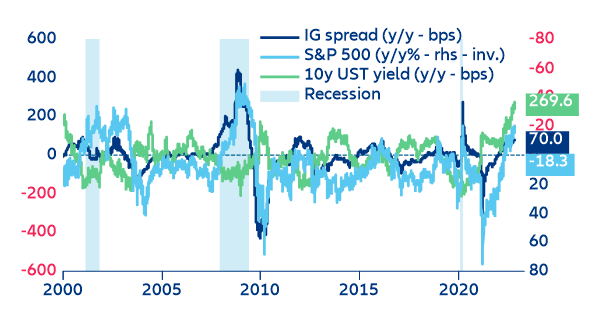
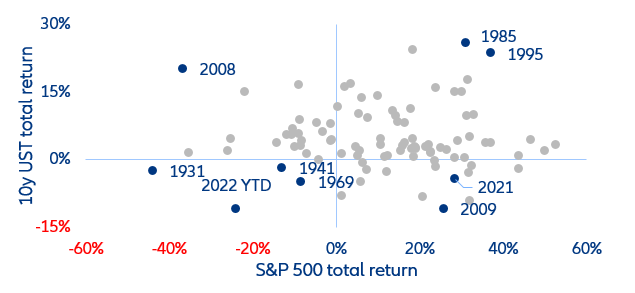
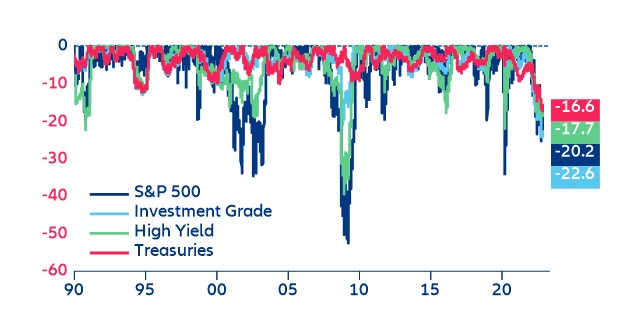
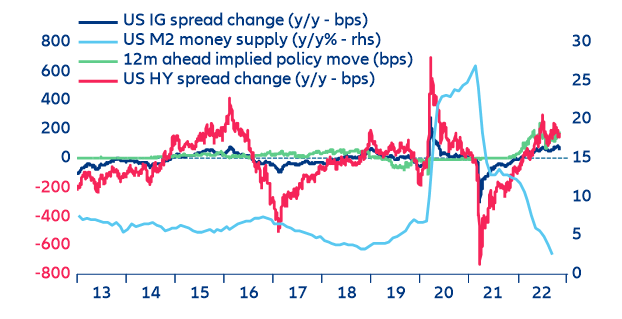
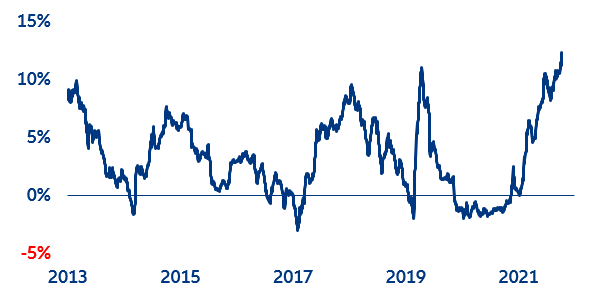
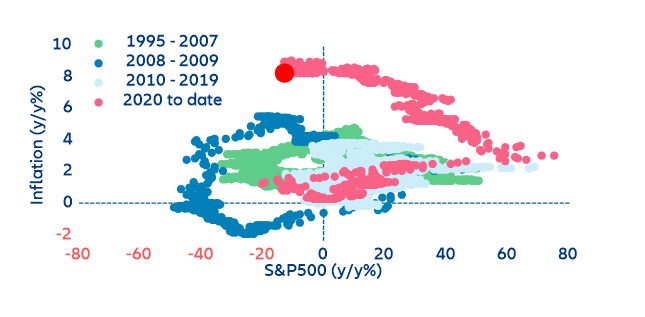
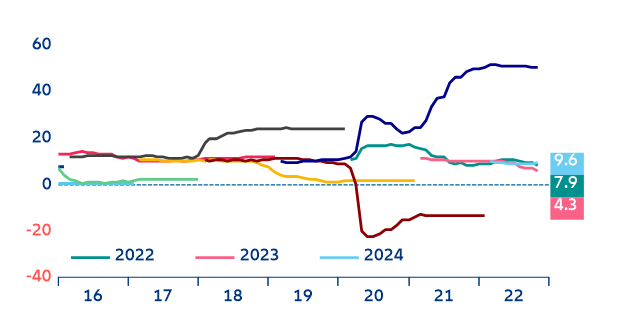
So far in 2022, the record bear run across asset classes has eliminated any diversification benefits, leaving investors with no place to hide. Since the beginning of 2022, market participants have faced an extreme and record-making market bear run, especially for fixed income. What makes this bear run unique is that there has been no place to hide as correlations across asset classes have broadly converged to one, effectively killing any ex-ante expected diversification benefits. While this is not the first time, we see this type of market behavior (which also occurred briefly during the 2013 “taper tantrum” and the pre-quantitative-easing Covid-19 phase), it is extremely rare that such market dislocations have lasted for more than a year. And they show no signs of easing as long as inflation fails to abate (Figure 1). The last time fixed income and equity performed so badly in unison for an extended period and across most regions was in 2008 (Figure 2)

Figure 1: US fixed income vs equities performance comparison (y/y in % and bps)

Figure 1: US fixed income vs equities performance comparison (y/y in % and bps)
Sources: Refinitiv Datastream, Allianz Research
Figure 2: US equities vs 10y government bond yearly total returns (%)
Sources: Refinitiv Datastream, Allianz Research. Note:  Charts for the Eurozone can be found in appendix.

Putting it into numbers, the negative performance across major asset classes has circled around -15% and -30%, with asset prices recursively crossing the bear market line (~ -20%). However, and unlike other market corrections, the isolated negative performance of corporate credit (i.e. credit spreads) has been relatively muted as most of the market correction has come from higher long-term rates rather than a structural increase in market-based corporate credit risk. Consequently, and as of today, it seems that markets are not yet fully committing to a complete economic meltdown, implying that most assets’ underlying value will not be challenged to the “default” limit. This hints that the current market correction will not result in a structural and broad-based wave of defaults. If this market presupposition is proven right, is now the right moment to enter fixed income and/or equities at current valuations (Figure 3).

Figure 3: 1y drawdown across US asset classes (%)

Figure 3: 1y drawdown across US asset classes (%)
Sources: Refinitiv Datastream, Allianz Research

Fixed income performance is currently driven by central banks

Throughout the history of capital markets, it has been extremely hard to pinpoint all the drivers behind market directionally. However, this time, markets are laser-focused on rising interest rates in a “stagflationary” environment. In the past, raising rates to slow economic growth and cool down inflation has been the norm. However, today’s inflationary push has been much higher, more sudden and stickier than anticipated, leading to a more aggressive market repositioning. Additionally, and unlike in the past, higher rates are not coming at a time when the economy is overheating but when the cost-push shock from energy prices requires central banks to raise rates to suppress demand more than would normally be necessary.  On top of that, the addition of a geopolitical crisis in Ukraine and the subsequent surge in energy prices has further set the stage for a deeper recession. Since “stagflationary” phases are not the historical norm, these factors put together have led to the breakdown of market diversification as sovereign and corporate risk correlations have rapidly converged towards one.

Markets are mostly focused on the inflation–growth–monetary policy (including market expectations) trifecta. In fact, looking at both risky and non-risky asset performance, we find that the current market volatility has been driven to a great extent by changes in monetary policy expectations (Figure 4), perhaps because this market metric tends to be a “close to” real-time representation of the expected path of inflation and growth dynamics.

Figure 4: US fixed income and equities vs monetary policy expectations (rebased to 100)

Figure 4: US fixed income and equities vs monetary policy expectations (rebased to 100)
Sources: Refinitiv Datastream, Allianz Research

Along with changes in central bank key rates, the stock and flow of monetary and fiscal support is also playing its part. The withdrawal of Quantitative Easing (QE) and even the beginning of Quantitative Tightening (QT) in certain regions continues to weigh on money circulation and asset pricing, thus adding some extenuating pressure on risk appetite and market plumbing. This effect contrasts with 2020, a period in which the monetary and fiscal bazooka managed to keep risk appetite and overall market performance afloat (Figure 5).

Figure 5: US corporate credit vs monetary policy expectations

Figure 5: US corporate credit vs monetary policy expectations
Sources: Refinitiv Datastream, Allianz Research

Despite not being the norm, the current situation is also not unusual. Increased sensitivity to changes in short-term rates tends accelerate within central bank hiking and cutting cycles. That is, when central banks take a step forward to tame inflation or to safeguard economic stability, moves in central bank key rates and QE/QT dominate market performance and directionality. Looking at the current determinants of the long-end of the sovereign curve, it can be inferred that the pass-through effect of changes in monetary policy expectations is currently driving most of curve. At the same time, the risk component (the component more attached to fundamentals and mid- to long-term economic expectations) is having a close to negligible effect. Once again, this market dynamic seems to be historically consistent as it is only during periods of economic and policy stability when fundamentals, as represented by the risk component, kick in and drive developments in the long end of the yield curve (Figure 6).

Figure 6: 10y UST decomposition (in %)

Figure 6: 10y UST decomposition (in %)
Sources: Refinitiv Datastream, Allianz Research

Our expected 2023 policy pivot paired with the high sensitivity to short-term rates will aid long duration strategies in H2 2023

Under the assumption that the sensitivity to central bank rate movements will remain intact in the foreseeable future, and trying to use short-term rates as the sole determinant of the long-end of the sovereign curves, our modelling implies that the current market pricing, especially in the US, seems to be slightly inconsistent with the recent moves in the short-end of the curve. Thus, taking both structural and cyclical components of the current and expected monetary policy paths, the 10y UST and 10y Bund seem to be located in the “over-sold” side. To put it into numbers, and acknowledging the variance around our model’s estimate, the moves in the short end of the UST curve suggest a 2.5% fair value for the 10y UST, signaling a close to 150bps imbalance vis a vis the current market pricing of ~4% (Figure 7).

Figure 7: Modelled 10y UST using Fed Fund rates (in %)*

Figure 7: Modelled 10y UST using Fed Fund rates (in %)*
Sources: Refinitiv Datastream, Allianz Research
*Note: 10y UST yield modelled as a function of Fed Funds rate and exponentially smoothed Fed Funds rate; in-sample estimate running until 2005.

With that in mind and following our economic and monetary policy scenario of a harsher-than-expected economic downturn in H1 2023 leading to a policy pivot as soon as H2 2023 , the historically timid but sizeable policy pivot should exert immediate downside pressures on both ends of the yield curve, leading towards a “price positive” market readjustment.  This should revert the 2022 losing streak in the short to mid-run and could support the premise that long-duration strategies may start to look attractive at current levels (Figure 8).

Figure 8: Central bank rates and 10y sovereigns (% - dotted line is AZ Research forecasts until 2023)

Figure 8: Central bank rates and 10y sovereigns (% - dotted line is AZ Research forecasts until 2023)
 Sources: Refinitiv Datastream, Allianz Research

Overall, and acknowledging that our expected policy pivot is yet to be fully discounted, which should allow for some elevated short-term volatility, yields at 4% and 2% for the UST and Bund, respectively, seem to offer a decent pick-up for both hold-to-collect-and-sell and hold-to-maturity investors. But not everything is positive: Within the next three to six months, the high macroeconomic uncertainty will continue to expose tactical investors to elevated short-term market volatility and losses, thus making it difficult to call for an outright long positioning. In the second half of 2023, however, long-term yields should start falling towards our targeted 3.5% and 1.9% for the 10y UST and 10y Bund, respectively. Beyond 2023, yields should start stabilizing and fundamentals (risk component) should once again kick in, with yields slowly crawling towards 4-5% for the 10y UST and 2-3% for the 10y Bund in the mid- to long-run.

It is not only about sovereigns! Corporate credit also wants to claim its spot within the current market environment

In sync with sovereigns, and unlike other market cycles, the current price performance of corporate credit, be it for investment grade (IG) or high yield (HY), can, to a great extent, be attributed to the global pick-up in sovereign rates. Isolating the credit-only related move from the broad corporate credit yield behavior (i.e. credit spreads), it is revealing that the widening in corporate spreads has remained moderately muted and to a certain extent inconsistent with the equity-market meltdown. Because of that, and despite the broad credit underperformance, corporate yields seem to be starting to get some attention as market participants would have to go back to 2009 to find yields close to current levels, directly contrasting with the relatively narrow credit spread (i.e. corporate risk) environment (Figure 9).

Figure 9: Determinants of US IG corporate yields (in % and bps)

Figure 9: Determinants of US IG corporate yields (in % and bps)
Sources: Refinitiv Datastream, Allianz Research
However, the picture is not as benign in the Eurozone. The geographical proximity of the Eurozone to the Ukraine geopolitical conflict and its elevated dependency on Russian commodities has put it in a much tougher spot compared to the US. Both investment-grade and high-yield corporate credit risk have widened to a greater extent than that of their US counterparts.  At current levels, EUR IG spreads are close to Covid-19 levels and slowly crawling towards Euro crisis levels. Nonetheless, and despite this harsh spike in EUR credit risk, the rise in the long end of the sovereign curves, and especially in EUR swaps that have structurally diverged from the Bund, still accounts for more than 50% of the EUR credit underperformance in 2022.

Despite the relatively tight corporate spreads, the broad increase in credit yields has already taken its first victims. The overall increase in corporate credit yields and subsequent increase in financing costs has led to a slowdown in primary markets, with corporates, especially those with a high yield rating, refraining from raising cash in public offerings. In this context, corporate CFOs have remained unwilling to lock in higher-for-longer financing costs unless necessary, preferring to wait for a possible policy pivot and more fiscal aid. Consequently, this has triggered a sharp slowdown in issuance, which has prevented the increase in financing costs from passing through to coupons (Figures 10 & 11).

Figure 10: US corporate bond issuance (EUR bn)
Sources: FINIM, Refinitiv Datastream, Allianz Research
Figure 11: US corporate yield vs par weighted coupons (in %)
Sources: BofA, Refinitiv Datastream, Allianz Research
Thanks to the issuance experienced during the initial Covid-19 phase, most companies have already frontloaded their refinancing operations, locking in extremely low financing costs and consequently pushing the bulk of their refinancing needs towards 2024-2025. This allows for some much-needed breathing room for the next two to three years. Moreover, and according to our computations and corporate debt maturity profiles, it would take around three to four years for broad credit markets to experience a notable increase in interest expenses, thus allowing quite some time for financial conditions to readjust (Figure 12). However, if financing costs do not come down when companies are forced to return to the market, some extenuating pressures on corporate debt-repayment capacity will start to appear, leading to a quick market repricing.

Figure 12: US Outstanding corporate debt maturity profile (in USD Bn)
Sources: Refinitiv Eikon, Allianz Research
*Note: Excludes debt maturing after 2031 and perpetuals

However, current corporate fundamental conditions still look decent. As of today, and both from a short- and mid-term perspective, debt-repayment ratios are currently at a decent level and should provide companies with a big enough cushion to face any short-term volatility. This should lead to a decent intrinsic performance over the next two years and prevent a big wave of downgrades and defaults (Figure 13).

Figure 13: US net leverage and interest-coverage ratios

Figure 13: US net leverage and interest-coverage ratios
Sources: Refinitiv Datastream, Worldscope,  Allianz Research

However, the risk of a sizeable wave of fallen angels (i.e. companies getting downgraded from investment grade to high yield) seems to be increasing. In this regard, and according to market metrics, 12% of investment grade corporate credit is trading at levels consistent with a rating downgrade, thus implying that ~10-15% of the overall BBB credit is at risk of being downgraded to high yield. This increased downgrading risk is important as the proliferation of BBB-rated credit has been quite extenuating for the past 15 years, leading to almost half of the credit universe being considered just above high yield, thus increasing, in volume terms, the number of potential fallen angels. However, and despite the mounting risk of rating downgrades priced in by the market, it has to be conceded that in 2020 markets already experienced a big wave of fallen angels. As a result, the broader indices seem to already be quite clean, meaning that the expected wave of fallen angels may be greatly overpriced (Figure 14 & 15).

Figure 14: BBB downgrades priced in as a % of BBBs

Figure 14: BBB downgrades priced in as a % of BBBs
Sources: Refinitiv Datastream, Allianz Research, Allianz Investment Management
Figure 15: US corporate debt rating distribution (% of total MV)
Sources: Refinitiv Datastream, BofA, Allianz Research
Overall, and moving forward, the balance between monetary and inflation headwinds with decent fundamentals and policy pivot tailwinds should still provide some cushion for corporate credit performance, adding some relevant short- and mid-term compression pressures on credit spreads. Because of that, we remain constructive on corporate credit, but acknowledge that the upcoming highly volatile six months may still pose some exacerbated short-term risk to corporate credit performance, especially in high yield, thus warranting a quality tilt (>BBB). Numerically, we still target a flat to timid compression for both investment-grade and high-yield credit in both sides of the Atlantic irrespective of their rating and we target investment-grade spreads at around 160bps and 190bps by the end of 2022 for the US and Eurozone, respectively. We also expect the policy pivot and overall economic resilience to trigger a further compression in 2023, with both US and Eurozone spreads landing at levels close to 130-140bps. For high yield, we expect some further pressures until Q1 2023, with spreads landing at 480bps and 570bps at the end of 2022 for the US and Eurozone, respectively. Afterwards, in sync with IG spreads, we expect high-yield spreads to compress towards 400-460bps in 2023 (Figure 16).

Figure 16: Corporate spread forecasts (in bps)
 Figure 16: Corporate spread forecasts (in bps)
Sources: Refinitiv Datastream, Allianz Research

Short-term risks in equities still outpace the upward potential vis-a-vis fixed income.

Together with corporate credit and sovereigns, equities remain under pressure, with market corrections reaching maximum yearly drawdowns close to 30%. In this regard, the increasing inflation paired with the increase in real yields and short-term rates has been devastating for equity performance and especially for those markets with a high technology/growth bias (e.g. the NASDAQ and S&P 500). This year’s performance confirms the idea that inflation tends to be good for equities as long as it is not too high. In this regard, and according to our own computations, inflation below or equal 4% tends to be positive for equity performance (Figure 17)

Figure 17: US inflation - equity hurricane

Figure 17: US inflation - equity hurricane
Sources: Refinitiv Datastream, Allianz Research

On the valuation side and focusing on price-earnings ratios, the constant climb in real long-term sovereign rates together with a flattening and stabilization of the inflation expectations curve has weighed on equity valuations and continues to do so for the time being. In this regard, markets continue to underperform and remain, as in the case of fixed income and through second-round effects, relatively attached to changes in monetary policy expectations (Figure 18).

Figure 18: US equity risk premium (ERP) vs 10y real yields

Figure 18: US equity risk premium (ERP) vs 10y real yields
Sources: IBES, Refinitiv Datastream, Allianz Research

This coincident behavior between equity valuations and the long end of the sovereign curve has triggered a sharp readjustment in the Equity Risk Premium (ERP). But even if the world experienced a global risk appetite meltdown, the ERP correction has depicted some notable geographical divergences. In the US, in contrast to the Eurozone, the latest equity correction has brought the ERP below its long-term average, making American equities less appetizing than their European counterparts. In this regard, the already harsh market correction does not seem to have been able to correct all the accumulated valuation and market imbalances in the past 15 years.  This is not the case in the Eurozone and UK, with the ERP being above long-term averages and signaling that equity markets in those regions may be oversold and could provide some upside potential vis-a-vis fixed income (Figure 19).

Figure 19: US and Eurozone equity risk premium (ERP in % - dotted lines represent long-term averages)

Figure 19: US and Eurozone equity risk premium (ERP in % - dotted lines represent long-term averages)
Sources: IBES, Refinitiv Datastream, Allianz Research

Having conceded that equity valuations look decent in some geographies, it must be reiterated that equity performance continues to be greatly driven by changes in policy expectations and, in the case of the Eurozone and the UK, is highly dependent on the geopolitical landscape. Because of that and trying to see the forest for the trees, it is important to look at fundamentals and at the expected resilience of companies’ balance sheets vis-a-vis the current market and economic environment. In this regard, and looking at corporates’ cash-generating capacity, it is revealing that market consensus continues to imprint a bearish sentiment label on corporate earnings expectations, thus expressing a certain degree of mistrust in consumers’ and companies’ economic resilience. Interestingly, and due to the high sensitivity of markets to the news flow, earnings misses seem to be leading to a much harsher price correction than in other instances. As in the ERP, the Eurozone parts ways with the rest of the world, with the market consensus correcting its previously “too negative” earnings consensus, readjusting to a higher-than-expected European resilience and, consequently, leading to a relative outperformance of EUR equities vs US fundamentally. One of the reasons behind the overperformance has been the weaker Euro which has, on balance, helped European firms, thus partially driving revisions upwards at an individual firm level (Figure 20).

Figure 20: Earnings breadth (in %)

Figure 20: Earnings breadth (in %)
Sources: IBES, Refinitiv Datastream, Allianz Research
Note: # of EPS upward revisions - # of EPS downward revisions as a % of total # of estimations

But even if market consensus continues to become more bearish, the expected earnings growth keeps depicting a slow but still growing environment. Companies’ bottom-line expectations still suggest a resilient scenario as they are, on average, still expected to generate positive inflows in the next three years. This indicates a better-than-expected resilience than that currently suggested by macroeconomic and sentiment indicators. However, and as it tends to happen in periods of high uncertainty, market expectations continue to be readjusted to the downside as more information is released. In this regard, the upside market revision for 2022 earnings has been at the expense of 2023 earnings, showing that markets still expect a worse-than-expected fundamental recovery for equity markets in 2023 (Figure 21). In fact, our macro-driven earnings-per-share growth model implies that EPS should contract by as much as -4% within the next 12 months, thus contrasting with the current market consensus and painting a worse-than-expected fundamental equity outlook for the next 12 months (Figure 22).

Figure 21: US earnings growth expectations (%)

Figure 21: US earnings growth expectations (%)
Sources: IBES, Refinitiv Datastream, Allianz Research
Figure 22: US EPS growth model (y/y%)
Sources: Refinitiv Datastream, Allianz Research
Overall, we still expect equity markets to remain under pressure for the next six months as uncertainty around valuations, fundamentals and the effect of monetary policy moves will keep weighing on risk appetite towards riskier assets, locking in an overall -15% correction for both US and Eurozone equities in 2022. Nonetheless, and despite the expected volatility in H1 2023, equity markets should regain some terrain in H2 2023 on the back of abating inflation, renewed economic momentum and the expected policy pivot which should, in turn, lead to an upper-single-digit performance in 2023 and allow for some potential pick up vis-a-vis fixed income. However, and until H2 2023, equity markets do not really look as attractive as fixed income since their current vulnerability to changes in market sentiment makes them more volatile (Figure 23).

Figure 23: US and Eurozone equity scenarios
Sources: Refinitiv Datastream, Allianz Research

All in all, we believe that fixed income has regained some attractiveness from a risk-adjusted perspective and may prove a good investment in the current volatile environment and especially in 2023. However, short-term market volatility may still challenge the attractiveness premise soon. After the expected policy pivot in 2023, and from a tactical perspective, equity and higher yielding assets should tactically outperform the rest of the market, thus once again providing some pick-up vis-a-vis safer fixed income assets.

Does the relative fixed-income attractiveness also apply to emerging markets?

In previous research , we identified how the current crisis would hit emerging markets harder than other regions because the Fed would be forced to hike interest rates at a pace not seen since Volcker. In this context, EMs continue to struggle to maintain their currencies afloat, with yields in both local and hard currency already at levels that could prove unsustainable in the medium term. However, looking at previous episodes (i.e. LatAm lost decades) or what is currently happening in smaller developing countries (not extremely relevant to the global fixed income market, but still raising warning signals), we believe it is unlikely that a relevant stress episode takes place in any large emerging market .

However, unlike in the case of advanced economies, we think that from a tactical perspective the current environment is not yet favorable for fixed income in emerging markets. Looking at sovereign hard currency, we find that among the largest USD issuers (and weighted in EM indexes), the commodity boom has provided some relief this year, albeit one that is set to deteriorate as economic growth slows, offsetting the possible upside coming from a US Fed pivot. In the case of local currency sovereign bonds, the large increase in yields could, as of today, offer some entry opportunities, but the continued pressures coming from a strong USD will keep the exchange rate risk high, even when looking at it from an EUR perspective. In this regard, foreign exchange market intervention has been important, and while the end of the hiking cycle seems close in many countries, this was also the case three months ago so it cannot be taken as a good proxy for a FX turn. Furthermore, the higher weight of Asian countries, which initially seemed less affected by inflationary pressures, does not play in its favor. We see a wider margin for higher yields in the cluster of countries as mounting inflationary pressures and the repricing of more hawkish central bank monetary policies reached the region later than the rest of the EMs, where yields are already stabilizing.

All in all, and as the global macroeconomic recovery is set to reach emerging markets with a certain delay, and EM corporates tend to be more exposed to changes in interest rates, we believe that it is still not the moment to target EM fixed income from a tactical perspective. Nonetheless, and from a carry perspective, there may still be some pockets of value in both EM sovereign and corporates that could prove interesting at current levels although a high degree of selectivity and scrutiny is warranted. This is particularly true in the case of EM corporates since default rates are currently high – in part due to the special situation of Russian and Chinese real estate companies – and in the event of higher-than-expected interest rates, they will not enjoy the same safe lines as sovereigns. As a broad asset class, its relative attractiveness may well improve in late 2023 and beyond due to the macroeconomic catch-up effect from EM countries.

In sum, the return opportunities in emerging market debt are better than they have been in recent years, but the turbulence will take longer to dissipate. The harm from the global slowdown and US Fed rates is not over, and the volatility in the coming months will remain high.