Executive Summary
- On top of the upward trend in business insolvencies[1], we identify a record level of failures of large companies - those with over EUR50mn of turnover- with 342 major insolvencies totaling more than EUR205bn in turnover in 2019.
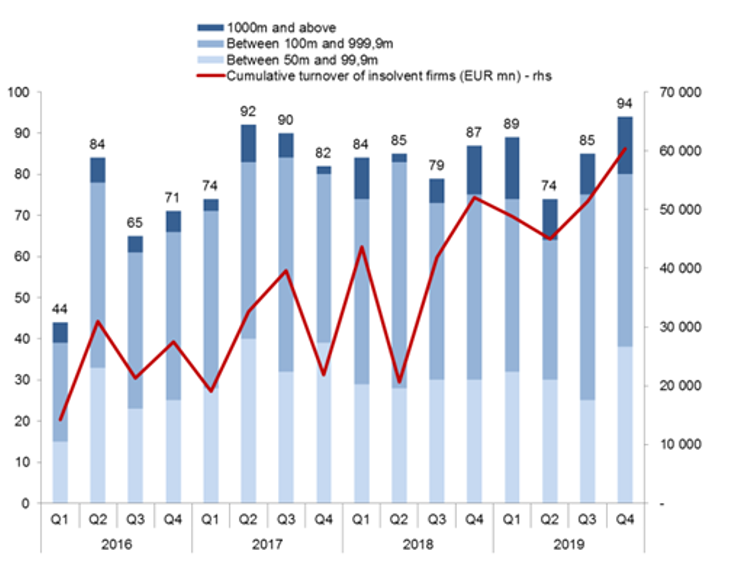
- The increase in major failures accelerated in the last quarter of 2019 with a record number of cases (94) and a new high in terms of severity (their combined turnover increased +16% y/y to EUR60.4bn).
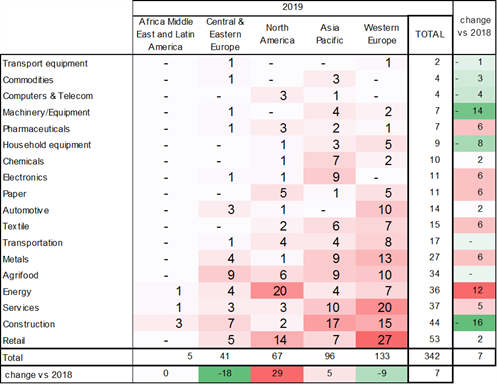
- North America (+29 cases) was the key contributor to the global rebound in major insolvencies, along with Asia (+5). Yet, Western Europe (-9) remained the most impacted region with 133 major insolvencies (compared to 96 cases in Asia).
- The hotspots were retail and services in Western Europe, energy and retail in North America and construction in Asia.
- What does this mean for companies? A higher risk of domino effects with adverse implications on fragile providers along supply chains.
Our latest monitoring points to record levels in the number of major insolvencies and the severity of major insolvencies. Q4 2019 saw a record number of major insolvencies since 2016 with 94 cases, representing a +11% increase q/q (i.e. +8% y/y). The cumulative turnover of insolvent major companies also reached a record high at EUR60.4bn (+11% q/q or +18% y/y). For the year as a whole, the number of major insolvencies stood at 342 (+7 cases) and the cumulative turnover was EUR205.6bn (+30% or +EUR47.3bn). This increase in severity is notably the result of a growing number of failures of companies with turnovers exceeding EUR1bn (+19 to 49 cases).
The U.S. drove the rise while Asia and Europe increased the global count. Or Despite a slight decrease (-9), Western Europe remained the largest contributor to the global insolvency count in 2019 with 133 cases, ahead of Asia with 96 cases (+5). Asia posted the strongest increase in insolvencies of companies with a turnover exceeding EUR 1bn (+12 to 26 cases). North America posted +29 more insolvencies (compared to 2018), with a noticeable rebound (+25) in companies with turnovers between EUR100mn and EUR1bn. Central & Eastern Europe stands out with a decline for the second consecutive year (from -20 in 2018 to -18 in 2019 with 41 cases). The U.S. and China both share the podium for top insolvencies with 7 and 8 out of the 20 largest insolvencies registered in 2019, respectively.
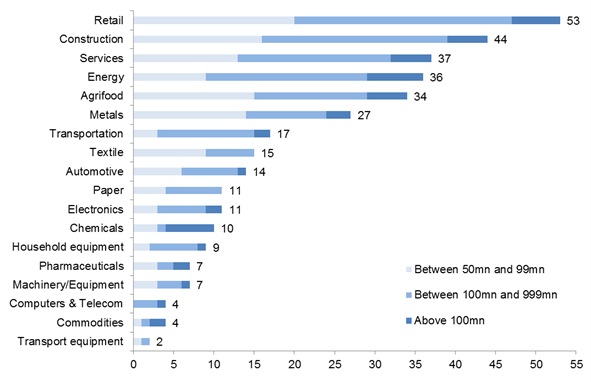
Retail and construction were the most impacted sectors in 2019, but energy stood out with the strongest increase of major insolvencies. For 2019 as a whole, retail (53 cases), construction (44) and services (37) were the most affected sectors compared to 2018 - despite a noticeable decline for construction (-16). Energy (+12) posted the strongest rise in insolvencies, along with five sectors registering +6 more major insolvencies: metals, electronics, pharmaceuticals, paper and textile. Conversely, construction (-16) and machinery & equipment (-14), posted the strongest declines compared to 2018. The highest average size of insolvent companies in terms of turnover are seen in electronics, chemicals, metals and energy/commodities.
The 2019 hotspots were retail and services in Western Europe, energy and retail in North America and construction in Asia. The last quarter of 2019 registered the highest number of major insolvencies in the retail sector in Western Europe (7 cases), but top increases were observed in Asia (+9) due to electronics (+5) and services (+4), and to a lesser extent in North America (+6) due to agrifood (+3) and paper (+3).
For the full year, in Western Europe, the hotspots remained retail (+3 cases to 27) and services (+2 to 20), while the energy sector also posted a noticeable increase (+5). Asia registered the highest number of major insolvencies in construction (17), services (10) and the electronics sector (9) which posted a significant increase (+7). Yet, the strongest increase appeared in North America in the energy sector (+12) which posted the highest number of major insolvencies (20) ahead of retail (14).
[1] More details on our Global Insolvency Outlook 2020


