Executive Summary

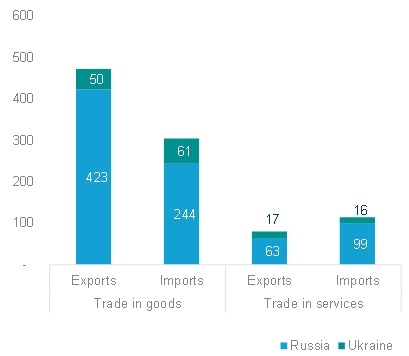
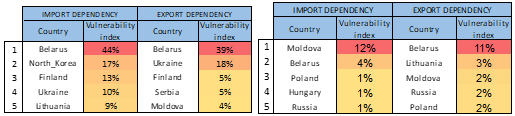
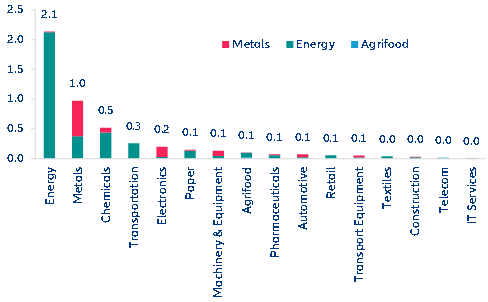
  • Global trade exposure to the Russian and Ukrainian economies is limited and has been declining over the past year, which will restrict the direct impact of the war to certain countries (eg. Belarus, Moldova, Poland, Turkey) and sectors (oil & gas, fertilizers, metals, agrifood).
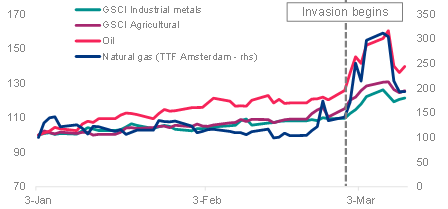
  • However, the indirect impact will be global, massive and immediate: The entire global economy will suffer from the current surge in energy and commodity prices, and from additional disruptions in supply chains.
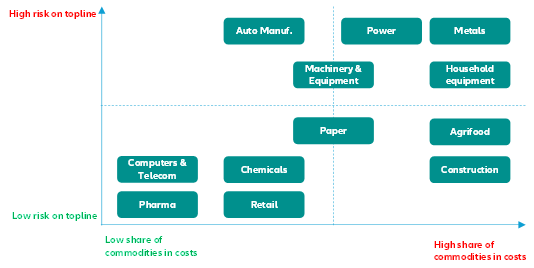
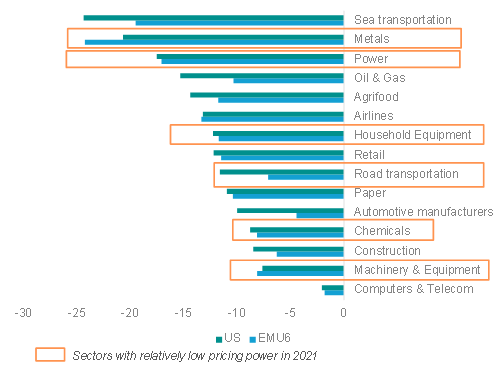
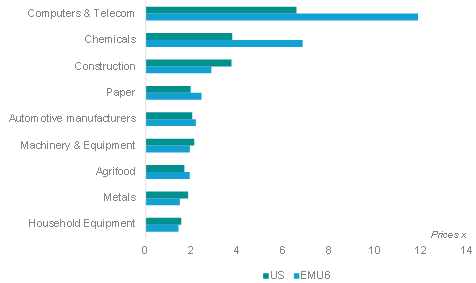
  • If oil and energy prices, as well as non-energy commodity prices, remain at current levels, we find that the metals and power sectors are most at risk of a profitability shock and could lose over 20pp of EBITDA margins that were around 30% in 2021.
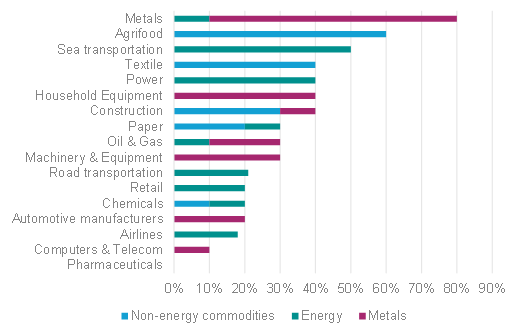
  • A further +50% to 70% rise in non-energy commodity prices could actually wipe out all profits in six out of the nine sectors under analysis. Higher prices could also spark a decline in demand, which would hit the power, metals, household equipment and machinery & equipment sectors the hardest (see Figure 1).
  • As governments become increasingly concerned about a prolonged conflict and the increasing negative confidence effects, we expect increased state support measures that could delay a full insolvency normalization in 2022.

Figure 1 – Revenue vs commodity cost risk mapping

Figure 1 – Revenue vs commodity cost risk mapping
Source: Allianz Research.
Global trade exposure to the Russian and Ukrainian economies is limited and has been declining, which will restrict the direct impact of the war to certain neighboring countries (e.g. Belarus, Moldova, Poland, Turkey) and sectors (oil & gas, fertilizers, metals, agrifood). In absolute terms, Russia and Ukraine’s trade in goods and services are not negligible since they total USD828bn and USD144bn, respectively (see Figure 2), with a broadly similar share for trade in goods (80% of total trade) and services (20%). Yet, these account for only 2.1% and less than 0.4% of global trade value, respectively. For the Russian economy, this represents a 1pp drop of its share in global trade since 2013, in sync with the 1pp drop in its share in global GDP, down from 3.0% in 2013 to less than 2.0% since 2019.

Figure 2 – Ukraine and Russia in global trade (USD bn - 2019)
Sources: ITC, Allianz Research
In this context, a sharp decline or even a total interruption in trade relations with Russia would only have a limited direct impact on the global economy. Such a scenario could materialize through heightened sanctions (i.e. wider embargos), voluntary corporate decisions because of reputational risk or just plain solidarity with Ukraine.

However, both Russia and Ukraine are key partners for their respective neighbors in the region. Using ITC data to calculate vulnerability indices based on trade dependencies, we find that the most vulnerable countries are first and foremost Belarus and Moldova, ahead of the other countries of Central and Eastern Europe ( Poland, Hungary, Serbia, Romania, Turkey), the Baltics (Lithuania) and the Nordics ( Finland, Norway, see Table 1). Belarus is by far the most dependent on trade with Russia, both in terms of imports (dependency at 39%) and exports (dependency at 44%), ahead of North Korea (17% and 2%, respectively) and Finland (13% and 5%). Belarus, Moldova and to a lesser extent Lithuania are the most dependent on trade with Ukraine.
                                                                     
Table 1 – Trade dependencies on Russia (left) and Ukraine (right)
Sources: ITC, Allianz Research
When it comes to sectors, energy products (oil and natural gas) and raw materials for the upstream side of the metals and agrifood sectors display the largest dependencies to Russia and Ukraine, as well as fertilizers and wood. Indeed, the vulnerability index for mineral fuel imports is estimated to be 11%, the highest percentage. As far as exports are concerned, dependencies do not seem to be as concentrated. The highest export vulnerability index is only 3%. Hence, the dependence on exports to Russia appears to be less significant than that on imports from Russia. In Ukraine, cereals had the highest vulnerability index.  All in all, direct and immediate exposure to trade in goods is (very) concentrated. On the services side, those most vulnerable to services trade dependency are EU countries both on the import and export side; travel and transport sectors together account for over half of Russian services imports/exports.

However, the indirect impact will be massive, global and immediate: The entire global economy will suffer from spillover effects due to a surge in energy and commodity prices, and additional disruptions in supply chains. While the invasion of Crimea in 2014 did not lead to a significant shock on commodity markets, the current war is sending out a tremendous shockwave. Russia accounts for about 10% of global oil, and Russia and Ukraine combined account for a quarter of global wheat exports. Russia is also a key player in many industrial metals. As markets started to worry about the supply of these commodities, prices increased sharply. Although there were seven historical oil-supply disruptions more severe than the current one, oil prices have already come close to their all-time high, European natural gas prices touched the historic EUR300 mark, wheat prices are now up +40% since the beginning of the year and nickel trading had to be halted on the London Metal Exchange on 08 March. Since then, most commodity prices have retracted from their highs of early March but they remain at elevated levels.

Figure 3 – Commodity prices (Jan-22 = 100)
Sources: Refinitiv, Allianz Research
An input-output analysis reveals that Russia is a significant supplier in global value chains. Energy is by far the most important channel (ahead of metals and agrifood), and Europe is the most exposed to the risk of a sudden stop in production – though the effects of this should be limited. In Western Europe, the energy, metals and chemicals sectors are the ones most at risk. Russian inputs represent slightly more than 2% of Western Europe’s energy output (see Figure 4). Although this figure can seem relatively low, we must keep in mind that energy is an essential input for many other segments of the economy and the resulting snowball effect could cripple wider economic activity – depending on the scenario, we estimate the shock to Eurozone GDP growth to range between -1.2pp and -2.3pp .

Figure 4 – Russian energy, metals and agrifood inputs used in Germany, France, Italy and Spain, (%of total sectoral output)
Sources: OECD, Allianz Research
Against this backdrop, many firms will suffer from high prices. A first look at the cost breakdown of US and European firms reveals that some sectors spend most of their operating expenses on commodity-related inputs. For instance, 80% of opex in the metals sector is related to energy and metals (see Figure 5), 60% of costs in the agrifood sector are associated with agricultural commodities. Russia is also a key player in some commodities, not as important in terms of volume as oil, gas or wheat but still critical for electronics: palladium for chips and sensors; neon, xenon and krypton gas for lithography processing for semiconductors. With these products already facing supply tensions even before the war, the current crisis is likely to increase pressure and shortages. The automotive sector is also going to be impacted as Russia produces aluminum, nickel and lithium that are key for electric vehicle batteries.

Figure 5 – Commodities in industry costs*
*Based on US data, for input less labor & capex
Sources: BLS, Allianz Research
At this stage, we estimate that if oil and energy prices, as well as non-energy commodity prices, remain at current levels, the metals and power sectors are most at risk of a profitability shock. These sectors could see EBITDA margins drop by -20pp or more if they are unable to raise revenues. Current energy price levels (measured by the GSCI energy index that includes oil, gas, electricity etc.) stand at +70% versus 2021 average. When it comes to other raw materials, food commodities are up +27% while industrial metals are up +31%. If these price levels were to remain throughout the year, metals and power could suffer the most as they have relatively low pricing power. However, it is worth mentioning that both sectors would remain profitable as they had strong profit margins in 2021 (circa 30% for both). For the power sector, historically, margins have been around 30%, including 2021, and the current context is unprecedented – profits declining by -66% would be extraordinary. For the metals sector it’s another story: While 2021 was an exceptional year, thanks to high metal prices and strong demand, historical margins have ranged around 15-20%. Consequently, falling towards the 10% level would simply qualify as a bad year.

Would a further rise in commodity prices wipe out all profits? We find that, at constant revenue, another +40% increase in oil prices would lead the airlines sectors into negative EBITDA margins if they are unable to pass on the increase to consumers. This would mean Brent averaging 140 USD/barrel versus 100 currently. Others such as the chemicals sector have much more leeway, but metals is at a risk of a double whammy as other commodity prices are rising as well.

Figure 6 – Profitability decrease if commodity prices remain at current levels (EBITDA, pp)
NB: we only take into account sectors in which energy costs >5% opex  
EMU6 = Germany, France, Italy, Spain, Netherlands, Belgium. This analysis is ceteris paribus, as we do not factor in changes in revenues, change in product mix or specifications, cost control measures etc.
Sources: Refinitiv, Allianz Research
When it comes to non-energy commodities, many sectors would not be able to absorb a doubling of prices (for instance aluminum at 4950 USD/MT, copper at 18600 USD/MT or wheat at 13 USD/bushel). In fact, another +15% increase in the prices of industrial metals could drive the profitability of the household equipment sector to 0 if it is unable to increase revenues (see Figure 7). A further increase of +60% in the price of agricultural commodities or +50% in metal prices could have the same impact on agrifood and metals. At the other end of the spectrum, computers & telecom and chemicals appear to be able to absorb higher commodity prices.

Figure 7 - Non-energy materials bill increase likely to wipe out all profits
Figure 7 - Non-energy materials bill increase likely to wipe out all profit
NB: we only take into account sectors in which non-energy commodity costs >5% opex - EMU6 = Germany, France, Italy, Spain, Netherlands, Belgium
Sources: Refinitiv, Allianz Research
If the war intensifies, pushing the global economy into our black-out scenario  and consequently driving up commodity prices even higher, retail and recreation services would take a hit. A prolonged crisis leading to increased state support could also delay insolvency normalization. The latest mobility data reveal that we are already seeing consumers in the US, France, Germany and the UK reducing their trips to stores, restaurants etc. With food inflation biting and fuel prices increasing, it is not surprising to see consumers postpone or cancel spending (see Figure 8). Should this context last for long, the confidence shock could lead the global economy towards stagflation.

Figure 8 – Mobility for retail & recreation and diesel prices
Sources: Google mobility report, EIA, European Commission, ONS, Allianz Research
Considering the risks of a prolonged crisis and higher commodity prices for longer, some governments are likely to support corporates. The French government announced on 16 March support measures that could add up  to north of EUR130bn in 2022. Indeed, the government is offering up to EUR30bn of specific subsidies on energy, and up to EUR100bn in extra state-guaranteed loans (half due to an increase in the existing scheme and the other half from a new scheme due to start in July 2022). Such measures could prevent some energy-intensive firms from filling for bankruptcies, thus delaying the full normalization of insolvencies. We now expect insolvencies to grow by a modest +8% in 2022 (see Table 2).

Table 2 – Insolvency forecasts
 Table 2 – Insolvency forecasts
Sources: National statistics, Allianz Research