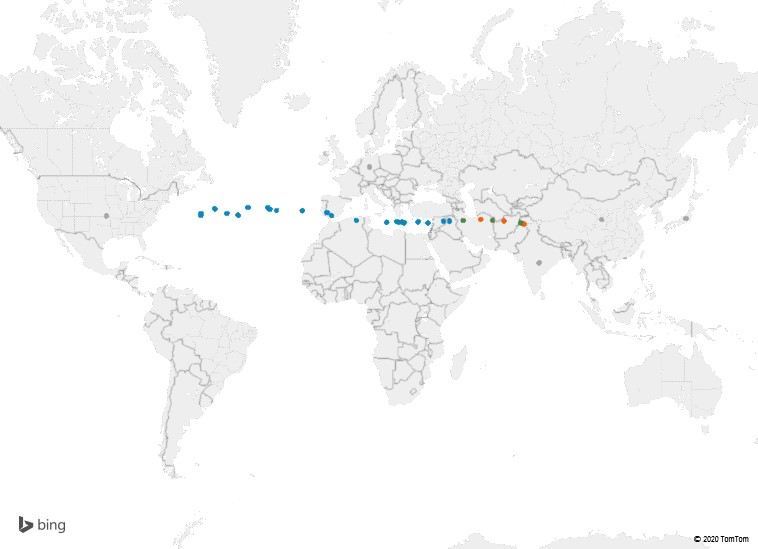
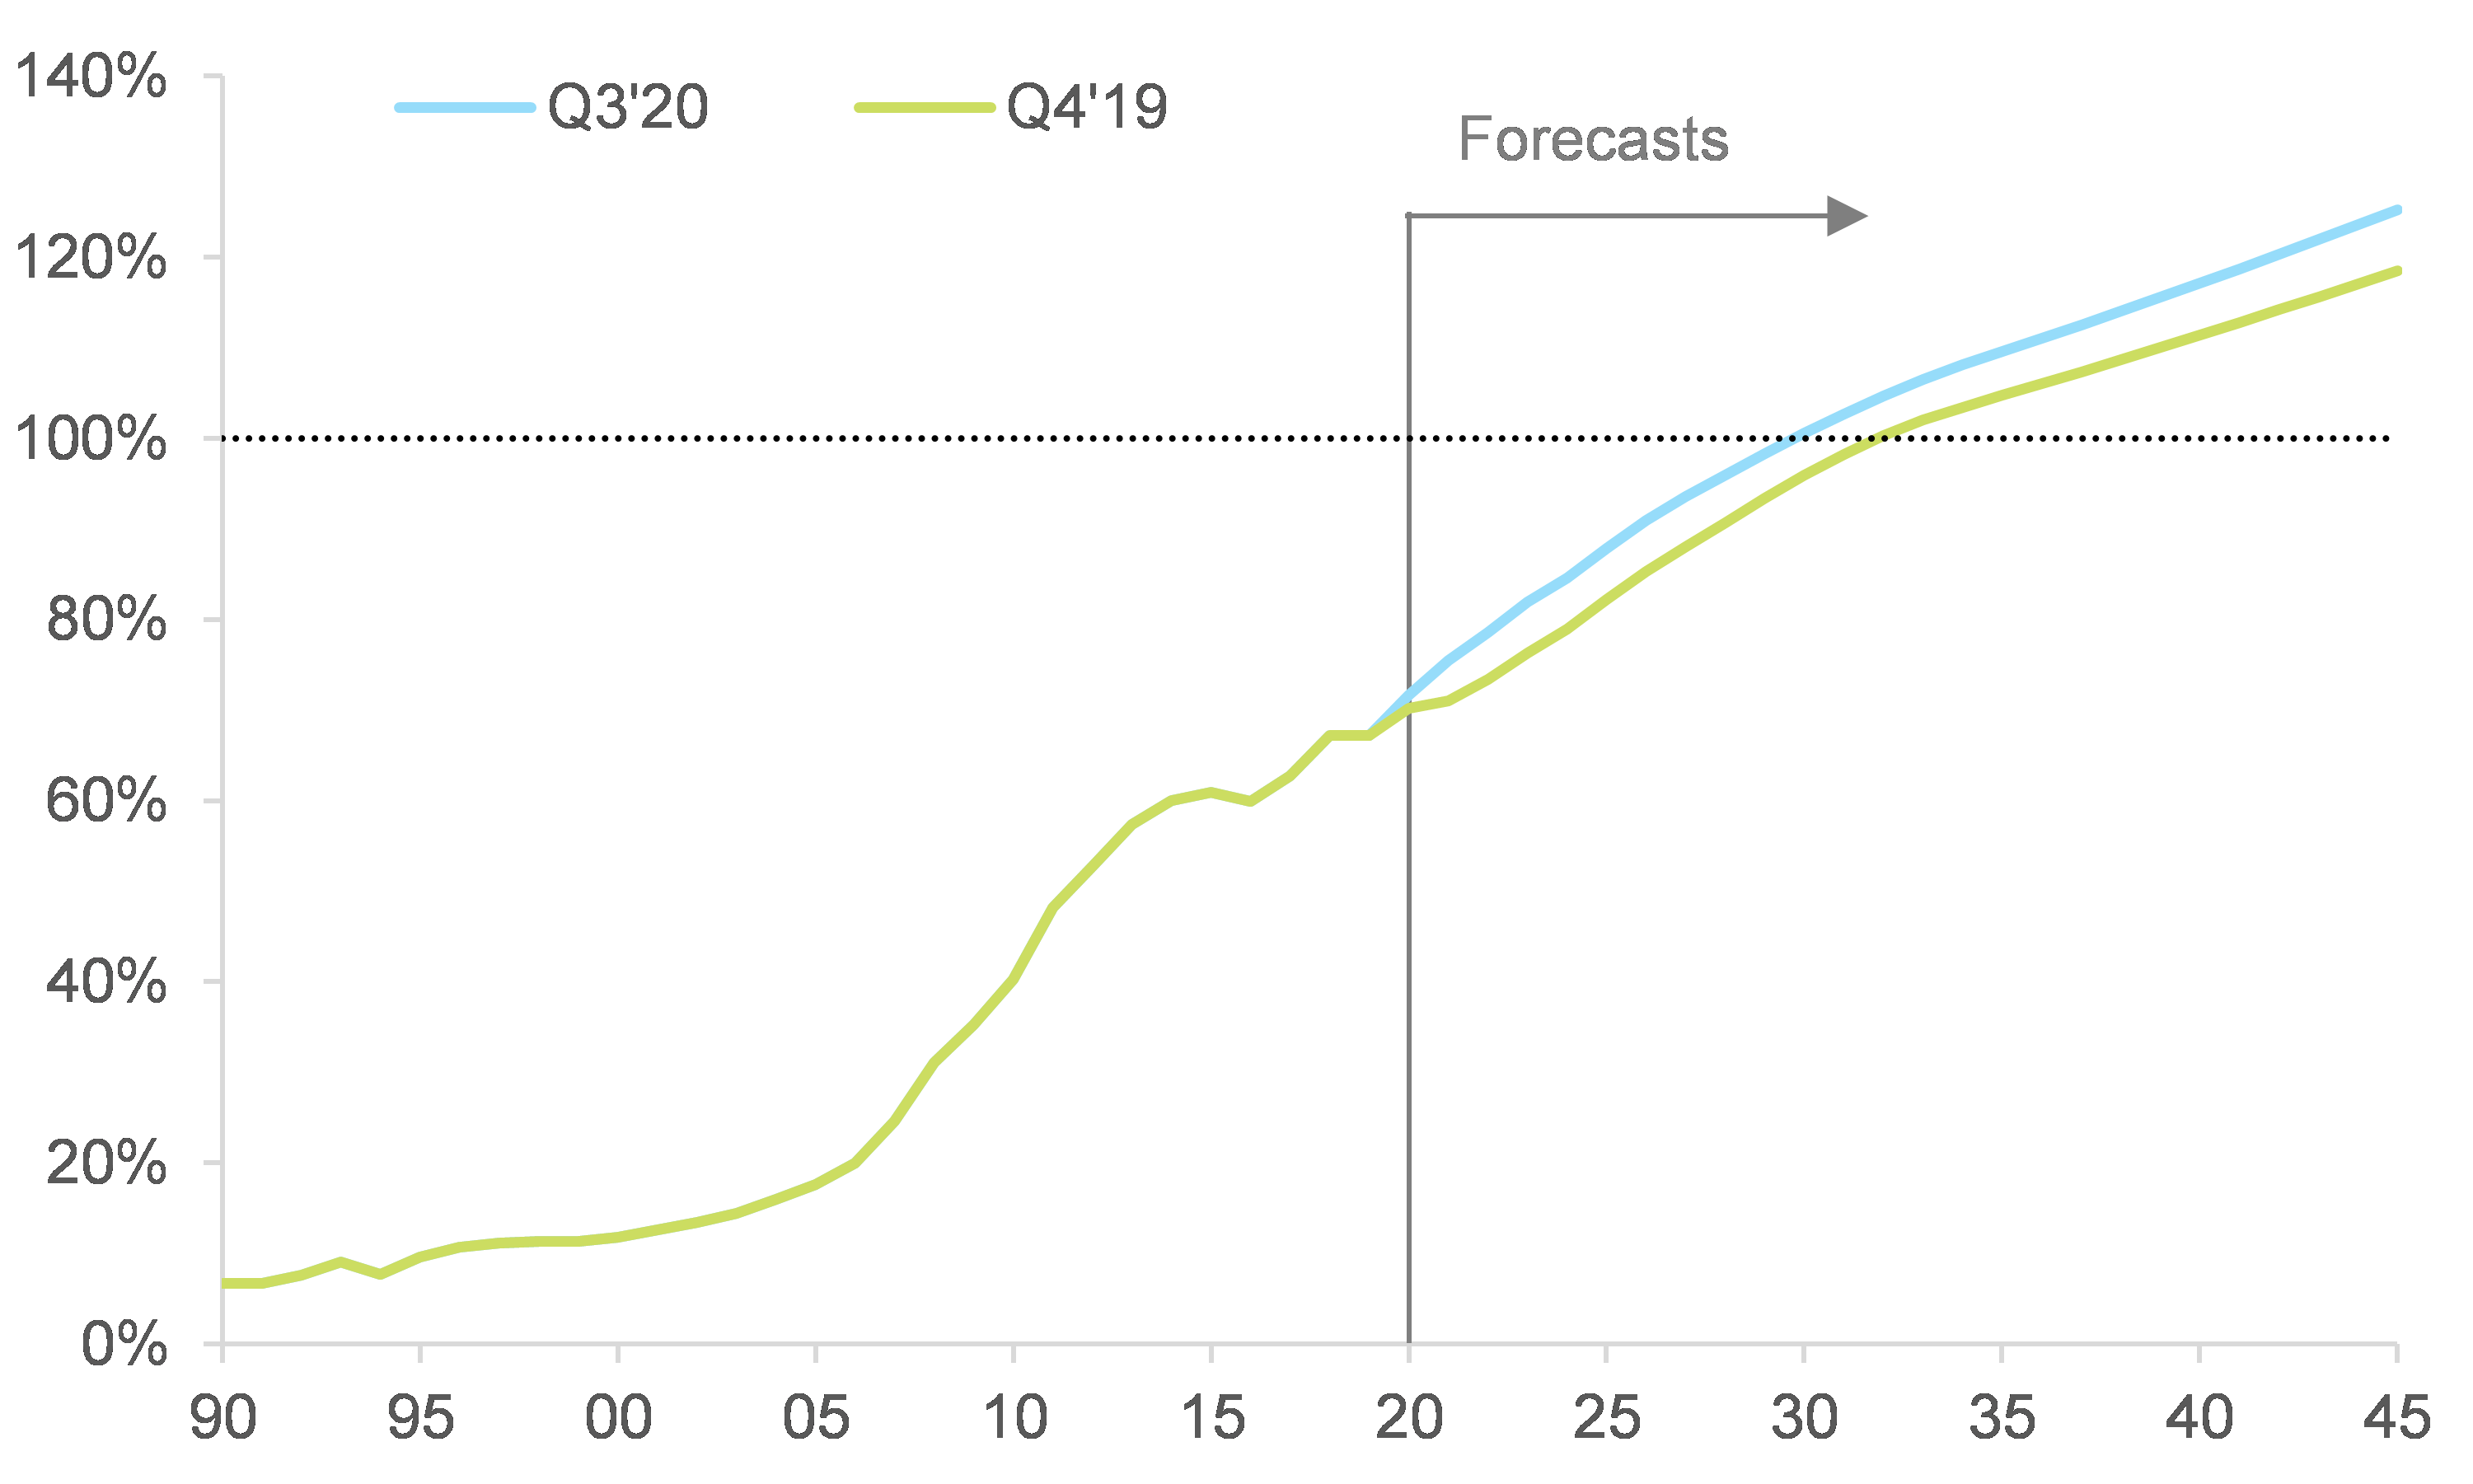
Executive Summary

The Covid-19 crisis could accelerate the shifting global balance towards Asia. We computed the world’s economic center of gravity (WECG) and found that it has been moving eastwards towards Asia since 2002. Looking ahead, with the Asia-Pacific region set to recover sooner from the Covid-19 crisis, the pace of this movement could be 1.4x faster than previously expected. By 2030, we forecast the WECG could be located around the confluence of China, India and Pakistan. In comparison, it was located in the Atlantic Ocean until 2007.
China is a relative winner in the post Covid-19 world, with its GDP winning two years over developed economies (compared to the pre-crisis long-term path). China emerged from the Covid-19 shock earlier than the rest of the world and authorities are already planning for the long term. Indeed, we now expect China to catch up with US GDP in 2030 instead of 2032, as expected at the end of 2019.
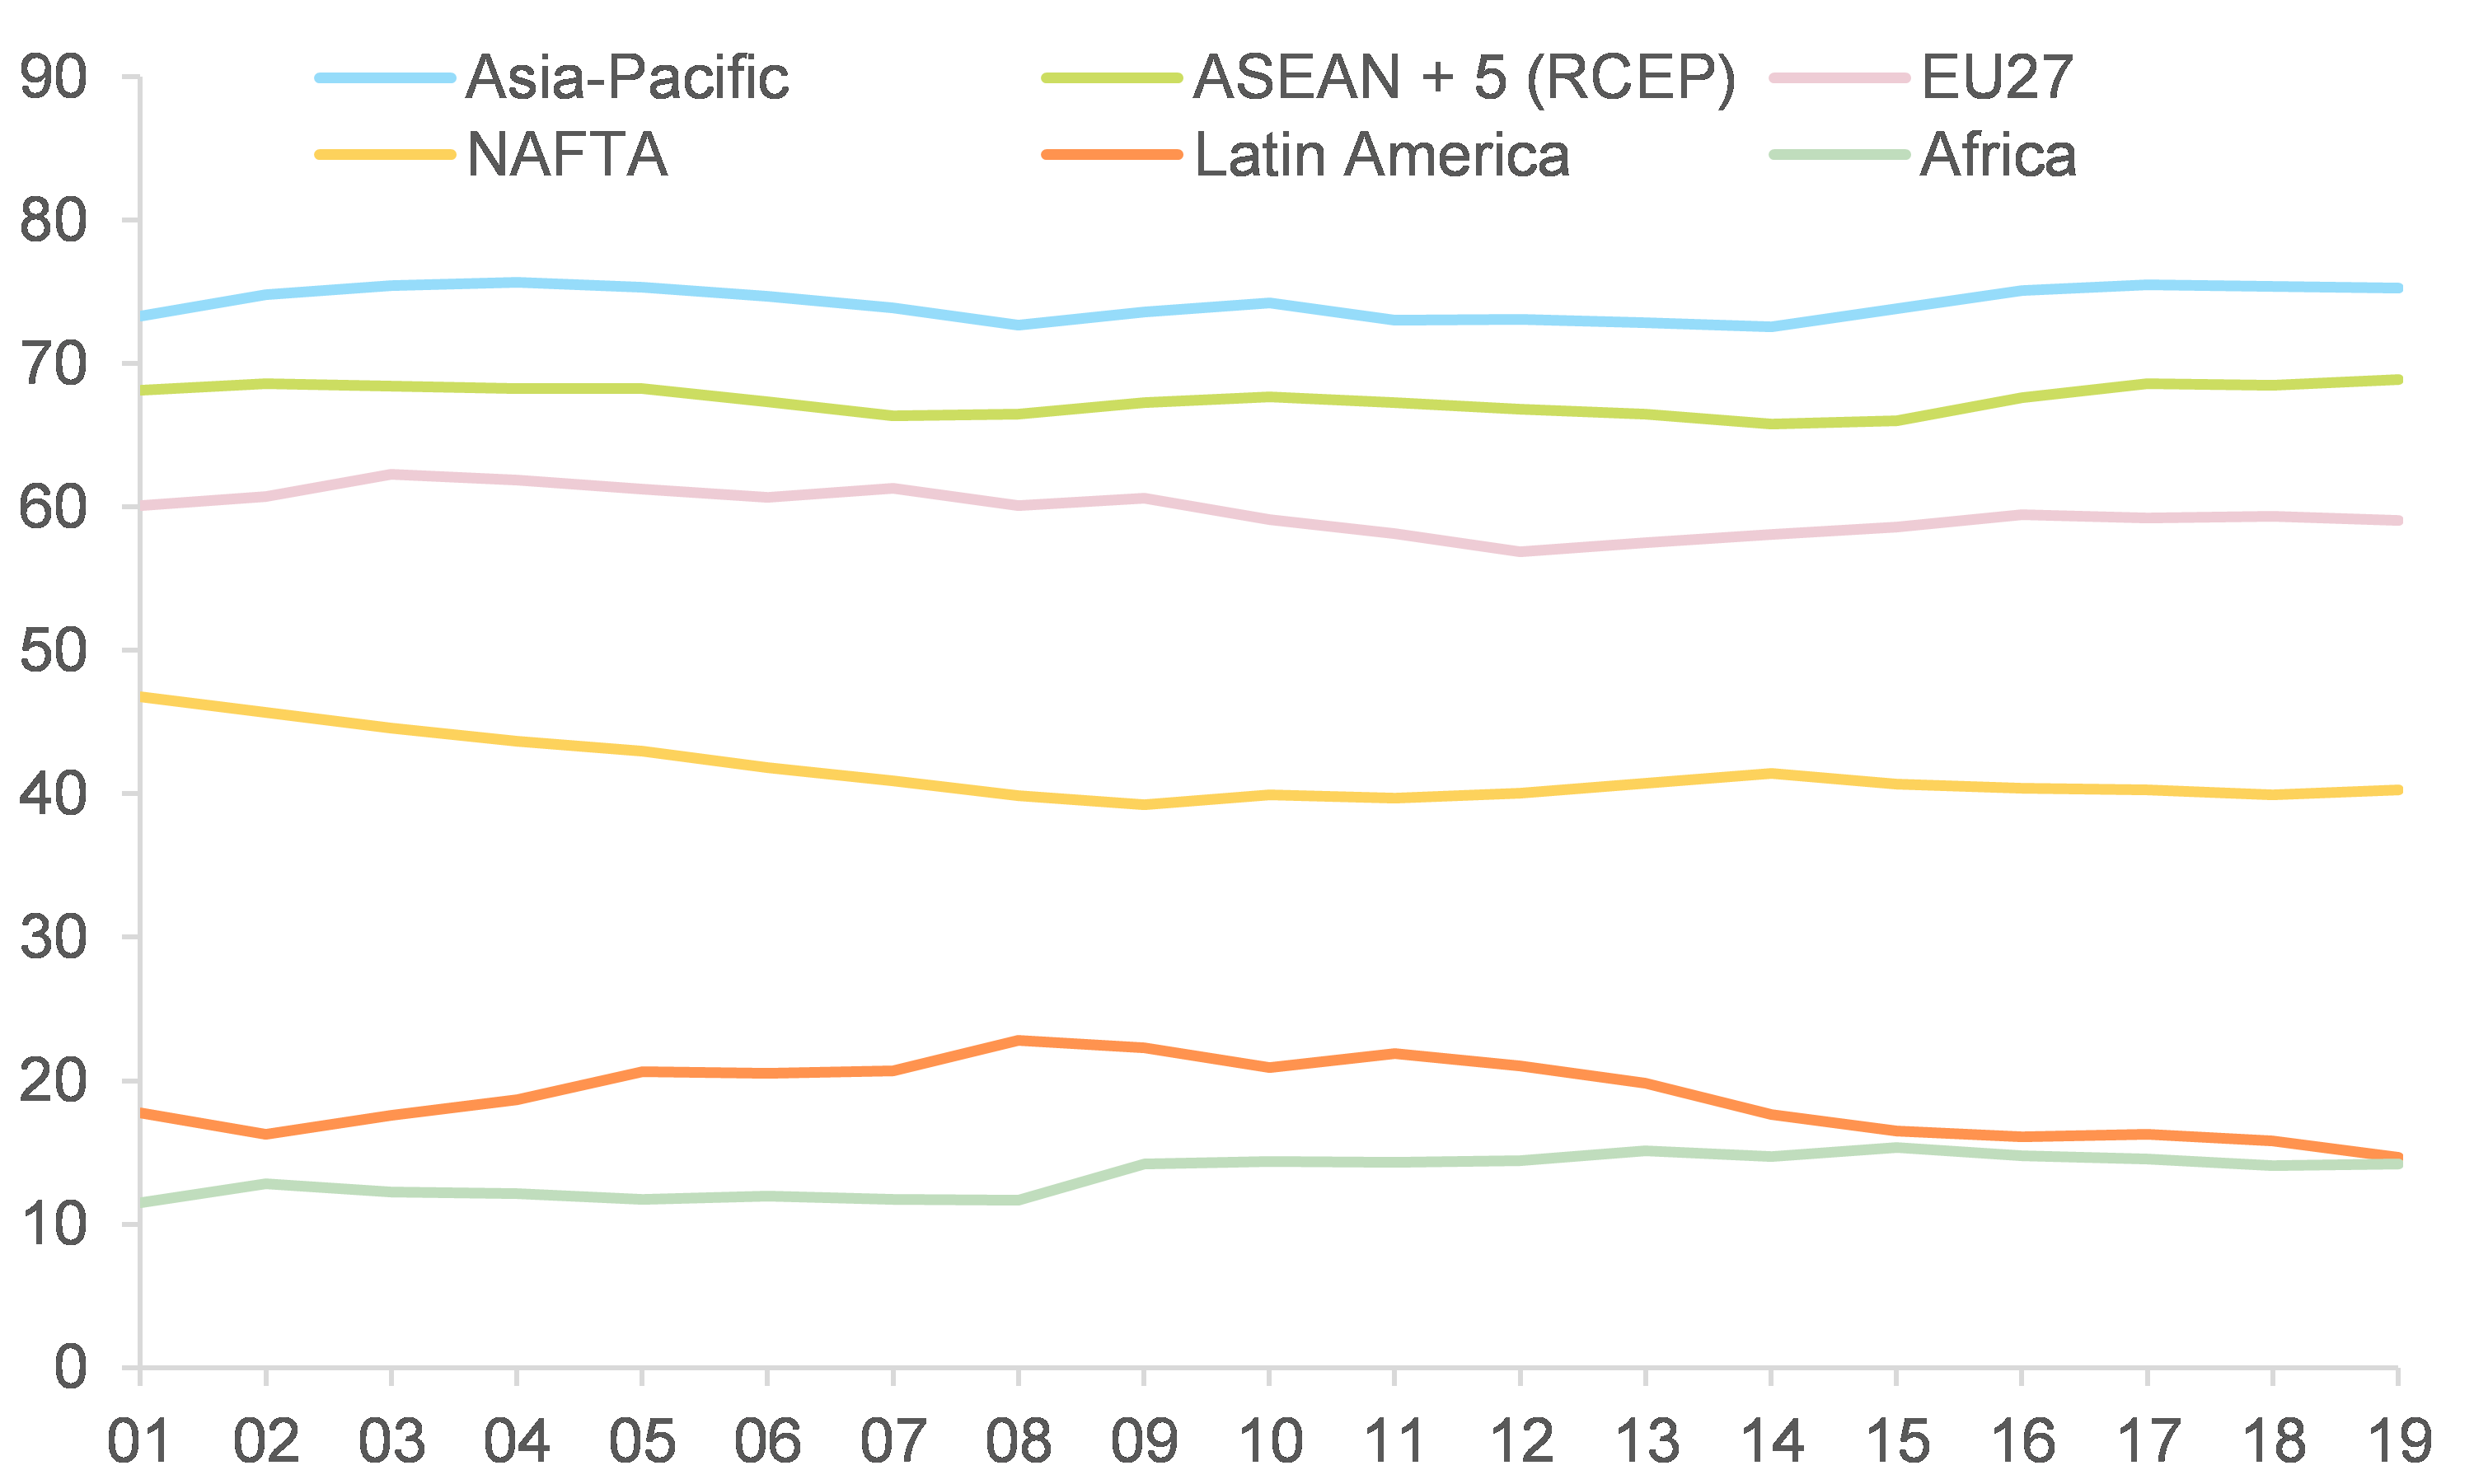
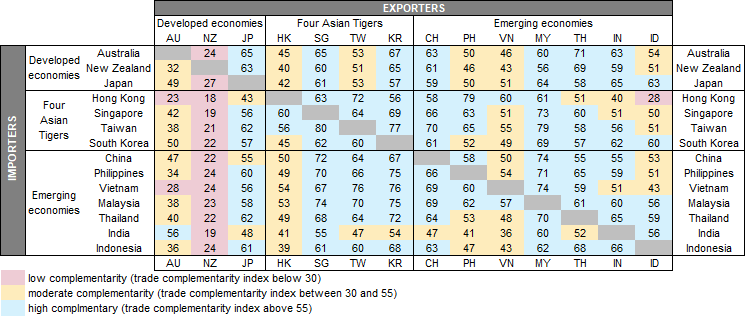
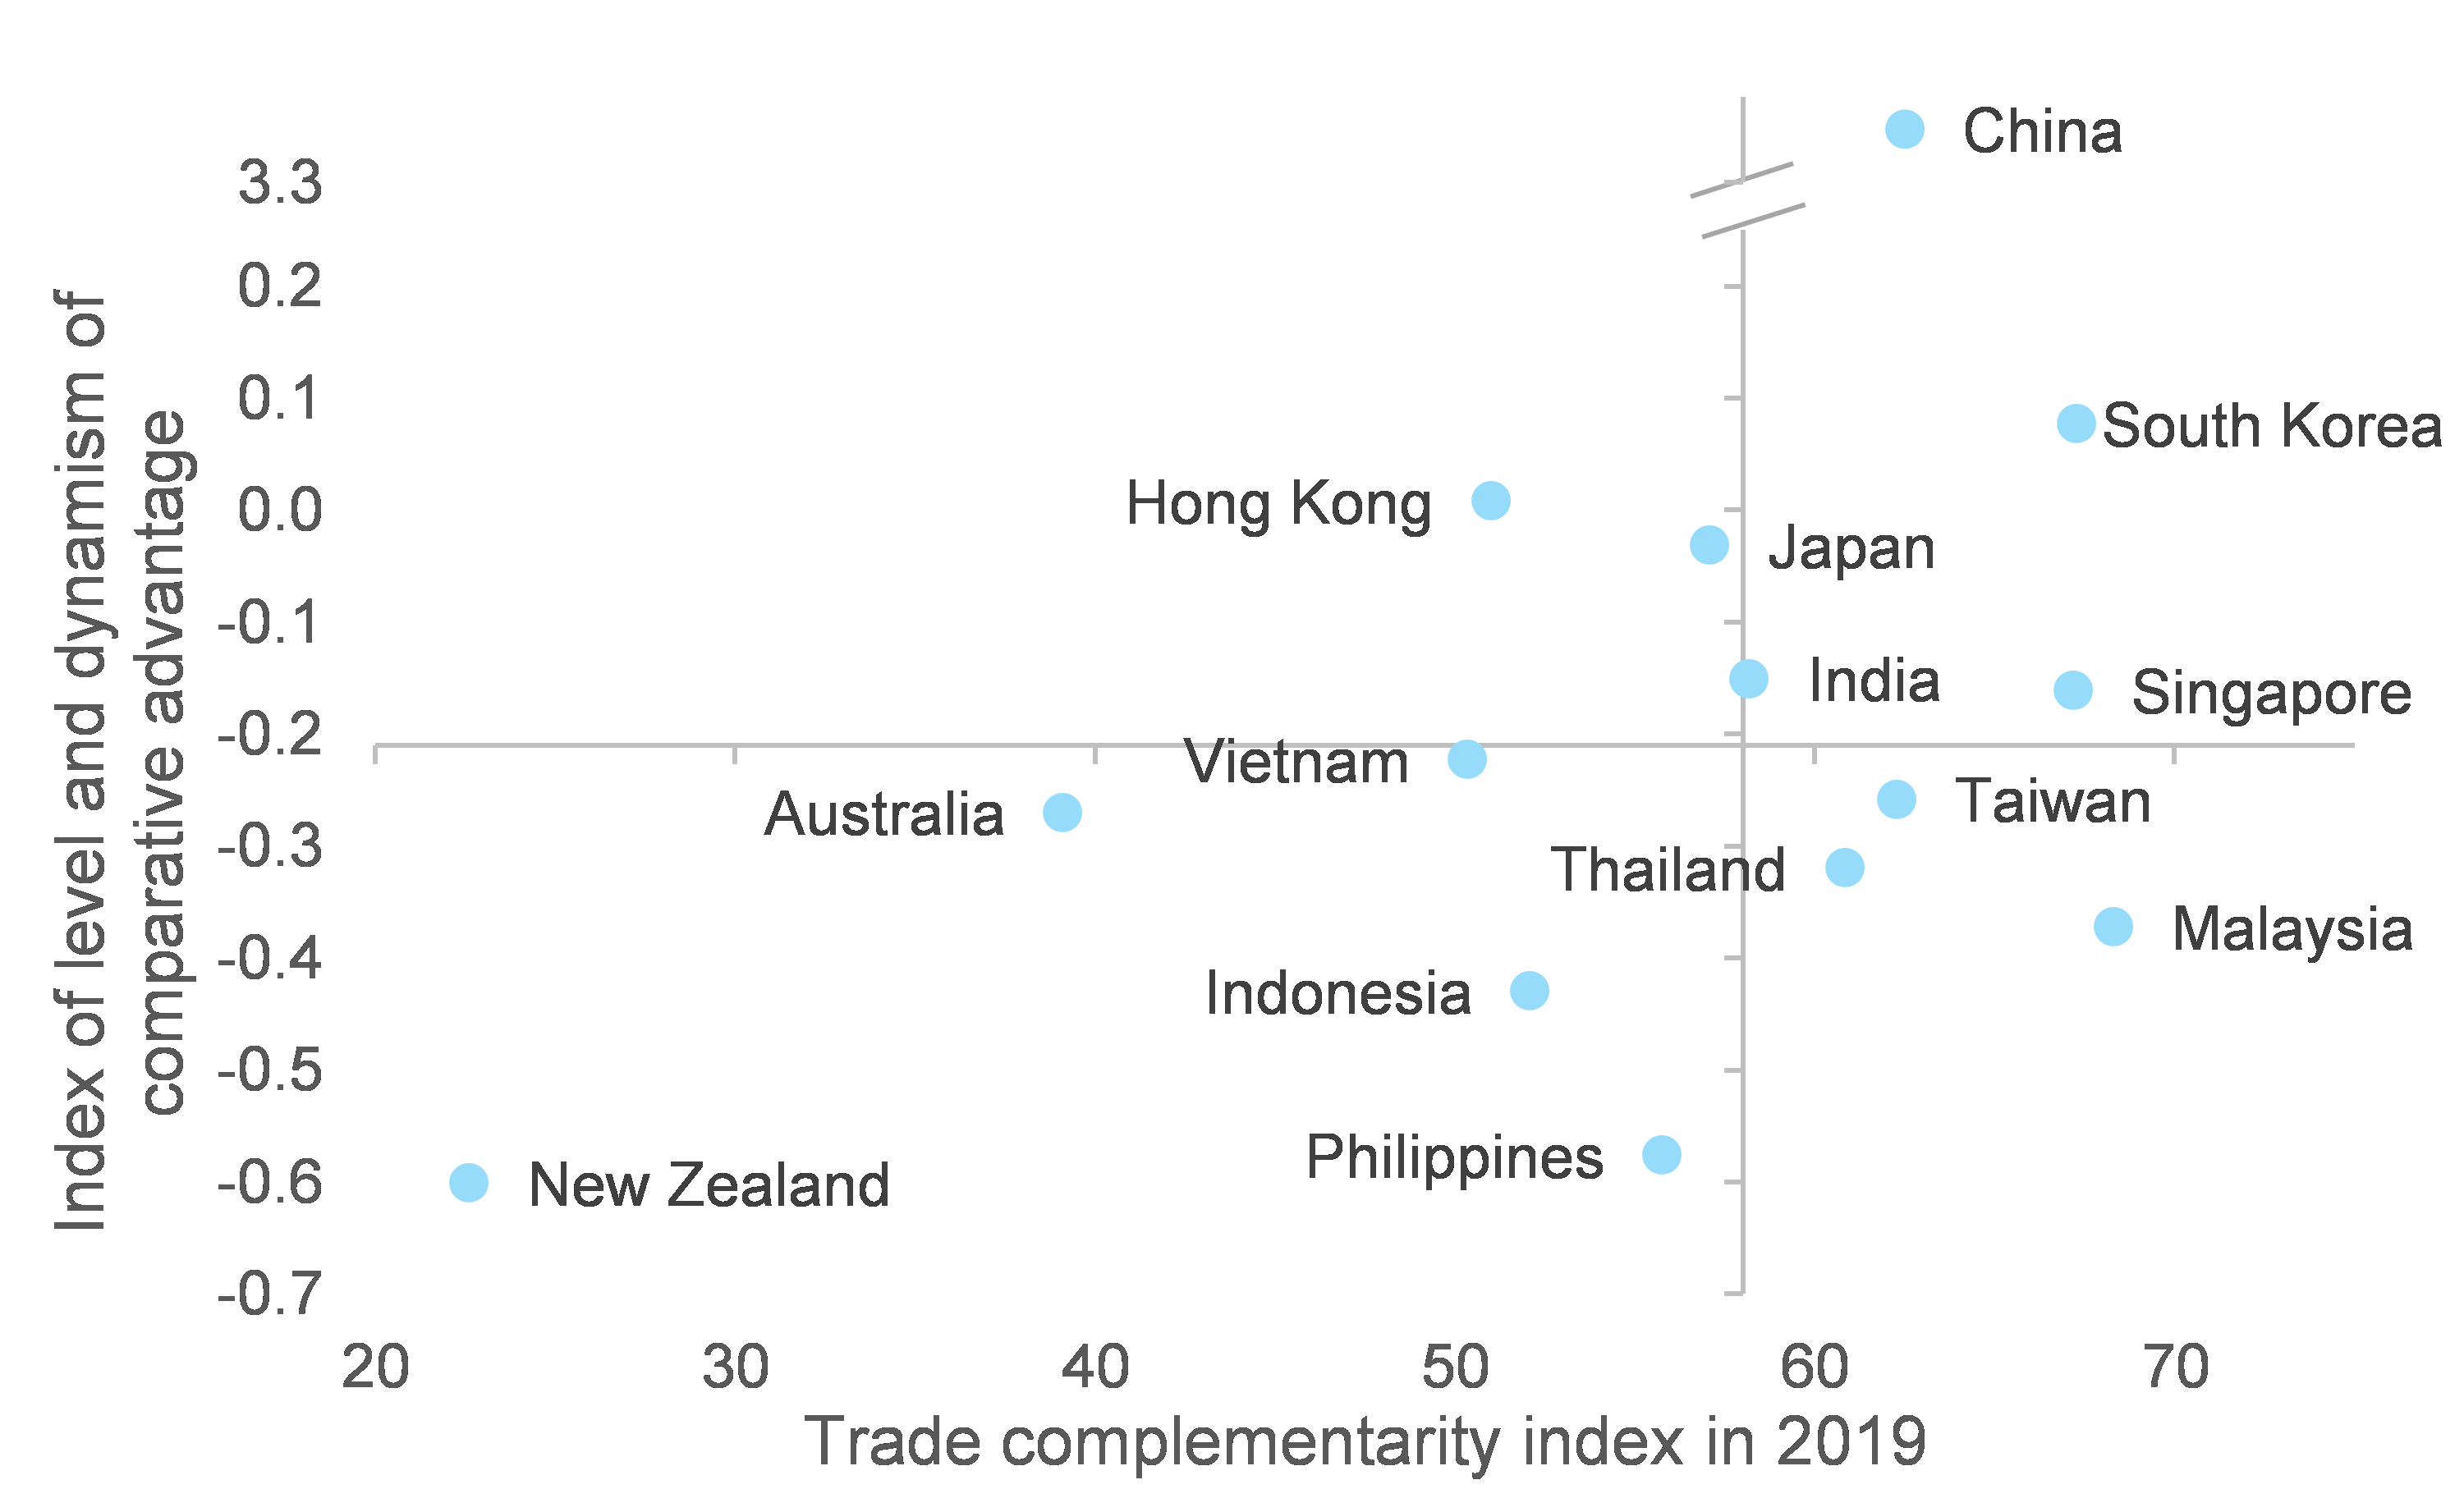
This context, along with free trade agreements, will help strengthen Asia-Pacific trade integration. Intra-regional trade represents a large share of the region’s total trade (74% on average in the 2010s) and the relatively high complementarity between economies’ trade suggests that this situation is likely to be sustained. The recently signed Regional Comprehensive Economic Partnership sends a strong signal in favor of continued and strengthened trade integration in the region.
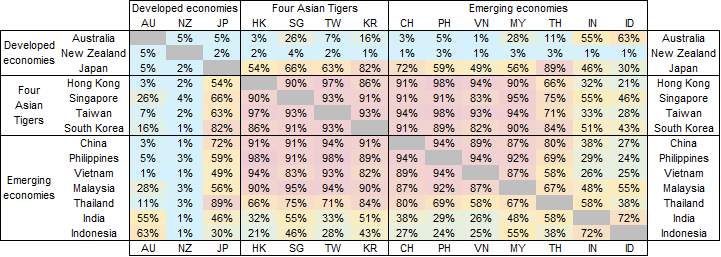
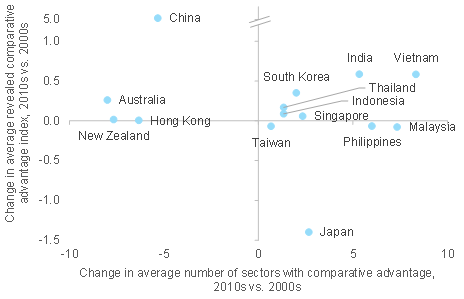
Which countries would benefit most from further regional trade integration? China, South Korea, Singapore and Japan. Looking at export specialization and competitiveness and trade complementarity within the region, we find that exports from China, South Korea Singapore and Japan are particularly competitive and complementary with the rest of the region. China and Japan clearly exhibit higher competitiveness in the most-traded sectors globally.
What does this mean for policymakers and companies? The challenge will be to navigate this gradually shifting balance in the global economy, and more specifically the US-China rivalry. For many economies (e.g. the EU), the aim will be to define a commercial strategy with Asia while preserving the alliance with the US. Companies should pay attention to the potentially differing competitive environments across regions as trade agreements in Asia-Pacific sometimes have less restrictive standards. From a sectoral perspective, expect further trade and investment integration in mechanical appliances and electrical equipment in Asia.  

Over the past few decades, the global balance of economic power has shifted: while developed economies represented around 80% of global GDP in 2000, the ratio fell to around 60% in 2019, with the Asia-Pacific region responsible for 8pp of this 20pp decline. To capture the pace of this shift in the global economy, and identify the impact of the Covid-19 crisis, we computed the position of the world’s economic center of gravity (WECG, see Appendix 1 for methodology). The results are presented in Figure 1.

Three trends stand out: First, it appears very clearly that the WECG has been moving eastwards towards Asia. Our calculations show that in the late 1990s it was going in the opposite direction (towards the U.S.), before stagnating in 2001 and turning around in 2002. These years mark the aftermath of a growth downturn in developed economies, and China entering the World Trade Organization.

Second, the Covid-19 crisis could accelerate this process in the coming years as the Asia-Pacific region is set to recover faster than other parts of the world. Over 2020-2021, the yearly movement eastwards will be roughly 1.8x that observed on average over 2015-19. And compared to the long-term growth paths projected before the Covid-19 crisis, the WECG will be moving eastwards at a 1.4x faster pace over 2020-2024.

Finally, by 2030, based our long-term forecasts, we find that the WECG could be located around the confluence of China, India and Pakistan. This mainly reflects the pull of the Chinese economy on the world, but also to a lesser extent the pull of other emerging economies in Asia (particularly India). Indeed, Asia-Pacific’s regional economic center of gravity is not completely centered on China: From 1998 to 2030, it moves from around the south of South Korea to around the Sichuan province in China (in the southwest of the country, c.1400km from its geographic center).

Figure 1: World economic center of gravity
Blue dots: 1998 to 2019. Orange dots: 2020, 2025 and 2030 on current forecasts. Green dots: 2020, 2025 and 2030 on Q4 2019 forecasts. Grey dots: geographic center of gravity of the U.S., Germany, India, China and Japan.
Figure 1: World economic center of gravity
Sources: Euler Hermes, Allianz Research
The Chinese economy rebounded faster from the unprecedented economic shock caused by the Covid-19 pandemic. GDP grew by +2.3% in 2020; in comparison, we expect the global economy to have contracted by -4.2% in the same period. We also forecast a stronger rebound for China in 2021 (+8.2% vs. +4.6% for the world). An earlier but comparatively smaller epidemic, as well as the swift policy reaction, prevalence of the state sector and some windfall effects explain the outperformance. Indeed, the number of Covid-19 cases per 1 million people in China stands at 64, compared with around 8000 at the global level. High-frequency activity indices also show a shallower trough for the Chinese economy in 2020 (around -50% in early February), compared with other economies (ranging from around -60% to -75% for the US and Western Europe in April). To counter the shock, strong policy support was put in place: We estimate that 2020 fiscal stimulus packages supported China’s GDP growth by +4.1pp, compared with +1.7pp in the US and +1.3pp in Germany. The prevalence of the state sector in China may also have facilitated the implementation of policy measures and the restart of the economy, before the recovery became more broad-based. Data suggest that state-owned enterprises were better shielded  in a context where they were also asked amidst the crisis to maintain economic activity and retain employment (even if unprofitable). Finally, China was also able to reap the benefits of being the economy first in and first out of the epidemic, with strong export performance and expansion of its global export market shares (more details in our previous publication here).

With the economic recovery strengthening and becoming more broad-based, China already started to dial back monetary policy support in Q4 2020. In turn, credit growth slowed in Q4 2020. The aim is to introduce discipline in capital markets (specifically the corporate bond market) in order to control long-term financial risks. This implies that on the topic of policy normalization and long-term legacies, China is also one step ahead of the rest of the world, where most policymakers are still in full easing mode.

The outperformance of the Chinese economy and likely fewer scarring effects pave the way for it to be positioned as a relative winner in the post Covid-19 world. We estimate that China may be gaining two years over developed economies compared to the pre-crisis long-term growth path (see Figure 2). More specifically, we now expect China’s GDP to match that of the US in 2030, instead of in 2032 based on our forecasts before the Covid-19 crisis. The catch-up with the US in 2020-21 is likely to occur at a yearly pace that is more than 2.5 times faster than the average over 2015-19. In nominal terms (current USD), the ratio of China’s GDP over US GDP stood at 67% in 2019, up from 61% in 2015. We now expect the ratio to reach 75% in 2021. This compares with a ratio of 71% based on forecasts at the end of 2019 (before the global pandemic).

Figure 2: Ratio of China-to-US nominal GDPs, pre and post Covid-19 crisis
Sources: National sources, IMF, Euler Hermes, Allianz Research
Of course, this long-term path is not without potential hurdles: The prevalence of the state sector could raise long-term risks of overcapacity, increasing debt, zombification and slow technological advancement (see our previous publication here). Chinese authorities are trying to tackle these structural risks and planning for the long term with the 14th five-year plan (2021-2025) and the 2035 vision. The dual circulation strategy reaffirmed that one of the main ultimate goals is to reach industrial autonomy (by boosting the domestic market and R&D and reducing reliance on imports), while liberalizing trade and capital flows along the way to get there.
Economic and trade integration in Asia-Pacific in the post Covid-19 world can be boosted by further free trade agreements, and the shift of the global economic balance in favor of the region, which encompasses several global growth powerhouses. Intra-regional trade in Asia-Pacific is already very high compared to other regions, with the ratio out of the group’s total trade averaging 74% in the 2010s (see Figure 3). Asia-Pacific economies also on average exhibit relatively strong levels of complementarity with their regional trade partners (see next section and Appendix 3). Out of total global trade, intra-regional trade in Asia-Pacific is also large, representing 25% on average in the 2010s, compared with 17% and 6% for the EU27 and NAFTA, respectively.

Figure 3: Intra-regional trade shares (%)
Note: ASEAN + 5 encompasses the ASEAN countries, Australia, China, Japan, South Korea and New Zealand, the signatories of the Regional Comprehensive Economic Partnership (RCEP).
Sources: International Trade Center, Euler Hermes, Allianz Research
The Regional Comprehensive Economic Partnership (RCEP) signed between ASEAN + five countries in November 2020 sent a strong signal in favor of continued and strengthened integration in the region. In particular, we find that the common rule of origin could boost intraregional trade by around USD90bn annually (see here for more details). Furthermore, less restrictive rules in the RCEP compared to other free trade agreements could imply less impediments for trade exchanges within the region. There are no provisions for environmental and labor standards, which are always included in negotiations involving the US and the EU. Another example is that in the common rule of origin established by the RCEP, only 40% of regional content is required for goods to be considered of RCEP origin. As a comparison, the US-Mexico-Canada Agreement signed in 2018 establishes a threshold of 75%, with on top of that a labor value content rule (40-45% of content must be made by workers in the region earning at least USD16 per hour).

Separately, the RCEP could potentially pave the way for discussions on further free trade agreements. It is the first trade deal to cover the China- Japan and Japan- South Korea bilateral relationships, and the most optimistic expectation would be around settling the China-Japan-South Korea free trade agreement. Negotiations for the deal started in 2012 but sporadic bilateral tensions have prevented decisive progress. In early November 2020, Chinese president Xi Jinping promised to “speed up negotiations on a China-EU investment treaty and a China- Japan- South Korea free trade agreement“.  

Despite the stronger trade integration expected for Asia-Pacific as a whole, economies in the region are not equally positioned to reap the benefits. To determine which economies could be set to outperform, we look at 1/ exports specialization and competitiveness and 2/ trade complementarity within the region. We find that China, South Korea Singapore and Japan could benefit the most from further trade integration within Asia-Pacific.

To measure and compare each economies’ export potential, we built sectoral comparative advantage indices (see Appendix 2 for the methodology). We then looked at correlations by country pairs in order to compare export competitiveness and structures (see Figure 4). Several results stand out:

  • Developed economies Australia, New Zealand and Japan to a lesser extent – exhibit export competitiveness profiles that are particularly different from most other economies in the region. This implies sectoral specialization patterns for these countries that are relatively unique in the region. For Australia and New Zealand, exports are comparatively more exposed to commodities. For Japan, the comparative advantage is very high in the vehicles and machinery sectors. The average comparative advantage index is also notably higher than in other economies (except for China).
  • India and Indonesia exhibit profiles that are relatively similar, with low correlation with most other economies in the region. This reflects the fact that their exports are geared towards both commodities and (low value-added) manufactured products. Between the two countries, India has been improving export competitiveness faster in the past few years (see Figure 5).
  • Four Asian Tigers and the rest of emerging Asia. The export competitiveness profiles of the Four Asian Tigers are similar and close to those of China, the Philippines, Vietnam and Malaysia (and Thailand to a lesser extent). This suggests both supply-chain integration across these economies, and competition.

An over-time comparison (see Figure 5) shows that Vietnam and South Korea seem relatively more competitive in this group as they managed to both increase the number of sectors in which they have a comparative advantage and raise their outperformance. China, in part thanks to the size of its economy, exhibits significantly higher comparative advantage in the most traded sectors globally.

Figure 4: Correlations of sectoral comparative advantage indices in 2019, by country pairs

Figure 4: Correlations of sectoral comparative advantage indices in 2019, by country pairs
Sources: International Trade Center, Euler Hermes, Allianz Research
Figure 5: Over-time change in sectoral comparative advantage in Asia-Pacific
Sources: International Trade Center, Euler Hermes, Allianz Research

On top of competitiveness, it is also important to find out how much economies’ export structures (by sector) match their trading partners’ import structures. To that end, we built trade complementarity indices (see Appendix 3 for the methodology). The results by country pairs are presented in Figure 6. Looking at the same groups as in the previous paragraph, the following results stand out:

  • Developed economies continue to differ from the rest of the region, in particular Australia and New Zealand. Indeed, they exhibit on average the lowest trade complementarity indices in the group. For Japan, the average trade complementarity index is in the median of the group. Along with a strong comparative advantage in a few highly-traded sectors, this puts the country in a comfortable position to benefit from trade integration.
  • India and Indonesia exhibit again relatively similar trade complementarity profiles, with India outperforming slightly again (average trade complementarity index of 58 vs. 52 for Indonesia). Despite this potential within the region, India is not among the signatories of the RCEP and has seen the share of its trade with Asia-Pacific out of total trade stagnate (around 33%) in recent years.
  • Four Asian Tigers and the rest of emerging Asia. While these economies have similar export competitiveness profiles, their trade complementarity patterns differ. The relative country exposures are somewhat consistent but South Korea, Malaysia and Singapore stand out as the top three economies with the highest trade complementarity indices on average. Within this group, Vietnam has the lowest average index .  

Figure 6: Trade complementarity indices in 2019, by country pairs
 

Figure 6: Trade complementarity indices in 2019, by country pairs
Sources: International Trade Center, Euler Hermes, Allianz Research
Finally, we cross the two sets of indices of comparative advantage and trade complementarity on Figure 7. We find that China, South Korea Singapore and Japan would benefit the most from further regional trade integration. New Zealand, Australia, the Philippines and Indonesia are comparatively less well positioned.

Figure 7: Trade complementarity vs. Comparative advantage
Note: axes are crossing at the respective median values of the two sets of indices.
Sources: International Trade Center, Euler Hermes, Allianz Research

The shifting world economic center of gravity has far-reaching long-term consequences on everything from global soft power to global policy formulation to the global monetary system: these are also likely to gradually move in favor of Asia in the coming decades. The challenge for policymakers is to navigate such a change, and the US-China rivalry in particular. For the EU, for example, the aim would be to preserve its alliance with the US, while also defining a commercial strategy that benefits from Asia’s rising importance and regional integration. The Japanese experience suggests that a balance can be found as the country has trade deals with both China and the US and at the same time retains a security alliance with the US. The EU-China Comprehensive Agreement on Investment signed in December 2020 probably reflects the EU’s intention to define its own position amidst the US-China rivalry.

Similarly, companies will also need to position themselves to benefit from the shifting world balance and greater trade integration in Asia. Trade agreements signed in the past few years and negotiation pain points suggest that different provisions regarding environmental and labor standards and state subsidies will be likely across regions. Companies will need to take into account these divergences, which imply different competitive environments.

From a sectoral perspective, the RCEP and greater trade integration in Asia could lead to a further specialization of countries along lines of comparative advantage (see Figure 7 for the top five sectors per country). For Australia and New Zealand, the comparative advantage is mostly found in the commodities and food sectors. Japan shows the highest comparative advantage by far in the region in motor vehicles. It is also competitive in the mechanical appliances and electrical equipment sectors, which involve scattered supply chains across the region. Indeed, these are the top sectors of comparative advantage for the Four Asian Tigers, China, the Philippines and Thailand, so the RCEP could foster continued trade and investment integration.

Figure 8: Top five sectors of comparative advantage, by country (2019)

Figure 8: Top five sectors of comparative advantage, by country (2019)
Sources: International Trade Center, Euler Hermes, Allianz Research