Executive summary
- Over the long run, the Chinese economy is facing two key challenges: declining potential growth and a deteriorating external environment. Our growth potential model suggests China’s GDP growth is likely to average between +3.8% and +4.9% over the coming decade (after +7.6% in the 2010s), due to declining labor supply and slowing productivity and capital investment. Meanwhile, China is also bracing for a long-term standoff with the U.S., which is currently its top export destination and the most innovative country at the global level. Looser economic ties with the U.S. will thus pose additional risks to China’s slowing economy.
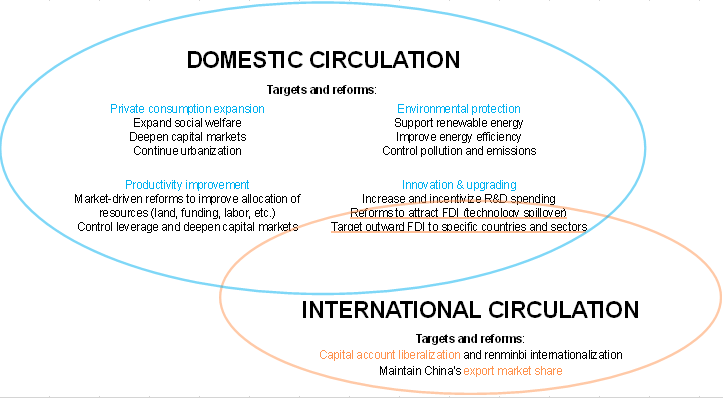
- In this context, the “dual circulation” strategy is likely to take center stage in China’s 14th five-year plan as a way towards more sustainable growth, making the country less reliant on factors outside of its control. First introduced by President Xi Jinping in May 2020, this strategy prioritizes “domestic circulation” (increasing domestic demand and lowering dependence on foreign inputs), while “international circulation” (maintaining export market shares and liberalizing capital flows) works as a complement. While rebalancing towards domestic demand is not a new principle in China’s economic planning, China will aim in the long run to use domestic production to provide for increasing domestic demand, rather than imports.
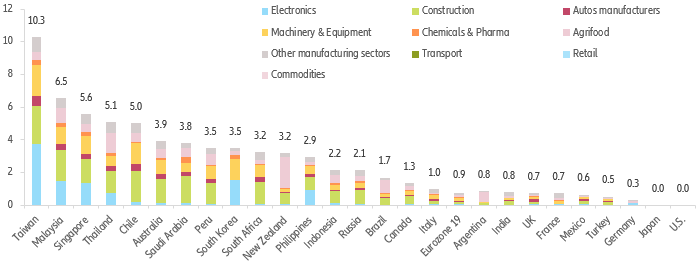
- Taiwan, Malaysia, Singapore, Thailand and Chile are set to incur the most potential losses in the medium run as China moves towards industrial autonomy. Conversely, goods from the U.S., Japan and Germany are exposed to very limited risk of being substituted by Chinese goods in the medium term, thanks to their technological advancement. Losses for the Eurozone overall could amount to up to 0.9% of GDP in the medium run, with machinery & equipment, construction, agrifood and electronics the most exposed sectors.
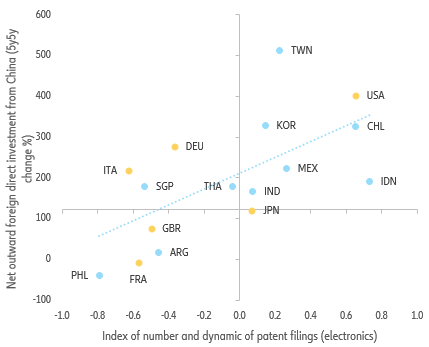
- China is likely to increase direct investment into innovating emerging economies, such as the electronics sector in Indonesia, India, Thailand, Mexico and Chile. Chinese outward investment has slowed but not stopped in the past years, and the Belt and Road Initiative remains part of Chinese authorities’ long term vision. Implementation challenges (e.g. related to financial risks) mean that Chinese policymakers are likely to aim for outward direct investment to be more disciplined around national economic targets (e.g. industrial autonomy).
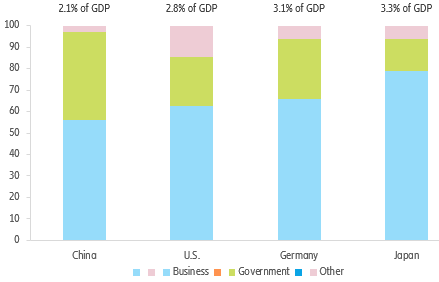
- Long-term risks include rising debt, zombification and slow technological advancement. China’s R&D spending relies far more on government funding compared to the U.S., Japan and Germany. Strong government intervention could risk leading to overcapacity issues and resource misallocation towards the overall less profitable and less innovative state-owned enterprises.
Declining growth and external hardships
The fifth plenum of China’s Communist Party Central Committee draws to a close on 29 October 2020 after four days of discussions partly focused on the 14th five-year plan, which will define the economic policies and targets for 2021-2025. The details will be finalized and made public in March 2021 but we expect the “dual circulation” strategy, first introduced by President Xi Jinping in May 2020, to take center stage. This strategy aims to respond to two key challenges that China is facing in the long term: declining potential growth and a deteriorating external environment.
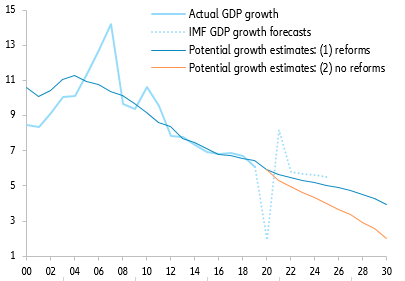
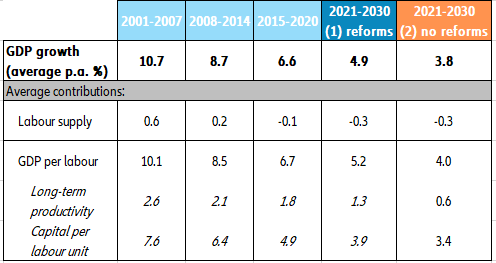
The Chinese economy has been on a declining trend over the past decade, with GDP growth averaging +7.6% in the 2010s, compared to +10.3% in the 2000s. The downward trend is likely to continue in the coming years as China deals with structural issues, including capital misallocation, overcapacity and an aging population. However, policy measures such as reducing debt levels (of firms and local governments), boosting labor mobility and human capital and upgrading the manufacturing base should help cushion the decline in China’s capital and productivity growth. As such, using our proprietary model for potential growth, we have devised two scenarios, with (1) successful structural reforms and (2) no or unsuccessful structural reforms (see Figure 1). In both scenarios, the negative contribution of the labor supply will deepen as a result of the aging population and expected low fertility rates. Capital growth and productivity growth are set to decline less in scenario (1). Overall, potential growth over 2021-2030 should average +4.9% in scenario (1) and +3.8% in scenario (2) (see Figure 2).
Figure 1: China GDP – actual growth, forecasts and potential growth estimates