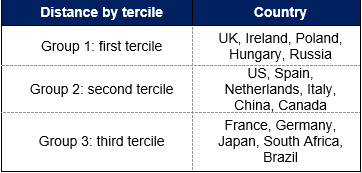
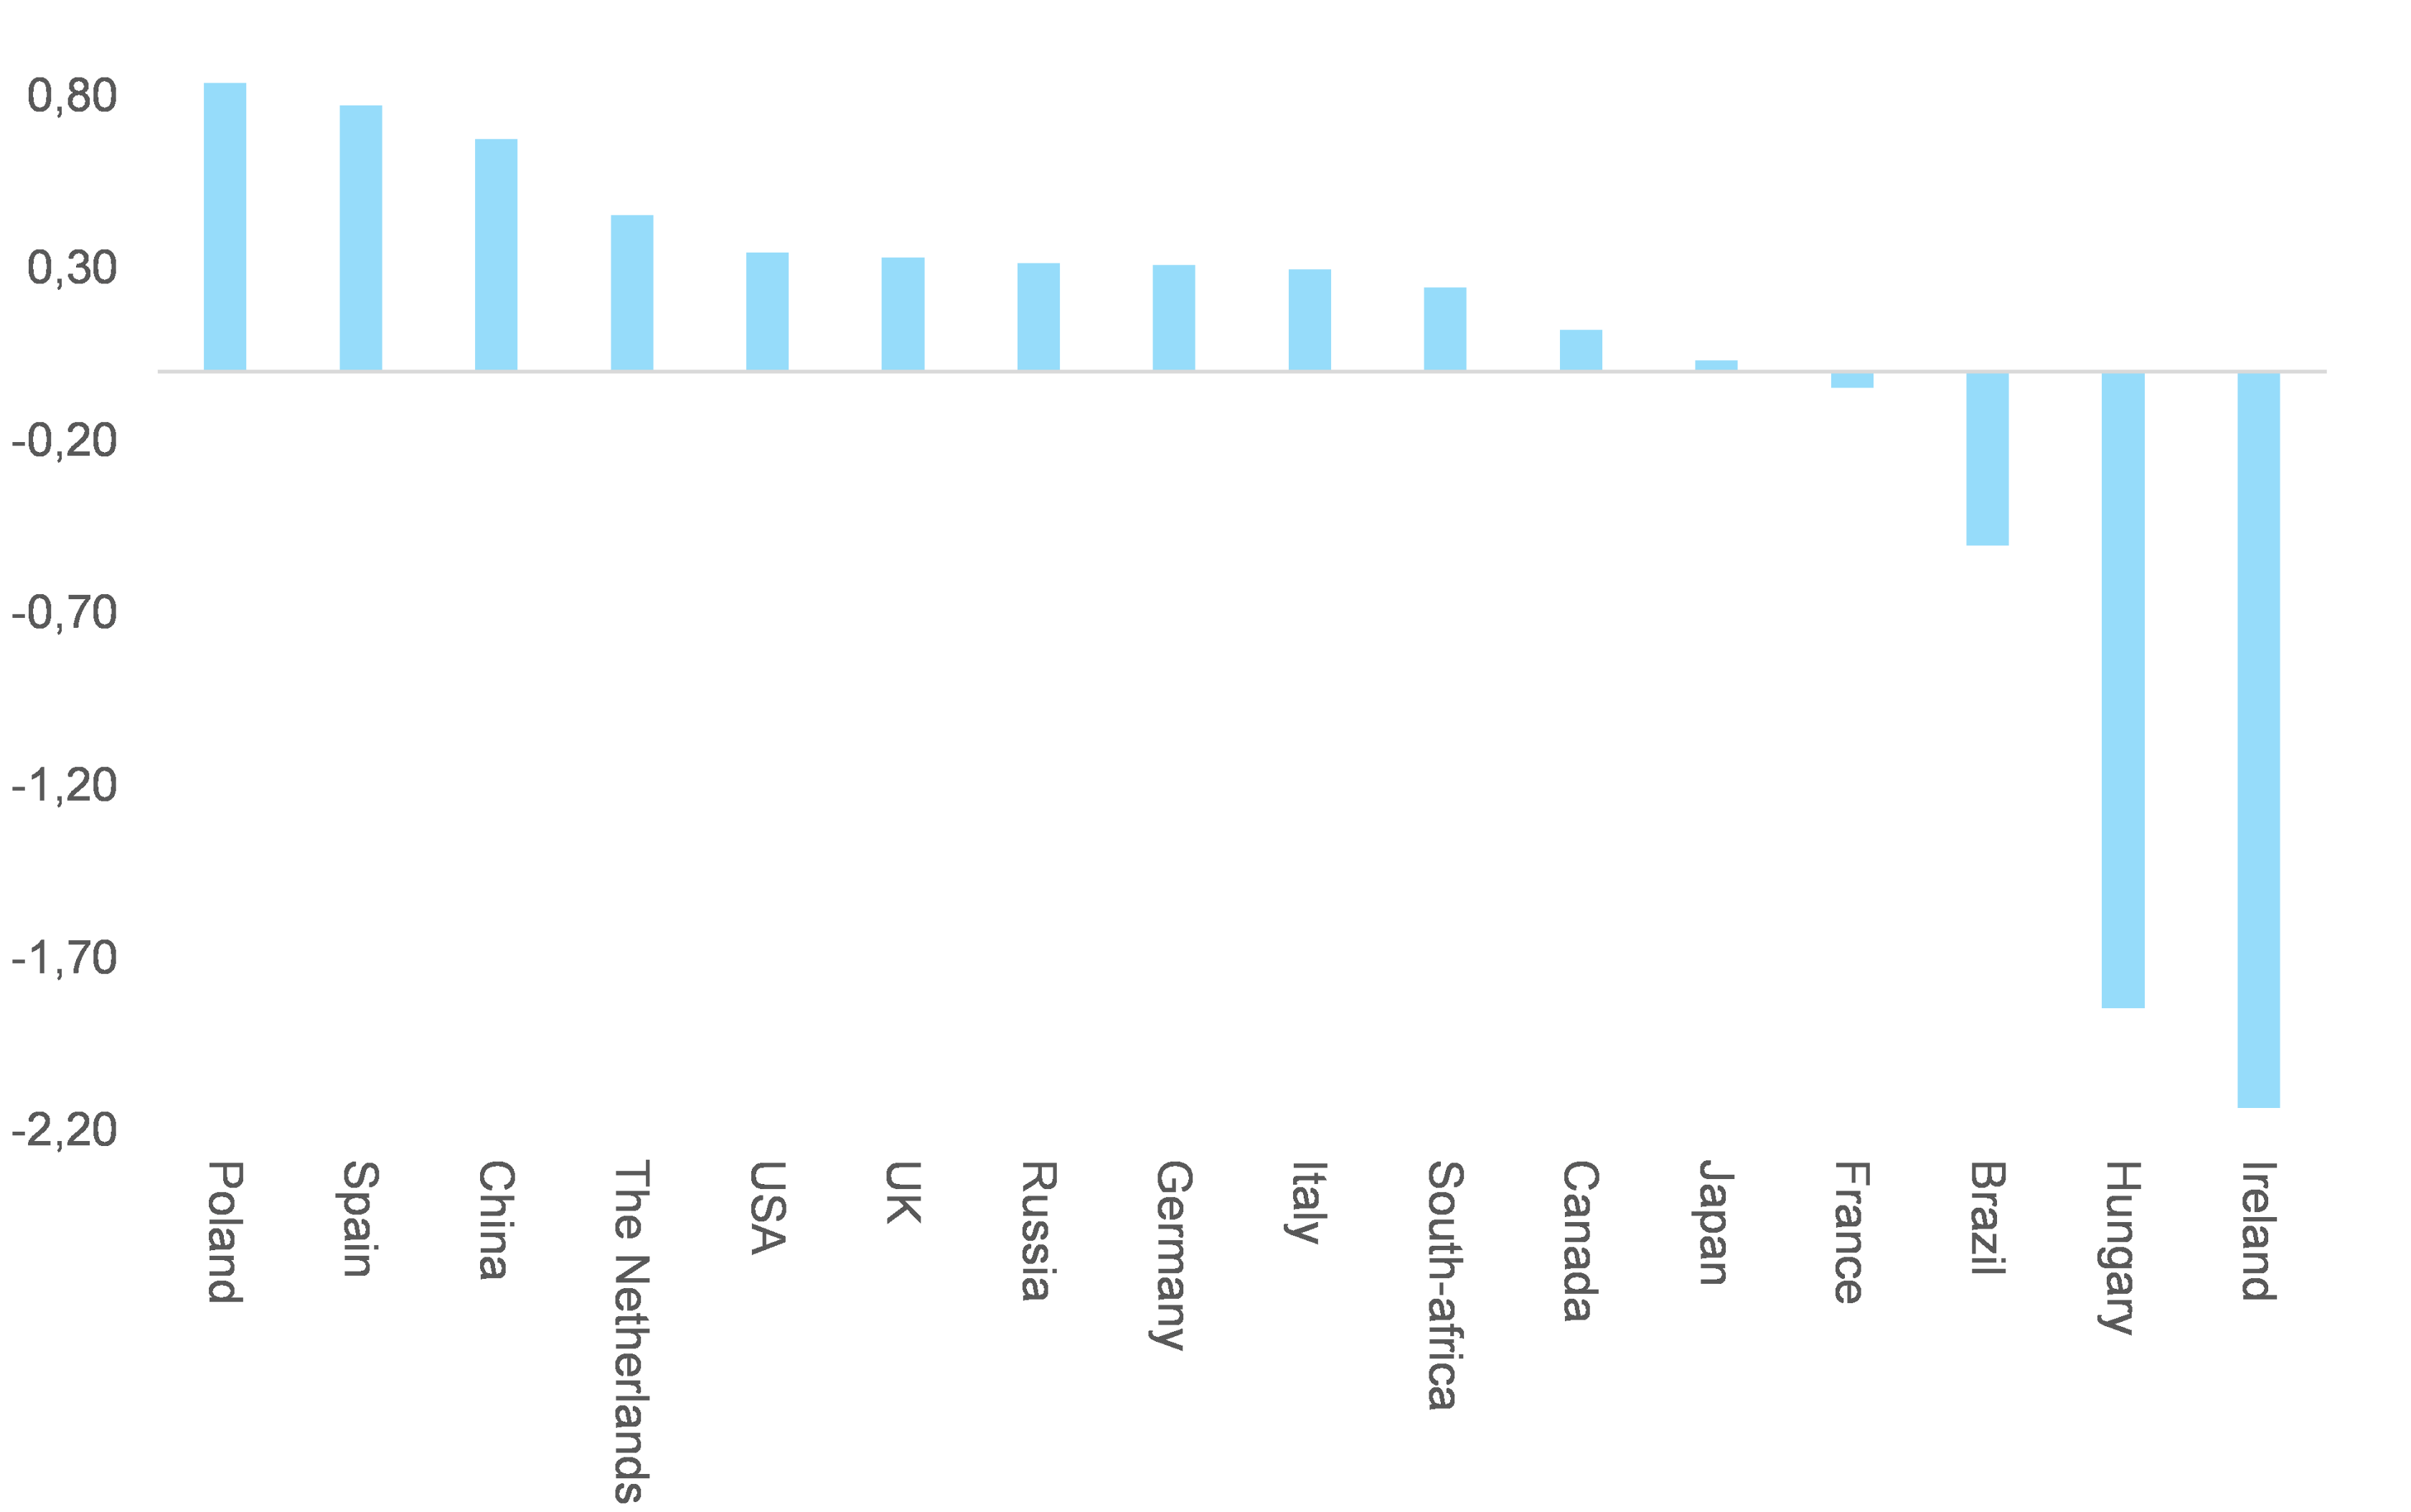
Ahead of the G7 summit this weekend, we looked into who will win and who will lose from the recently proposed global minimum tax rate of at least 15% for companies. Among large Base Erosion and Profit Shifting (BEPS) countries for which data was available, we find that Poland, Spain, China, the Netherlands are clear winners; the US, the UK, Russia and Italy are relative winners; France, Japan, and Canada are neither winning nor losing and that Ireland, Brazil and Hungary are clear losers from the deal. The G7’s decision has initiated a crucial negotiation process, which will include a virtual meeting of more than 130 nations on 30 June to agree on changes proposed by the OECD in relation to global taxation under the umbrella of the BEPS initiative. Next, a G20 summit will be held in Venice on 09 July for the endorsement of these agreements and then a possible sign-off is expected in October 2021 during another G20 meeting. In the meantime, and given the US’s endorsement of the OECD’s proposals, tense debates and negotiations emerged in countries such as Mexico (necessity to reduce tax loopholes), Ireland (necessity to increase the 12.5% corporate tax rate), Hungary and the UK (proposal of excluding financial activities from the agreement).

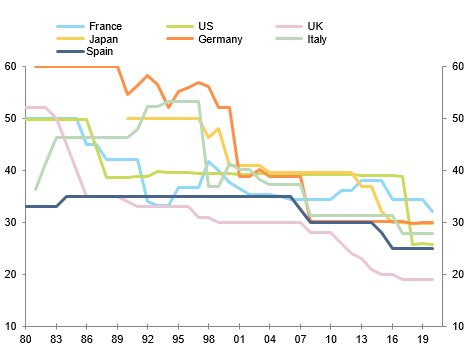
The BEPS initiative aims to reverse the long-term decline of the statutory corporate tax rate (Figure 1) in the context of the Covid-19 crisis, which induced a sharp rise in global public debt and therefore created a huge need to find new fiscal resources.

Figure 1 – Statutory corporate tax rates (%)
 Figure 1 – Statutory corporate tax rates (%)
Sources:  OECD, Allianz Research.

Though the eventual implementation of this agreement will take a long time because of ratification issues, the initiative represents a unique moment of global fiscal convergence. In the long run, the global minimum tax rate for MNEs could impact economies’ potential growth via different channels:

  • The capital repatriation or productivity growth channel: countries with corporate tax rates below 15% will be less attractive and MNEs could be tempted to repatriate capital into their domestic economy. This repatriation is likely to produce a positive productivity shock in the economy benefiting from it, whereas the country seeing a capital outflow will register a negative productivity shock with long-term consequences.
  • The terms of trade channel: countries benefitting from capital repatriation will also reinforce their capacities of production and therefore reduce their dependency on imports (the inverse for countries with tax rates below 15%, which could face a higher dependency on imports).
  • The public debt channel: capital repatriation will contribute to reinforce the growth potential of economies that see capital flowing back home. This will create new fiscal resources and contribute to reduce the level of debt as a percentage of GDP, or at least reduce its pace of growth. In contrast, countries that see their tax competitiveness deteriorating because of the global minimum tax could find it harder to stabilize their public debt. 
  • The public investment channel or crowding-in/crowding-out effect: countries that gain in competitiveness thanks to this global rebalancing could have a higher incentive to increase the size of public investment as a percentage of GDP, in particular in a context where demand for public goods is expected to rise post Covid-19. This channel of transmission is ambiguous in terms of impact as both crowding-in or crowding-out effects could follow.  We assume a continuation of the five-year trend preceding the creation of the tax.
  • The corporate tax revenues channel or redistribution channel: higher corporate tax revenues as a percentage of GDP could follow a movement of capital repatriation for countries with a corporate tax rate above 15%. Countries with corporate tax rates below 15% will suffer from a lower level of competitiveness and register capital outflows, followed by lower fiscal revenues normally earned from corporate profits of foreign firms.

To identify the winners and losers from this landmark decision, we first estimate the growth potential of a sample of 16 economies (between Q1 1993 and Q4 2020) in function of the growth in productivity, growth of active population, the share of imports in total economy, the share of public investment as a percentage of GDP, public debt as a percentage of GDP and the share of corporate tax-fiscal revenues as a percentage of GDP (see annex 1 for the precise results of our estimates). Next, we study the impact on each variable after a shock, allowing us to take into account the different transmission channels mentioned above.

We assume that the size of the shock on each channel will depend on the gap between a country’s corporate tax rate in 2020 and the 15% level. Consequently, we identify three groups of countries: Group 1 (small distance) has a distance taken in the first tercile of all the distances, Group 2 has medium distance and Group 3 a high distance compared with the 15% threshold (see Table 1, and appendix for full details on other assumptions).  

Table 1: Distance between current corporate tax rate and global minimum tax rate of 15%.

 Table 1: Distance between current corporate tax rate and global minimum tax rate of 15%.
Sources: Allianz Research, Euler Hermes calculation, OECD.
For each channel of transmission, we estimate the impact on growth potential , taking into account different sizes of shocks determined by the distance between the domestic tax rate and the global minimum tax of 15%. In this respect we simplified at the extreme the sensitiveness analysis by saying, for example, that the country being in group 1 (closer distance to the 15% level of tax) would register a 1.5 standard deviation of productivity shock (against 1 and 0.5 standard deviation productivity shock for countries in group 2 and group 3). Our results assume  “all other things being equal” and primarily aim at presenting some elements of sensitiveness (see Table 2) regarding the project for a global minimum tax rate for companies .

Table 2 -  Impact on potential growth due to a global minimum corporate tax rate of 15%
 Table 2 -  Impact on potential growth due to a global minimum corporate tax rate of 15%
Sources: Allianz Research, Euler Hermes calculation.
The majority of our panel with a corporate tax rate above 15% would benefit from such an agreement. However, countries with corporate tax rates below 15% would see their growth potential negatively impacted.

We find that Poland would be the major beneficiary (+0.8pp from a 5-year potential of growth of 3.4%), followed by Spain (+0.77pp from an average potential of 0.7%) and China (+ 0.67pp from an average potential of 6.6%). The US’s potential output would increase by 0.34pp by going from 1.80 on average between 2015-2019 to 2.1. For countries with a corporate tax rate above 25%, such as Japan, France and Brazil, our analysis emphasizes that their potential growth variation gain is lower and almost negligible or even negative in Brazil’s case. For instance, France potential growth variation to set up a 15% minimum corporate tax rate would be near zero (-0.05pp from an average potential of 1.3%). In this context, it is clear why this category of countries insists on raising the proposed global minimum tax rate. In general we consider that an average speed of convergence would be required to reach the new level of growth potential eventually mirroring a new state of competitiveness or attractiveness. In the US case for example, registering a +0.3pp positive shock on the 1.8% potential of growth would require between 2 and 3 years to be fully visible.  

Countries with a corporate tax rate below 15% would largely lose from a global minimum tax rate. Ireland - whose current tax rate is 12.5% - could see its potential growth drop by -2.14pp (from a potential of growth of 5.9%). This major drop should be interpreted with cautiousness but it can give an idea of why Dublin has opposed a European tax harmonization. Likewise, Hungary – whose current tax rate is 9% - could see its growth potential reduced by -1.85pp (from an average potential of growth of 2.9%).