What to watch:
In focus – Policy rate decisions: the end of the beginning or the beginning of the end?
- Ahead of the next round of monetary policy meetings next week, continued banking sector stress raises the question of whether financial stability concerns might alter the policy rate path in the US and the Eurozone, allowing inflation to remain higher for longer. Overall inflation has declined (and more so in the US); however, core inflation is becoming increasingly sticky, especially in the Eurozone where it reached an all-time high of 5.7% y/y in March. Wage pressures increasingly drive higher prices for services. However, the risk of a deflationary shock from bank failures and retrenching credit seems to be getting more serious. As money supply keeps contracting, it is hard to see a relapse of inflation, even though some bumps along the way of normalizing prices cannot be ruled out.
- The steady decline in headline inflation over the last five months (to 6.9% y/y in March) will not be enough for the ECB to abandon its restrictive monetary stance. The continued increase in core inflation will reinforce the ECB Governing Council’s conviction that further rate increases are still needed to prevent (still) strong wage pressures from embedding higher inflation in the economy. We forecast two more 25bps hikes in May and June for a terminal rate of 3.5% (which remains in place until Q2 2024) despite stagnating growth. There is an upside risk of a 50bps hike if the Q1 growth numbers surprise on the upside and spillover risk from the second round of US banking sector stress remains contained.
- The Fed is on track to deliver a 25bps rate hike – the last of this cycle. The unwelcome increase in liquidity – fueled by the banking crisis and the debt ceiling drama – gives the Fed even more reason to keep rates high for the next few months before a pivot later this year (-25bps in November and -50bps in December) to 4.5% from a peak of 5.25%.
Global trade – A recession followed by a very mild recovery
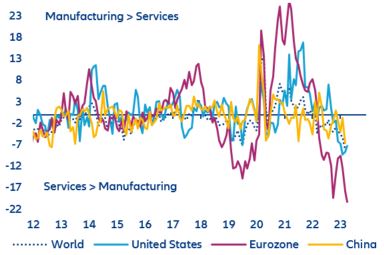
Recent data releases suggest that global demand has started Q2 2023 better than expected – but that is mostly driven by (consumer) services, with limited help for global trade. First estimates of PMI surveys for April 2023 pointed to the fastest pace of monthly growth for developed economies taken together in nearly one year. However, the details show a very unbalanced picture, with this growth almost entirely being driven by services – particularly consumer services (travel and tourism). Indicators for demand are still in contraction in the manufacturing sector, while they signal expansion in services – a diverging situation that started to emerge last summer and has been intensifying since (Figure 1). In China as well, the rebound in private consumption since the start of the year is clearly more visible in services
. Services consumption is more domestic in nature than for goods, with the former accounting for 20-25% of global trade in goods and services.
Figure 1: Indices of demand growth (new orders and backlogs), difference between manufacturing and services
Sources: S&P Global PMI, Allianz Research
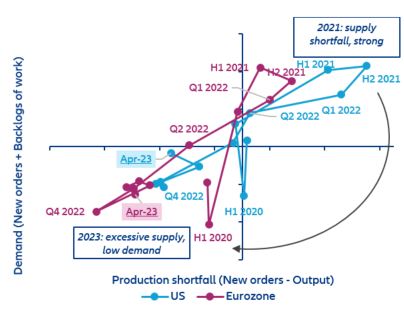
The global manufacturing sector is still facing weak demand and oversupply, depressing trade flows for goods which went back to the level of October 2021. Early data for April show that in the US and Eurozone, demand in the manufacturing sector remained in contraction territory and output continued to be in excess of new orders (Figure 2). While the rate of slowdown in demand is not deteriorating further, suggesting that we may be close to a trough, there are at this stage no signs of an imminent recovery. Indeed, even if inflation seems to have peaked and interest-rate hiking cycles are likely to soon draw to a close, the real economy has not fully digested their negative impacts yet. This means that manufacturers are likely to continue to struggle amid weak demand. In this context, global trade of goods should also remain soft in the near term. The most recent data show that in volume terms, as of February 2023, there has been a nearly -4% decline from the recent peak of August 2022, bringing global trade of goods back to the level of October 2021. The trend is similar when we look specifically at developed economies’ imports, with a slightly larger decline from the peak of -5.3%. We also note that the decline for global trade of goods in value terms has been larger (-7% from the recent peak of June 2022), suggesting a correction in prices in the context of normalizing supply chains.
Figure 2: Manufacturing supply-demand clock
Sources: S&P Global PMI, Allianz Research
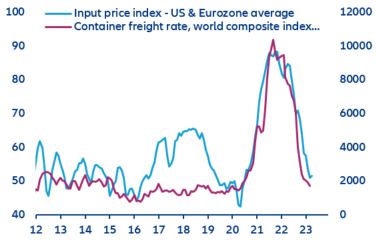
Global supply chains and container freight rates continue to normalize. Replenished inventories, increased production capacities and weakening demand mean that the global manufacturing has overall been rid of supply-chain disruptions and input shortages since the second half of 2022
. The latest data confirm that this trend of normalization (or even manufacturing oversupply) are putting downwards pressure on the cost of traded goods (Figure 3). In April, the average input price index for
the US and the Eurozone stayed near its lowest point since July 2020. The average suppliers’ delivery-times index improved to its best level since data became available in 2007. As of March, global container freight rates declined by nearly -85% since the peak reached in September 2021, standing now just roughly +20% above the 2019 average level. Some routes are now roughly back to their pre-pandemic costs (such as Asia to North America).
Figure 3: Manufacturing input-price index and container-freight-rate index
Sources: S&P Global PMI, Allianz Research
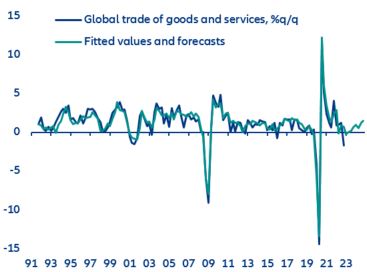
All told, we continue to expect a trade recession and risks are likely on the downside to our global trade forecasts for 2023 and 2024. There are no signs of an imminent recovery in the flow of goods, while the post-pandemic tailwind in services in developed economies should ultimately fade. A potential bright spot that provides a little support to global trade in services is the return-to-normal for Chinese tourists: International flights are approaching just one-third of pre-crisis levels as of mid-April. Our updated global trade model shows that risks to our forecasts for volume growth in global trade of goods and services of +0.9% in 2023 and +3.9% in 2024 are clearly on the downside. Global trade in goods and services is probably in a technical recession since last Fall, and the last quarter of 2022 turned out to be even worse than what we had factored in (providing a very negative carryover effect for 2023). Another contraction could be avoided in Q2, followed by a very mild recovery in the second half of the year and into 2024. Such a scenario means that global trade in volume would come back to the pre-recession level of Q3 2022 only by Q2 2024.
Figure 4: Global trade of goods and services, %q/q
Electric cars – No price war yet
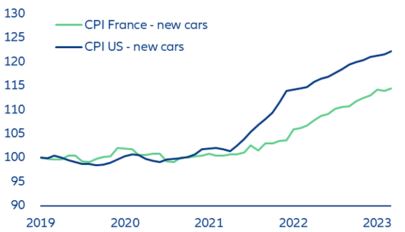
Deep cuts in battery-electric car prices are reviving fears of a price war in the automotive market. But new car prices show no sign of cooling down in the US. Tesla, the world’s largest battery-electric vehicle (BEV) manufacturer, announced another round of substantial price cuts in Europe and North America. Last year, rising new and second-hand car prices (up +7% and +11%, respectively) played a major role in driving headline inflation figures, contributing to the record profits reported by dominant carmakers. Tesla’s move, while significant at a micro level, is unlikely to have any substantial impact at a macro level. With about 30,000 cars registered in France in 2022, the company’s market share is rising but remains below 2%. Since January 2023, the two rounds of price cuts have brought the bill for entry-level versions of its Model 3 and Model Y down by -10% and -21%, respectively. Factoring in the company’s market share, sales mix and the announced priced cuts, and keeping all else unchanged, we find that the announced price cuts would bring down the total French new car price index by just -0.3%. Overall, France recorded a +7.3% increase y/y in March 2023. Applying the same process to the US, we find that lower Tesla prices would have a -0.5pp deflationary impact but overall new car prices still rose by +6.6% (Figure 5).
Figure 5: Consumer price index – new cars (Jan. 2019=100)
Sources: Refinitiv Datastream, Allianz Research
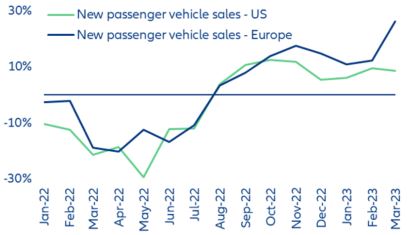
Other companies see no reason to compete on prices when demand continues to recover: We forecast car registrations in Europe and North America to increase by +4% and +7% in 2023, respectively. A macro impact would be more tangible if competitors were to follow Tesla’s example. Applying the same price cuts announced by Tesla not just to the company’s cars, but to all battery-electric vehicles sold in France and the US by its competitors, we compute a -2.2% and -0.9% adverse impact on new car prices, respectively – the gap reflecting the much higher penetration of BEVs in
France (13%) vs.
the US (6%). We find this scenario unlikely. As car registrations have been increasing continuously since August 2022 both in Europe and North America (Figure 6), and order book levels remain above trend, most carmakers can afford minor market-share erosion knowing they will still enjoy rising deliveries. We expect car registrations in Europe and North America to increase by +4% and +7% in 2023, still -27% and -14% below pre-pandemic levels, respectively. Rather than a price war, we expect the progressive rebalancing of supply, which is recovering, and demand, which is expected to soften later in the year, in the European and North American automotive markets to bring car prices back to equilibrium. Finally, input prices, albeit decelerating thanks to the fall in commodity prices, is a welcome yet not sufficient reason to allow for price moderation.
Figure 6: New passenger car registrations (% change y/y)
Sources: Refinitiv Datastream, Allianz Research
Deep price cuts are a risky gamble for carmakers. Another reason why industry-wide price cuts are unlikely lies in the importance of the residual value of vehicles for private customers: Any drop in price for a given new model has an adverse impact on the resale value of the same models already on the roads, and to some extent on similar models. Past examples of deep vehicle price cuts were met with negative reactions from current customers whose cars immediately lost value, prompting them to think twice before buying from the same brand. The issue is even more critical for specialized car fleet companies since the residual value of their fleet accounts for the bulk of their assets – in this respect, new car price cuts are taking a toll on their balance sheets. It also applies to the majority of carmakers operating in Europe and North America that offer leasing services through their financial services arm, but to a much lesser extent to Tesla, whose sales mix relies more on cash purchases and traditional credit financing.
It’s a question of time for battery-electric vehicle prices to adjust downwards as market penetration increases. Finding the right pace to preserve car value but ensure BEVs are becoming more affordable will be a major challenge for carmakers in the coming years. Looking at China, where BEVs account for more than 20% of the market, we observe that prices are going down at a much faster pace as new models are being introduced. Together with competition, it is companies moving down the learning curve (being more efficient in designing and manufacturing BEVs, thanks to accumulated experience), reaching economies of scale (having lower unit costs as volumes go up) and coming up with innovative technologies (emerging battery chemistries, in particular) that will ensure future price parity between internal combustion engine and electric vehicles.
German household savings – 2022 was worse than the 2008 financial crisis
After three years of extraordinarily strong growth (+7.7% on average p.a.), the financial assets of German households decreased by -4.8% to EUR7,462bn in 2022. Good stock-market performance at the end of the year could not compensate for the losses of the first three quarters. In real terms, they declined by a whopping -13.5% in 2022. For comparison, even at the beginning of the global financial crisis in 2008, asset losses were just -4.5%. Moreover, excess savings exist only on paper now; the surge in inflation wiped out all pandemic gains. While nominal values are 10.2% higher than end-2019, financial assets lost 2.1% in value in real terms.
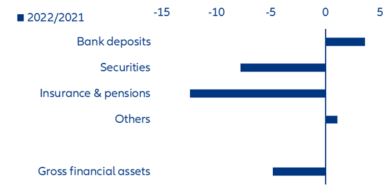
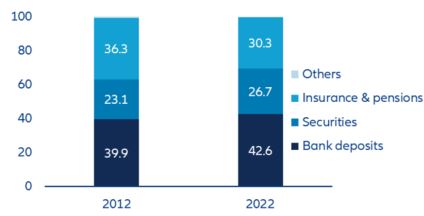
Stocks: The price of the interest-rate turnaround. While assets held in shares clearly felt the effects of the capital market turmoil, debt securities as well as pension and insurance claims suffered particularly from the rising interest rate environment. The losses for securities added up to EUR277.6bn while those of insurance and pension products added up to EUR410.4bn. Year on year, the stocks of assets fell by -7.8% and -12.4%, respectively. Bank deposits, on the other hand, showed robust growth (+3.6%, Figure 7). This asset class is still by far the most popular one in Germany (42.6% of total financial assets), while 30.3% is held in insurance & pension assets and 26.7% in securities (Figure 8).
Figure 7: Growth by asset classes in percentage, 2022 over 2021
Sources: Deutsche Bundesbank, Allianz Research
Figure 8: Asset classes as a percentage of total financial assets, 2012 and 2022
Sources: Deutsche Bundesbank, Allianz Research
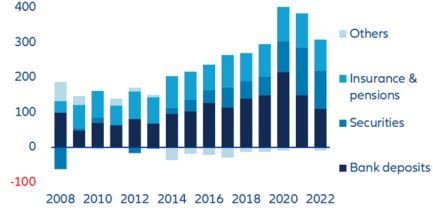
Flows: Fresh love in capital markets products withstands first test. The inflow of new savings totaled EUR297.8bn in 2022, almost 22% less than in the previous year but still more than one-fifth above the long-term average (2012-2022, Figure 9). Of this, a historic 36.6% went into to securities, putting them on a par with the all-time favorite bank deposits (36.5%). – only at the turn of the century, during the heyday of the “Neue Markt” did we see a higher share. On balance, German savers bought shares and investment funds to the tune of EUR109.0bn last year – around 19% less than in 2021, but still more than double the long-term average. Despite all the crises and uncertainties of the past year, German households remained true to their still-fresh love for capital market products. Moreover, they refreshed an old love, too: they acquired debt securities in exceptional amounts (EUR26.4bn), which became more attractive against the backdrop of increased interest rates; 70% of these were purchased in the second half of the year. The last time this category recorded a higher inflow was in 2006 (EUR42.4bn). Since then, savers have sold debt securities worth EUR133.3bn. Cash inflows to insurance and pension products decreased by -10% over 2021 to EUR89.9bn, but were still slightly above the long-term average (EUR87.0bn).
Figure 9: Flows by asset classes in EURbn, 2008-2022
Sources: Deutsche Bundesbank, Allianz Research
Laziness costs money. The increase in bank deposits to EUR3,183bn was again largely driven by the strong, albeit declining, net inflow of new savings, whereas interest income amounted to only EUR2.7bn, or a measly EUR32 per capita. Nevertheless, the share of bank deposits in the asset portfolio even increased by just under 3pps over the past decade.
At least since last July, there has been light on the horizon again for savers who focus on safety: For new business, the average interest rate on deposits with agreed maturity rose to 1.56% by end of 2022 (against 0.08% by end of 2021), and even climbed to 1.98% by February of this year according to the latest available figures. However, German households do not only seem to have a great preference for safety when it comes to investing money; they also seem to be anything but quick to switch to more attractive offers. By the end of 2022, they still held more than two-thirds of their bank deposits in non-interest-bearing overnight deposits; since the interest rate turnaround last July, they have shifted an average of only about 1% of their overnight deposits per month to the more attractive deposits with agreed maturity. This shift generated an interest income of EUR176mn (August to February). In doing so, they missed out on a whopping EUR2.6bn in extra interest income (if the share reduced from two-thirds to 50% held in non-interest-bearing deposits).
Historically low return on assets. In 2022, the poor performance of households’ financial assets as well as shrinking investment income led to a historically weak result in the return on assets achieved. The nominal implicit return – referring to the total sum of gains (and losses) in value and investment income in relation to the asset portfolio – fell to -7.8% and thus was even significantly lower than that recorded in 2008 (-4.0%). While at least the insurance and pension asset class achieved a positive return in 2008, the combination of negative stock-market developments and rising interest rates led to this historically weak result in 2022.
Tighter financing conditions slow down debt growth. The interest-rate turnaround also had an impact on private households’ debt growth. While the weighted average interest rate on all outstanding loans of German households even declined slightly compared to the previous year – as old loans with high interest rates matured – it climbed rapidly from 1.38% to 3.63% in the same period when looking at new business. Due to these tighter financing conditions, debt growth decelerated versus 2021, namely to +4.5% (2021: +5.2%). However, it still remained well above its long-term average (+3.0%). Debt per capita increased to EUR25,890, whereas the debt-to-GDP ratio fell to 55.7% because of the stronger nominal increase in economic output. Finally, net financial assets slumped by a historic -8.1% during last year (-6.4% in 2008); in per capita terms, German savers owned EUR63,760 (net).
German FDI in Africa – Untapped potential for the green transition and critical materials
With its rich supply of minerals such as cobalt, copper and lithium and its geographic proximity, Africa is well positioned to become a critical partner in Europe’s green transition. The EU Green Deal could deepen Africa-EU cooperation, particularly with respect to renewable energy and the critical materials required for electric vehicles, solar panels and wind turbines. The Democratic Republic of Congo (DRC), for example, produces more than 70% of the world's cobalt, while Guinea is a key source of bauxite to make aluminum and Zambia is the world's sixth-largest copper producer. There is also significant potential for the EU and Africa to work together to generate the green hydrogen needed for scaling up electric mobility and renewable-energy generation and storage technologies.
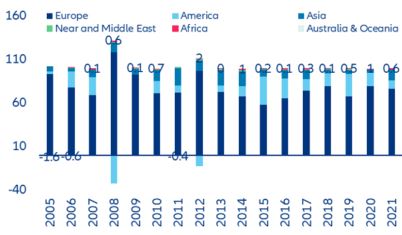
But Germany is lagging behind European peers when it comes to foreign direct investment: only about 1% of its FDI ends up on the African continent. European countries are already a significant investor in Africa, which received EUR75.3bn or 5.2% of Europe’s global FDI in 2021. But Germany remains a smaller player: the UK and France play a major role with a stock of investment equivalent to EUR59bn and EUR54bn respectively, followed by Italy, Switzerland and the Netherlands. In 2021, German companies invested EUR1.6bn in Africa (compared to EUR15.3bn from the UK), with total investments between 2017 and 2021 adding up to EUR6.4bn (Figure 10). Not only is this sum tiny compared to what Germany invests in other regions, but it has also been stagnant for years. In contrast, the stock of investment by French firms has nearly quadrupled and Chinese investment has shown the fastest growth, expanding by a factor of 40 since 2005.
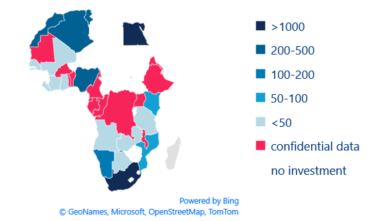
German investment is also very concentrated in a few African countries, mainly South Africa and Egypt, followed by Nigeria, Morocco, Tunisia and Algeria. More than half of Germany's direct investment flows into South Africa, where more than 400 German companies employ about 65,000 people.
With stagnant investment, the significance of German enterprises for African economies is shrinking. Since German FDI is mostly concentrated in manufacturing as opposed to natural resources, companies could miss out on opportunities to partner with Africa in the green energy transition.
Figure 10: German FDI by region, in percentage
Sources: Deutsche Bundesbank, Allianz Research
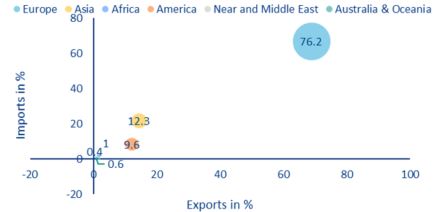
German trade shares with Africa have also been stagnant for years, with only a small fraction ending up in African countries. As trade and investments go hand-in-hand, the major share of German trade and FDI stays in Europe, followed by Asia and America (Figure 12). In 2022, Germany exported EUR26.5bn and imported EUR33.3bn to and from African economies, which equals 1.7% and 2.2% of total German exports and imports, respectively. Like its investments, German trade with Africa is concentrated among a few countries. In 2022,
South Africa, Egypt,
Morocco, Tunisia, Algeria and Nigeria made up 81% of German exports to Africa; South Africa is by far the most important export market, receiving the largest share of 37%. Similarly, nearly three-quarters of German imports come from
South Africa, Egypt,
Morocco, Tunisia, Algeria and Nigeria, with more than half coming from South Africa.
Figure 11: Distribution of German FDI portfolios in Africa, in EUR mn
Sources: Deutsche Bundesbank, Allianz Research
Figure 12: Comparison of German Trade and FDI
Sources: Destatis, Allianz Research. Note: German imports in 2021 in percentage on y-axis, German exports in 2021 in percentage on x-axis. The size of the bubble indicates German FDI in 2021 in percentage.
In this context, Germany and the EU need to drive already existing policy initiatives meant to increase investment in the region and to create a beneficial partnership. Due to the proximity between Europe and Africa, both could benefit from greater diversification and reduction of dependencies. On the other hand, Africa can put its undervalued potential in critical raw materials, renewable energy resources such as wind, solar, geothermal and hydroelectric power to use. The EU has signed off on several new strategic partnerships and projects to encourage investment and job creation in the region, including the EU- Morocco green partnership, the EU-backed Hydrogen Accelerator and a strategic partnership regarding critical materials and green hydrogen with Namibia. But there is clearly room to grow, particularly regarding cooperation and investments in sectors such as clean and affordable energy, new technologies, finance and a circular economy, including also the processing, refining and value add stages in manufacturing.
Yet, local content requirements and regulatory changes with respect to critical raw materials present a potential threat to foreign investors as African countries are increasingly adopting resource-based and broader industrial development strategies that are centered on domestic value added. Some African countries have restricted raw mineral exports and require firms to set up local processing plants. This trend is likely to continue, which means that investing firms should consider in-country value added when making investment decisions and put in place appropriate strategies to mitigate country risk.
Policy rate decisions − end of the beginning or the beginning of the end?
Ahead of the next round of monetary policy meetings next week, continued banking sector stress raises the question of whether financial stability concerns might alter the policy rate path in the US and the Eurozone, allowing inflation to remain higher for longer. While government debt yields have retraced half of their declines since
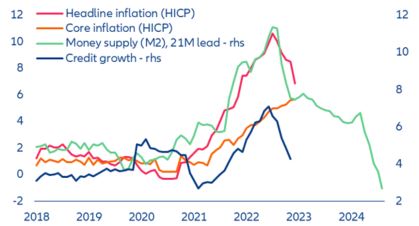
the US bank failures in March, restoring investor confidence will take time, especially after another large US bank seems to be in trouble (First Republic Bank) – and the US Treasury seems hesitant to scale-up deposit protection (for now). Thus, the risk of a deflationary shock from bank failures and retrenching credit seems to be getting more serious. As money supply keeps contracting, it is hard to see a relapse of inflation, even though some bumps along the way of normalizing prices cannot be ruled out (Figure 13).
Figure 13: Eurozone: money supply, credit growth and inflation
Sources: Refinitiv Datastream, Allianz Research
So should the US Federal Reserve and the ECB keep hiking rates or prioritize financial stability over price stability? And above all, considering that the full effects of monetary tightening have yet to materialize, does the current pace of declining inflation warrant further rate hikes at all? For the US Federal Reserve and, to a lesser extent, the ECB, financial stability concerns have already complicated the challenge of setting policy rates to bring down inflation without inflicting excessive damage to growth (and employment). This trade-off is inherently more difficult to manage in Europe, where supply-side pressures, especially due to high energy prices, have had a stronger impact on inflation dynamics in the past. Overall inflation has declined (and more so in the US); however, core inflation is becoming increasingly sticky, especially in the Eurozone, where wage pressures increasingly drive higher prices for services.
In any event, the fight against inflation is likely to become more prolonged unless tightening financing conditions due to more restrictive bank lending slows demand and thus reduces inflation sufficiently to allow the Fed and the ECB to tread more carefully.
Eurozone: more hikes to come
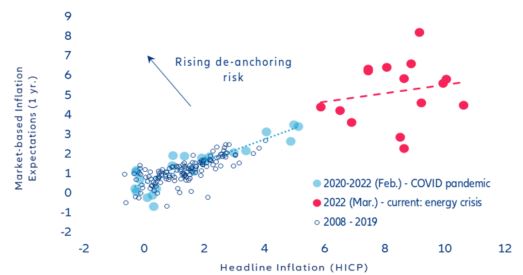
Despite rapidly declining energy inflation, the broadening of price pressures still creates a challenging environment for monetary policy in the Eurozone. In March, headline inflation declined to 6.9% y/y (-1.6pps relative to February), the lowest rate since the start of the war in Ukraine in February 2022. However, core inflation rose to a record 5.7% y/y (+0.1pp). Selling-price expectations show a clear divergence between goods and services. While goods inflation moderated, suggesting that the easing in supply bottlenecks and falling energy prices have started to feed through, price pressures for services remain strong. Nonetheless, the breadth of inflation marginally narrowed, with the share of inflation components registering (y/y) price increases above the ECB’s 2% target declining to 89% (-2pps). In addition, the risk of de-anchoring inflation expectations has declined − consumer expectations have eased while market- and survey-based inflation expectations (ECB’s Survey of Professional Forecasters (SPF) and Survey of Monetary Analysts (SMA)) have remained stable. We expect headline inflation to average 5.6% this year and 2.6% next year.
Figure 14: Eurozone: inflation and inflation expectations
Sources: Refinitiv Datastream, Allianz Research
The steady decline in headline inflation over the last five months will not be enough for the ECB to abandon its restrictive monetary stance. At the same time, the ECB would need to formulate a forward guidance on its policy rate path that does not excessively slow aggregate demand (also considering that the economic impact of tighter financing conditions operate with considerable lag). Financial stability concerns related to spillover effects from continued US banking sector stress to Europe will not go unnoticed but are unlikely to materially influence the ECB’s monetary stance going forward. The European Commission’s finalization of a Directive to bolster the EU’s
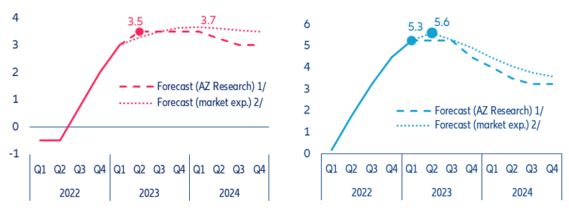
crisis management and deposit insurance framework could send a positive signal to markets and provide the ECB will more leeway. The continued increase in core inflation will reinforce the ECB Governing Council’s conviction that further rate increases are still needed to prevent (still) strong wage pressures from embedding higher inflation in the economy (through “de-anchoring expectations”, Figure 14 above). After the 50bps hike at the last meeting, we forecast two more 25bps hikes in May and June for a terminal rate of 3.5%, with the ECB maintaining a restrictive stance in 2023 despite stagnating growth until Q1 2024 (Figure 15). There is an upside risk of a 50bps hike if the Q1 growth numbers surprise on the upside and spillover risk from the second round of US banking sector stress remains contained.
Figure 15: Eurozone and US – policy rates*
Sources: Refinitiv Datastream, Allianz Research. Note: */ ECB deposit rate and Federal funds rate (upper bound); 1/ as of mid-March 2023 (Q1 2023 Economic Outlook); 2/ latest available (24 April 2023).
Fed: last rate hike in May, then on pause for six months as tighter credit conditions bite economy
In contrast, the Fed is on track to deliver the last rate hike in this cycle (25bps). Although pressures have built in recent days on First Republic bank, the FOMC members will be relieved that the banking crisis has somehow stabilized, with overall regional banks seeing a return of deposit inflows in April. At the same time, while there is increasing evidence that inflationary pressures have started to ease (see below), the Fed will continue to focus on still-elevated current core inflation outturns, which rose +5.6% y/y in the March CPI report (+0.1pp from February). The May FOMC meeting will thus provide Fed policymakers with an opportunity to strengthen further their anti-inflation credentials by pushing the target range of the Fed funds target to 5-5.25%.
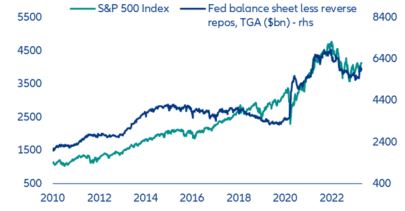
From an anti-inflation credibility perspective, the increase in liquidity – fueled by the banking crisis and the debt-ceiling drama – is unwelcome. It gives the Fed even more arguments to keep rates high for the next few months. Besides, while we think that tighter credit conditions and a weaker economy are already baked into the cake (see below), the Fed may push back against the idea that the rise of its balance sheet since March could fuel inflation down the road. As Figure 16 shows, the Fed’s balance sheet corrected by the Treasury General Account (TGA) and the reverse repos – which is a better measure of underlying liquidity – has picked up substantially since the banking crisis, fueling a rise in the stock market. The rise in Fed’s ‘corrected’ balance sheet has been the result of i) a sharp pick-up in emerging lending to the banking sector in March and ii) the rapid drawdown of the TGA by the federal government, which is seeking alternative sources to fund its deficit as it approaches the debt ceiling limit (fixed at USD31.4trn).
Figure 16: S&P 500 index & Fed’s corrected balance sheet
Sources: Refinitiv Datastream, Allianz Research
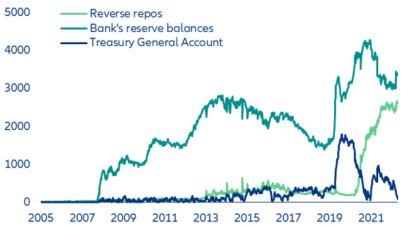
The tapping of emergency lending has boosted banks’ reserves balances on the liability side of the Fed’s balance sheet (Figure 17). A rise in the Fed’s balance sheet, if sustained, could complicate communication and ultimately the Fed’s credibility to fight inflation. As a result, it is more than likely to continue with the roll-off of its asset holdings (MBS and Treasury bonds) until at least the end of the year.
Figure 17: Fed’s balance sheet selected liabilities (USD bn)
Sources: Refinitiv Datastream, Allianz Research
Tighter lending conditions and recession... As we argued recently, the maximum impact of monetary tightening will likely be reached between the middle of 2023 and early 2024, supporting our call of a recession in the second half of 2023. This is because rapidly tightening bank credit standards since the middle of 2022 should eventually lead to a pull-back in new loans to the private sector in the second half of the year, according to usual lags. We also think that property price declines are not over yet, with adverse effects on consumption spending, which will start to show by early 2024. Our estimates show that tightening credit conditions and falling house prices should be enough to push the US economy into a recession.
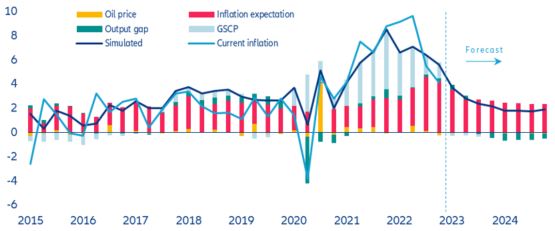
… the only way out of inflation? As such, we expect a -1% decline in GDP between June and December 2023. Such a squeeze in demand should be sufficient to pull inflation down to close to the Fed’s 2% target by Q2 2024, according to our Philips curve equation that links inflation to the output gap and other determinants. We expect the output gap to turn negative by Q3 2023, which will pull down the pace of quarterly price increases to +2% – compatible with inflation normalizing toward 2% on a y/y basis (Figure 18). Note that the effect of the output gap on inflation is more than suggested by its headline contribution. A negative output gap pulls down current inflation, which in turn weighs on inflation expectations, further contributing to the fall of current inflation. The fact that inflation has become more sensitive to the output gap since the pandemic (i.e. the Phillips curve has steepened) also strengthens the argument that a recession should allow inflation to normalize.
Figure 18: Phillips Curve: linking CPI inflation to its determinants (% q/q annualized)
Sources: Refinitiv Datastream, Allianz Research. Note: GSCP = Global Supply Chain Pressures index.
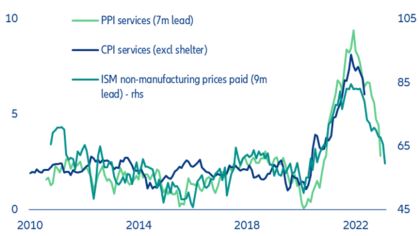
Encouragingly, forward-looking indicators already point to a rapid decline in services inflation in the next eight to nine months (Figure 19). The trimmed CPI measure produced by the Fed of Cleveland (which excludes outliers’ values) indicates that sequential CPI inflation stepped down in March to +0.2% m/m – the lowest outturn since December 2020.
Figure 19: CPI services inflation & forward-looking indicators
Sources: Refinitiv Datastream, Allianz Research. Note: GSCP = Global Supply Chain Pressures index.
Weak economic momentum and falling inflation should be enough to prompt the Fed to cut rates from November, though modestly. We are still expecting a 25bps rate cut in the November meeting, followed by a 50bps cut in the December meeting. This would bring the terminal rate to 4.5% in December 2023. More cuts are likely in 2024, even if we expect rates to remain above their neutral level, maintaining a restrictive monetary policy.
Authors
Ludovic Subran
Allianz Investment Management SE
Jasmin Gröschl
Allianz Investment Management SE
Luca Moneta
Allianz Trade
Maxime Darmet
Allianz Trade
Françoise Huang
Allianz Trade
Kathrin Stoffel
Allianz Investment Management
Aurélien Duthoit
Allianz Trade