Executive Summary
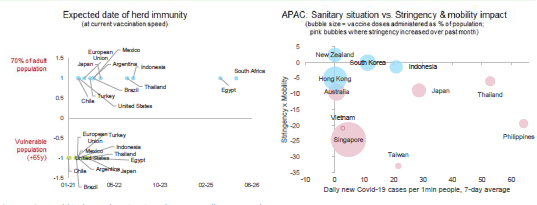
- Vaccine security will shape the grand reopening. While advanced economies delivered on immunization campaigns, vaccine hesitancy and second-generation vaccines are first-order priorities. In the meantime, under-vaccination in Asia and in Emerging Markets may cause desynchronized growth paths.
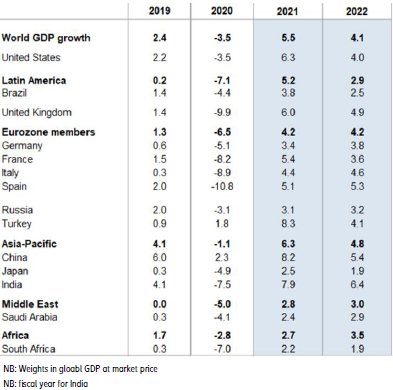
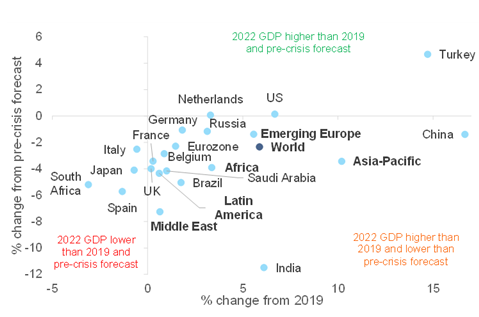
- A multifaceted recovery: high-pressure economics in the US, low-pressure economics in Europe. We expect global GDP to grow by +5.5% in 2021, with the US being a clear outperformer. In Europe, the return to pre-crisis levels will take one year more compared to the US (Q1 2022) and the return to the pre-Covid-19 growth path an extra four years – if it happens at all.
- Revenge spending is happening but residual savings to amount to EUR500bn in Europe, and USD1trn in the US. Consumption will lead the recovery as we expect pent-up demand to reach 3% of GDP in the US and the UK, and around 1.5% of GDP in Europe. However, hoarding behaviors remain for precautionary reasons, complicating policy choices down the road.
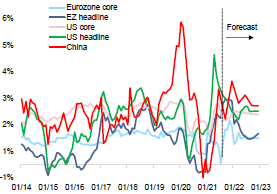
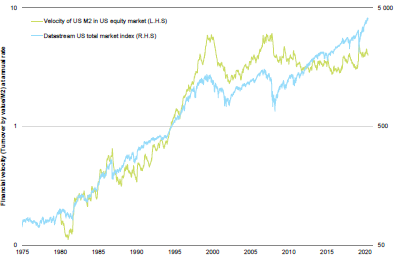
- Inflation, what inflation? Bottlenecks in terms of supply (raw materials, transportation capacity, workers) will likely keep cost inflation at a five-year high until the end of 2021. Companies’ pricing power remains limited, notably in Europe. Households’ purchasing power will be under pressure as the employment gap (4 million jobs in the Eurozone and more than 7 million in the US) will keep wage inflation in check. But no monetary inflation is likely as the velocity of money is at a record low.
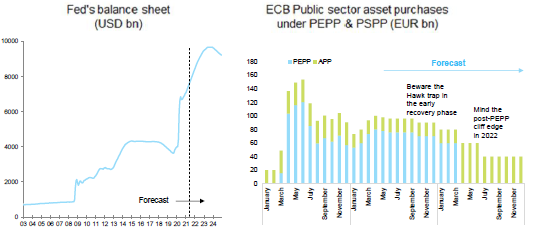
- The Faustian pact between expansionary fiscal and monetary policies is here to stay. We expect central banks to be patient before hiking rates in 2023 (some exceptions: Norway, New Zealand, the UK by September 2022). Total global debt increased by more than USD24trn in 2020, including USD12trn of public debt and USD12trn of private debt. Emerging Markets are more exposed to a sudden shift in market sentiment, which would impose a disorderly adjustment of currencies and debt.
- Political crossroads ahead for Europe but no repeat of the 2012 crisis in 2022. In the Eurozone the Next Generation EU fund and the ECB will support the recovery and keep financial stress at bay while German-French elections may create policy surprises. Yet, watch out for heterogeneity.
- Credit risk under control. The insolvency puzzle continues as corporate debt increased to new highs but cash on the balance sheet did, too, and liquidity support to firms will continue into 2022. European non-financial companies will have to increase their margins by 1.5pp on average in order to make their debt sustainable.
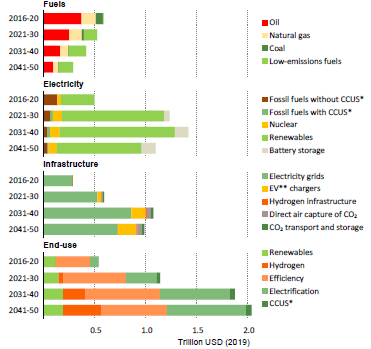
- Green is the new black of industrial policy. The transition towards a cleaner model of growth will require the definition of a real new industrial policy, consisting of generating new fiscal resources, subsidizing the transition, protecting domestic producers and investing in infrastructure. Over the 2021-50 period, annual energy sector investment has to increase by around 1% of global GDP compared to today's levels to enable a net-zero energy transition. With USD1.3trn, investment in renewable electricity will need to surpass the highest level ever spent on fossil fuel supply (USD1.2trn in 2014).
- Political risk remains amid a new US paternalism and tactical multilateralism. The US has launched a new wave of global and multilateral initiatives for climate change and tax policies. But such a revival in international engagement does not necessarily mean unselective multilateralism: so far in 2021, the US has been the most active with trade protectionist measures and China and Germany the most targeted (in net terms). While the Asia-Pacific region could see some acceleration in the expansion and implementation of free trade agreements (eg. RCEP, CPTPP etc.), it is not immune to pre-existing geopolitical tensions that have worsened with the Covid-19 crisis (eg. China and the “Quad”).
- Markets’ risk-on music keeps on playing but mind endogenous financial instabilities. Most asset classes are front-running the grand reopening and strong policy support far better than expected. But the upside is limited now while growing imbalances increase risks to the downside.
Figure 1: Real GDP growth forecasts, %